By Clay Shumate
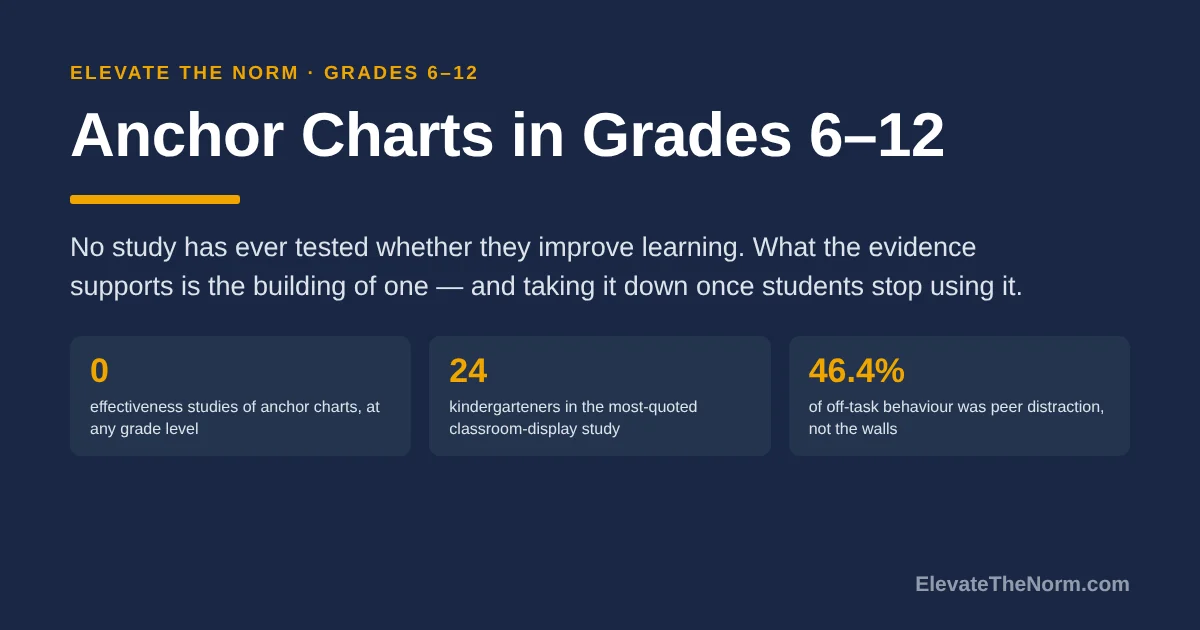
An anchor chart is a reference built with students during a lesson, in their own words, and left visible for later use. No study has ever tested whether anchor charts improve learning. What the evidence supports is the building of one, not the hanging of it, and taking charts down once students stop using them.
Key Takeaways
- There is no study showing anchor charts raise achievement, at any grade level. The two pieces of research with anchor charts as the subject are a dissertation that interviewed five middle school teachers and measured no student outcome, and a kindergarten capstone with 22 students that never reports its own rubric scores.
- The International Literacy Association’s own article on anchor charts cites no anchor chart research either. That is not a gotcha. It tells you the practice spread on reasoning rather than evidence, and the reasoning is mostly sound.
- What separates an anchor chart from a poster is that students helped write it. The ILA defines one as a chart “co-created with students, for students” serving as “a temporary and visible scaffold or cue until a majority of the class reaches independence.”
- The “decorated classrooms distract students” research is real and it is not about teenagers. Every study in that literature ran on children aged roughly 5 to 13, and the one study of adolescents used unrelated pictures and measured no learning at all.
- In a secondary classroom the wall is the weakest part of the practice. A sixteen-year-old will not stare at a chart in front of 29 classmates if looking means admitting she forgot. Photograph it and put it where she can check privately.
What is an anchor chart?
An anchor chart is a visible classroom reference created with students during instruction, recording their thinking in the language they used. The ILA calls anchor charts “organized mentor texts co-created with students,” handwritten in large print and displayed where the class can see them.
The word doing the work there is co-created. The chart is a record of a lesson that happened, not a decoration installed before students arrived. And the same article is explicit about how long it should live: the purpose is “to be a temporary and visible scaffold or cue until a majority of the class reaches independence.” Temporary. That half of the definition gets skipped nearly everywhere, and it is the half this article spends the most time on.
Nobody can tell you who invented the anchor chart. The term comes out of the reading and writing workshop tradition, and the earliest sources in the professional literature are practitioner books rather than studies. A page that credits a specific author is guessing.
How is an anchor chart different from a poster?
A poster states a rule you decided in advance. An anchor chart records a decision the class reached together. The difference shows up in four places, and a chart that fails all four is a poster with better handwriting.
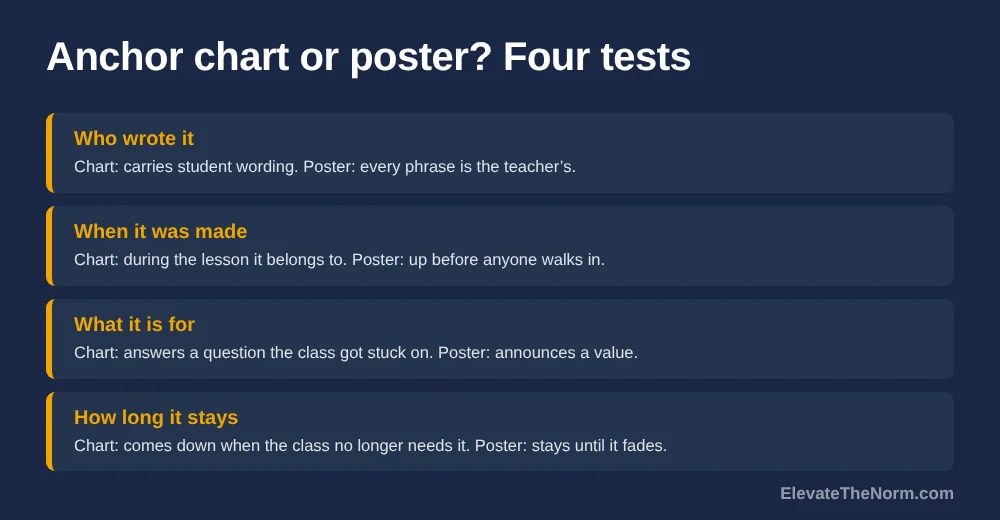
- Who wrote it. A chart carries student wording. If every phrase is yours, students read it the way they read a fire-exit map.
- When it was made. A chart appears during the lesson it belongs to. A poster is up before anyone walks in.
- What it is for. A chart answers a question the class actually got stuck on. A poster announces a value.
- How long it stays. A chart comes down when the class no longer needs it. A poster stays until it fades.
That last one is the test most rooms fail, including rooms run by people who are very good at this. A chart that has been up since September is furniture, and students treat furniture accordingly.
Does research show anchor charts work?
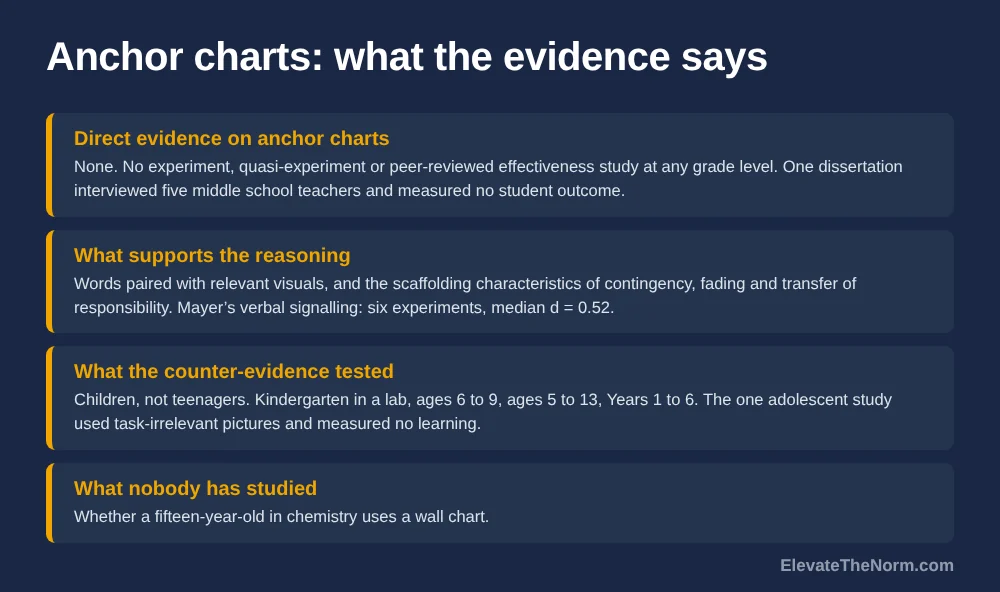
No. Searching ERIC and the open repositories turns up no experiment, no quasi-experiment and no peer-reviewed effectiveness study of anchor charts at any grade level. That is a strong claim, so here is exactly what does exist.
Fontanez’s 2017 doctoral dissertation is titled Examining the Impact of Art-Based Anchor Charts on Academic Achievement in Language Arts. It is a qualitative case study that interviewed five middle school teachers in one South Carolina district. No students were sampled and no achievement was measured. The teachers said the charts helped; that is the finding. A title containing “impact on academic achievement” sitting on top of five teacher interviews is how a practice acquires a research reputation it has not earned.
Simmet’s 2016 master’s capstone studied one kindergarten classroom of 22 students over three weeks. Its rubric scores are never reported as numbers, its methods chapter says six charts were made while the results describe four, and the author notes the result may depend entirely on the individual teacher.
And the practice’s most authoritative professional treatment, the ILA piece quoted above, cites no study of anchor charts at all. Its references are practitioner books.
Be careful about what that means. “No evidence” is not “evidence of no effect” — nobody has run the trial. Plenty of defensible teaching has less behind it, and a practice costing one sheet of chart paper does not need a randomized trial to justify itself. What it needs is for people to stop saying research supports it.
What does the evidence actually support?
Two research lines support parts of the reasoning behind anchor charts. Neither supports the whole practice, and being precise about which part is which separates a defensible claim from a training slide.
Pairing words with relevant visuals
Presenting words alongside a relevant picture beats words alone, and this site covers those figures in its piece on dual coding in grades 6–12. Two cautions carry over. Those studies are computer-based multimedia lessons, not paper on a wall, and the chapters reporting them do not state participants’ ages. And Mayer’s own review found that while verbal signalling worked — six experiments, median d = 0.52 — “visual signaling involving arrows was not found to be effective in promoting transfer posttest performance.” The arrows and colour-coding are decoration until shown otherwise.
Scaffolding, and taking the scaffold away
Scaffolding is defined by contingency, fading and transfer of responsibility. A decade-long review by van de Pol, Volman and Beishuizen located 66 articles and found only eight that tested effectiveness, mostly small and mostly one-to-one, with populations from age five to grade ten. On fading they report that few studies operationalised it at all, “probably because they are complex to measure.” So “fade the chart” is simultaneously the best-grounded and thinnest-evidenced advice here. Know both halves.
What cognitive load theory does not say
This is the one most often misused. People invoke working memory to argue a wall chart offloads cognitive load. The split-attention research says close to the opposite: separating sources a learner must integrate creates a search cost, and it is that act of search that imposes the extra load. The principle applies only when sources are unintelligible alone. A chart escapes the charge by being readable by itself, which also means it is doing less cognitive work than the claim implies. Our piece on what cognitive load theory claims works through the primary research.
Don’t classroom decorations distract students?
Sometimes, in young children, in a laboratory. The research everyone cites is narrower than its reputation, it has a published rebuttal, and no study in it tested a secondary classroom.
The famous one is Fisher, Godwin and Seltman’s 2014 paper in Psychological Science: 24 kindergarten children, six science lessons, a laboratory classroom decorated for half the lessons and stripped for the rest. The article is paywalled and I could not open it, so I will not pretend otherwise — the figures everyone quotes, 42 percent correct in the decorated room against 55 percent sparse, and off-task time of 38.6 against 28.4 percent, come from Carnegie Mellon’s press release, not the journal article. Anyone attributing them to Psychological Science had not read it either.
Then Imuta and Scarf reanalysed Fisher’s own data. Eight of the 24 children (33 percent) missed at least one lesson, so the main analysis rests on 16 children. And attention to the decorated room declined across lessons: the Condition × Lesson interaction was F(2, 30) = 12.80, p < 0.001, and within the decorated condition the lesson effect was F(2, 30) = 9.18, p = 0.001. Their reading is habituation to novelty — children stop looking — though they note the condition difference was still present at lesson three, so both mechanisms may be operating.
That is the wallpaper effect with statistics attached, and it cuts both ways. A chart left up for a month stops distracting anyone. It also stops being seen.
What happens in real classrooms
Two larger studies left the lab and both complicate the simple story. Godwin and colleagues observed 58 elementary classrooms — children aged 6 to 9, 34,289 coded observations — and found students on task 72.7 percent of the time. Visual noise predicted lower on-task rates, but the authors call it a preliminary analysis, significant at the conventional .05 threshold and only marginally significant at their stricter .025; the percentage of wall covered was likewise marginal at .05 and not significant at .025. The finding nobody quotes: peer distractions accounted for 46.4 percent of off-task behaviour, by far the largest source. Students are distracted by each other, not by your wall.
Barrett and colleagues measured 153 classrooms and 3,766 primary pupils in England and found seven design parameters explaining 16 percent of the variation in progress — light, temperature, air quality, ownership, flexibility, visual complexity and colour, with light carrying the largest coefficient. Visual complexity came out curvilinear: heavily decorated and bare classrooms both scored poorly, intermediate levels scored best. The paper recommends no percentage of wall coverage, and neither should anyone citing it. If you have read that a room should be under some specific percentage covered, that number was invented.
And the population problem
Every study above ran on children: kindergarten, ages 6 to 9, ages 5 to 13, Years 1 to 6. The only study I found testing visual environment on adolescents is Rodrigues and Pandeirada’s 2019 work with 64 students aged 13 to 17 in Portugal. Under high visual load they did worse on attention — go/no-go hits 93.16 against 96.77 percent, t(63) = 3.279, p = .004, d = .521 — and on visuospatial span, 5.06 against 5.56, t(63) = 3.717, p < .001, d = .486. Real costs, honestly reported. But the pictures were deliberately “not related to the tasks at hand,” the setting was an isolated room rather than a classroom, and there was no learning outcome at all. It is a reason to keep walls from becoming visual noise, not evidence that anchor charts hurt teenagers.
Nobody has studied whether a fifteen-year-old in chemistry uses a wall chart. I would like that study to exist. It does not.
What does an anchor chart look like in a grades 6–12 class?
It looks like the answer to a question the class got stuck on twenty minutes ago. Most published anchor chart material is elementary, and the secondary examples that exist cluster in grades 6 to 8, so here is what the practice converts to with older students and harder content.
| Subject | A chart worth making | A poster pretending to be one |
|---|---|---|
| English | The four moves the class found in a mentor paragraph, in their words, after reading it | “The 5 Elements of a Thesis Statement” |
| Math | The three errors the class actually made on factoring yesterday, and how each was caught | A printed order-of-operations acronym |
| Science | What counts as a controlled variable, built from the class’s own failed design | The scientific method in seven boxes |
| Social studies | The questions students generated for judging whether a source is trustworthy | A sourcing acronym from a textbook |
| Any subject | The class’s agreed standard for a complete answer, written the day someone asked | “Be Respectful. Be Responsible. Be Ready.” |
The right-hand column is not worthless. Some of it is useful signage. It is just not an anchor chart, and calling it one is how the practice turns into wall decoration.
How do you build one in a single class period?
Six steps, about twelve minutes, made at the point of confusion rather than planned in advance.
- Wait for the stuck moment. Do not plan the chart. Plan to notice when half the room gets something wrong the same way. That is the chart.
- Ask the question out loud and take four answers. Not a vote. Four students saying what they think the rule is.
- Write their words, not better words. This is where most charts die. If a student says “you have to say why you picked it,” write that, not “cite textual evidence to support claims.” The second version is yours, and they will read it as yours.
- Keep it to five lines. Twelve lines is a handout, not a chart. Barrett’s curvilinear result argues against covering the wall, and five lines are legible from the back row.
- Photograph it before anyone leaves and post the photo where students already look — the course page, the LMS. More on why below.
- Point at it once the next day, then stop pointing. If you are still pointing at it in two weeks, the chart is not working and the content needs re-teaching, not re-displaying.


Why is the wall the weakest part of this in secondary?
Because of what it costs a teenager to look at it. A sixteen-year-old who has forgotten the standard for a complete answer has to turn her head, in front of twenty-nine people, toward a chart that exists to help people who forgot.
That is a small public admission, and she will often decline to make it. She will guess instead. Nobody has measured this and I will not dress it up as research, but it is the most predictable thing in the world if you have watched adolescents protect their standing in a room — and it explains something the elementary literature never has to explain: why a reference that visibly works with nine-year-olds goes quiet with fifteen-year-olds. The chart did not get worse. The cost of consulting it went up.
The fix is not a better chart. It is a second copy they can check privately — the photo in the LMS, a half-sheet taped inside a folder, a copy in the slide deck. Make consulting the reference free and they will consult it. This is also the honest answer for families: a reference that exists only on a wall is no help to a student doing homework at nine at night.
When should you take an anchor chart down?
When students have stopped using it, which is usually sooner than it feels. The ILA definition calls a chart a scaffold “until a majority of the class reaches independence,” and a chart that never comes down has stopped being a scaffold.
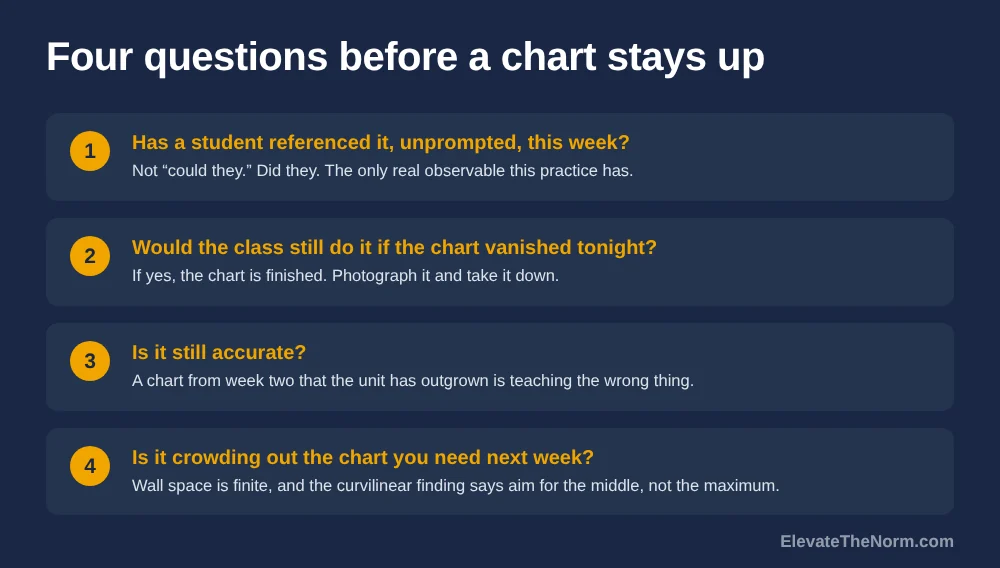
Four questions settle it:
- Has a student referenced it, unprompted, in the last week? Not “could they.” Did they. This is the one thing worth tallying, and the only real observable the practice has.
- Would the class still produce the behaviour if it vanished tonight? If yes, it is finished. Photograph it and take it down.
- Is it still accurate? A chart from week two that the unit has outgrown is actively teaching the wrong thing.
- Is it crowding out the chart you need next week? Wall space is finite, and the curvilinear finding says aim for the middle, not the maximum.
Charts that come down need not be thrown away. Photograph them, keep the photos where students can reach them, and you have a reference library that costs no wall space at all.
Can anchor charts be digital?
Yes, and in secondary the digital copy often does more work than the paper one. A photo in the course page solves the privacy problem above, gives families something usable at home, and handles teaching five sections in three rooms.
What it cannot replace is the making. The part of this practice with the clearest reasoning behind it is the ten minutes where students argue about what the rule is and watch their own words go up. A slide you built on Sunday and projected on Monday is a poster delivered by projector. If you keep one half, keep the making.
That also answers the floating teacher, which secondary throws at people constantly and anchor chart advice almost never addresses. If the wall is not yours, build the chart on paper or under a document camera, photograph it, and live in the digital copy. A tri-fold on a cart works too. The wall was never the point.
What should an administrator or coach look for?
Whether students use the charts. That is the whole observable, and the only one with any logic behind it. A coach can tally one thing: how often a student consults a chart without being told to.
Zero in a full period is useful information about that chart, not about that teacher. And the thing worth not doing is putting “anchor charts visible” on a walkthrough rubric. The moment a chart on the wall counts as evidence of good teaching, every room fills with charts and nobody takes any down — producing exactly the condition the display research warns about and stripping out the feature that defines the practice. You would be rewarding the by-product and quietly penalising the teacher who photographs her charts and clears her wall.
At district scale, two things are worth saying plainly. This costs a sheet of chart paper and a marker, so there is no equity case for buying printed sets; the version with reasoning behind it is the one students help write, and it is free. And the evidence is thin enough that it does not belong in a mandate. The Education Endowment Foundation prints an evidence-security rating beside every approach it reviews. Borrow the habit: recommend anchor charts, explain the reasoning, and claim no research base that is not there.
Clay’s take: the making is the lesson, the wall is the leftover
Anchor charts are worth doing, and almost everything written about them overstates the case. The honest version is smaller and more useful than the sales version.
When a class argues its way to a standard and watches you write their sentence on a piece of paper, something real happens: they have authored the expectation instead of receiving it. That is worth twelve minutes in any grade and it is the part I would defend. The paper that comes out of it is a by-product — useful for a while, then furniture. Secondary teachers get sold the by-product, the laminated set and the printable pack and the wall that photographs well for a walkthrough, and the by-product is the part with no evidence behind it and a literature suggesting students habituate to it within a few lessons.
So build them with students, keep them short, photograph them, and take them down when nobody looks any more. Treat a wall full of September’s charts as a sign something needs re-teaching, not as proof the room is working. And if someone tells you research shows anchor charts raise achievement, ask them for the study. I looked.
What to do next
Pick the next thing your classes get wrong in the same way. You probably already know what it is.
When it happens, stop, take four student answers, write five lines of their language on paper, photograph it, and post the photo where they can see it without turning around. In a week, ask whether anyone has used it; if not, take it down and re-teach the thing. The related pieces here are scaffolding strategies for grades 6–12 on how support gets withdrawn, the Frayer model for when one word needs the four-box treatment, and note taking strategies for high school students for the version that lives in the student’s notebook instead of on your wall.
Frequently Asked Questions
Do anchor charts actually work?
There is no experiment or peer-reviewed effectiveness study of anchor charts at any grade level, so nobody can honestly say research proves they work. The reasoning behind them is sound: pairing words with relevant visuals is well supported, and co-constructing a reference matches what the scaffolding literature describes. Treat anchor charts as defensible practice with thin evidence, not as an evidence-based intervention.
What is the difference between an anchor chart and a poster?
Students helped write the anchor chart. A poster states a rule you decided in advance and displayed before anyone arrived. The International Literacy Association defines an anchor chart as co-created with students during instruction and intended as a temporary scaffold until most of the class reaches independence. A chart that has been on the wall since September has become a poster regardless of how it started.
Are anchor charts only for elementary school?
No, but almost all the published material is elementary, and the secondary examples that exist cluster in grades 6 to 8. In a high school classroom the co-construction transfers directly while the wall display works less well, because consulting a reference in front of classmates carries a social cost for teenagers that it does not carry for nine-year-olds. A photographed copy students can check privately solves most of that.
Do classroom decorations distract students?
In young children, in laboratory conditions, there is evidence they can. Every study in that literature ran on children aged roughly five to thirteen, the most-cited one used 24 kindergarteners in a lab, and a published reanalysis of its data argued part of the effect was children habituating to novelty. The largest real-classroom study found peer distractions, not walls, accounted for 46.4 percent of off-task behaviour.
How much of my wall should be covered?
No research supports a specific percentage, and any page quoting one invented it. The largest study of real classrooms found the relationship was curvilinear: both heavily decorated and bare rooms scored poorly on pupil progress while intermediate levels scored best. That study deliberately recommends no number. Aim for legible and purposeful rather than for a target.
Can anchor charts be digital?
Yes, and in secondary a digital copy often does more work than the paper one. A photo in the course page lets a student check the reference without turning around in front of the class, gives families something to use at home, and solves teaching several sections in different rooms. What a digital copy cannot replace is the making, which is the part of the practice with the clearest reasoning behind it.
When should I take an anchor chart down?
When students have stopped using it, which is usually sooner than it feels. Ask whether anyone has referenced it unprompted in the last week, whether the class would still produce the behaviour without it, whether it is still accurate for the current unit, and whether it is crowding out the chart you need next. Photograph it first so you keep the reference without keeping the wall space.
What if I float between classrooms?
Build the chart with the class on paper or under a document camera, photograph it, and live in the digital copy. A tri-fold board on a cart works too. The co-construction is the part that matters and it does not require owning a wall, which is worth knowing because floating and room-sharing are common in secondary and almost never addressed in anchor chart advice.
Sources
- Moses, E., & Lee, H. Imitate and Innovate Anchor Charts. ILA E-ssentials No. 8065, International Reading Association (2014). Full text (PDF). Source of the definition and of the “temporary and visible scaffold” purpose statement. A practitioner article, not a study; it cites no research on anchor charts, which is the point made in the body.
- Fontanez, K. I. Examining the Impact of Art-Based Anchor Charts on Academic Achievement in Language Arts. Ed.D. dissertation, Walden University (2017). ERIC ED581971. ERIC record. Qualitative case study interviewing five middle school teachers in two South Carolina schools; no students sampled and no achievement measured. The ERIC record was read; the full dissertation was not opened.
- Simmet, C. How Anchor Charts Can Engage Students in Interactive Read-Alouds. M.A. capstone, Hamline University (2016). Full text (PDF). One kindergarten classroom, 22 students, three weeks, teacher-made engagement rubric whose scores are never reported numerically.
- Mayer, R. E. Multimedia instruction. In Spector et al. (Eds.), Handbook of Research on Educational Communications and Technology, pp. 385–399. Springer (2014). Full text (PDF). Source of the verbal-signalling figure (six experiments, median d = 0.52) and of the finding that visual signalling with arrows was not effective for transfer. The chapter does not state participants’ ages.
- van de Pol, J., Volman, M., & Beishuizen, J. Scaffolding in teacher–student interaction: A decade of research. Educational Psychology Review 22(3), 271–297 (2010). Full text (PDF). Source of contingency, fading and transfer of responsibility, of the count of eight effectiveness studies out of 66 articles, and of the finding that few studies operationalised fading.
- Carnegie Mellon University press release, carried by ScienceDaily, 27 May 2014. Press release. The source of the 42 vs 55 percent and 38.6 vs 28.4 percent figures quoted in the body. Cited as a press release because the underlying Psychological Science article (Fisher, Godwin & Seltman, 2014) is paywalled and could not be opened.
- Imuta, K., & Scarf, D. When too much of a novel thing may be what’s ‘bad’: commentary on Fisher, Godwin, and Seltman (2014). Frontiers in Psychology 5, Article 1444 (2014). Full text. Peer-reviewed reanalysis of the original authors’ own data. Source of the 24-child sample, the 33 percent attrition, the 16 children with complete data, and the habituation argument with its F statistics.
- Godwin, K. E., Seltman, H., Scupelli, P., & Fisher, A. V. Attentional Competition in Genuine Classrooms: Analysis of the Classroom Visual Environment. Proceedings of the Annual Meeting of the Cognitive Science Society, Vol. 42 (2020). Full text (PDF). 58 elementary classrooms, children aged 6–9, 34,289 coded observations. Source of the 72.7 percent on-task rate, the 46.4 percent peer-distraction figure, and the authors’ own caution that the visual-noise result is preliminary and only marginally significant at their stricter threshold. Correlational; no learning outcome measured.
- Barrett, P., Davies, F., Zhang, Y., & Barrett, L. The impact of classroom design on pupils’ learning: Final results of a holistic, multi-level analysis. Building and Environment 89, 118–133 (2015). Full text (PDF). 153 classrooms, 27 schools, 3,766 pupils, Years 1–6, England. Source of the seven parameters explaining 16 percent of variance and of the curvilinear complexity result. Recommends no wall-coverage percentage.
- Rodrigues, P. F. S., & Pandeirada, J. N. S. The Influence of a Visually-Rich Surrounding Environment in Visuospatial Cognitive Performance: A Study with Adolescents. Journal of Cognition and Development 20(3), 399–410 (2019). Full text (PDF). 64 adolescents aged 13–17, Aveiro district, Portugal. The only study located testing visual environment on adolescents. Source of the go/no-go and Corsi figures. The pictures were task-irrelevant and no learning outcome was measured.
- Education Endowment Foundation. Collaborative learning approaches. Teaching and Learning Toolkit. Toolkit entry. Cited only as the example of publishing an evidence-security rating alongside a recommendation.