Tag: secondary teaching

  • Formative Assessment Strategies in Science That Catch a Misconception Before the Unit Test

    Formative Assessment Strategies in Science That Catch a Misconception Before the Unit Test

    By Clay Shumate

    Formative assessment strategies in science are the short, ungraded checks you run mid-lesson to find out what model a student is actually using — not just whether the answer is right. In science that distinction matters more than in most subjects, because a student can reach the correct result from a wrong theory and nobody finds out until a transfer question in March.

    That is the case for doing this. The case against overselling it comes next, and it is stronger than most articles on this topic will tell you.

    Key Takeaways

    • The famous effect size is not real. The often-quoted 0.40–0.70 for formative assessment was not supported when somebody went and checked. The best meta-analysis found a weighted mean of 0.20 — and 0.09 in science, the lowest of the three subjects.
    • That 0.09 is contested too. A published commentary by five assessment researchers challenged the study selection and the effect-size calculations. Do not use the small number as a reason to skip formative assessment any more than you should have used the big one as proof.
    • Chase the model, not the answer. The checks that pay in science are the ones that make a student’s underlying theory visible — a written prediction, a forced choice plus an explanation, a piece of reasoning.
    • Reasoning is the part they cannot do. In the claim-evidence-reasoning framework, the claim is the easiest piece for students. A correct claim is close to no information on its own.
    • If it takes an evening to read, it will not survive October. Every strategy below is designed to be readable in the time between classes.

    What Are Formative Assessment Strategies in Science?

    They are checks run during instruction, for the purpose of changing instruction, and they are not graded. That last clause is the one people drop. A quiz you record is a small summative assessment, and the moment students know it counts they start writing what they think you want instead of what they believe — which destroys the only thing you were collecting it for.

    The Developing Assessments for the Next Generation Science Standards report from the National Research Council puts classroom assessment at the centre of instruction and separates its two jobs cleanly: formative assessment guides instructional decisions and lesson planning, summative assessment assigns grades. The same report sets the bar that makes science assessment hard. Three-dimensional science learning asks students to use science practices and crosscutting concepts in the context of disciplinary core ideas, and assessment tasks therefore need multiple components reflecting that connected use. The committee is blunt that tasks like these are challenging to design, implement and interpret, and that teachers will need real professional development to do it.

    This is the general version of the argument we make in the main list of formative assessment strategies. What follows is the part that is specific to a science room.

    Does Formative Assessment Actually Work Better in Science?

    On the measured evidence, science is the weakest of the three subjects studied — and the measurement itself is disputed. Anyone who tells you formative assessment is a 0.7-effect intervention in your biology class is quoting a number that was checked and did not hold up.
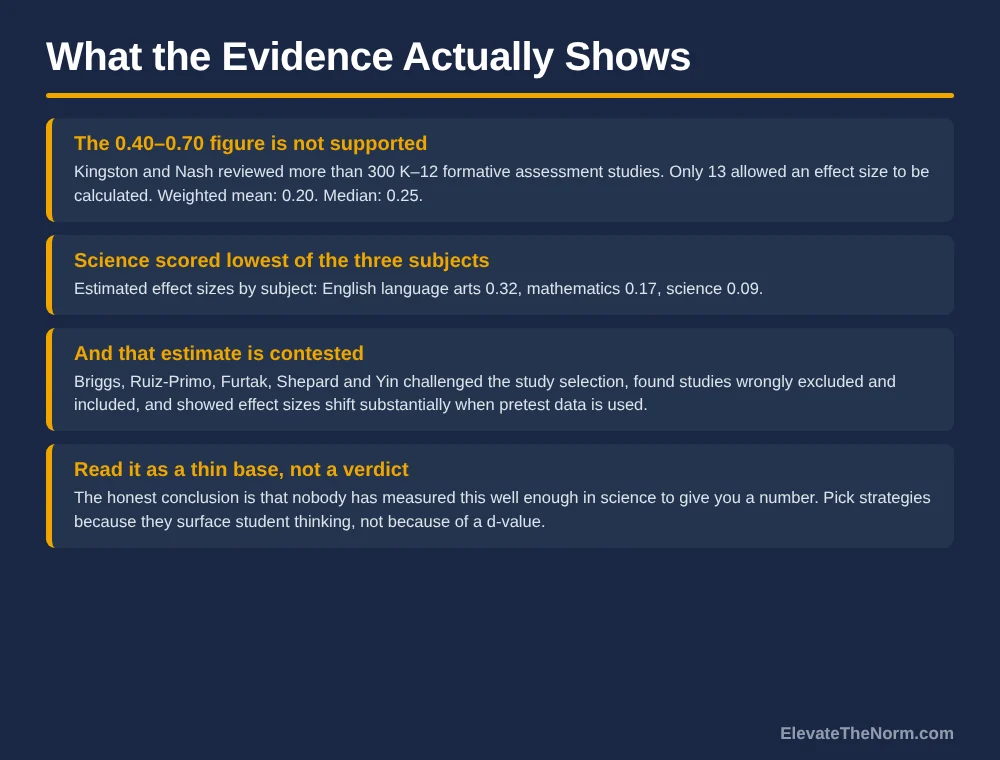
    Four-row graphic on formative assessment evidence: the 0.40 to 0.70 claim is unsupported, Kingston and Nash found a weighted mean of 0.20 from 13 usable studies, subject effect sizes of 0.32 for English language arts, 0.17 for mathematics and 0.09 for science, and a published critique of that estimate
    Science scores lowest of the three subjects, on a very thin evidence base.

    Here is what happened. Neal Kingston and Brooke Nash reviewed more than 300 studies that appeared to address formative assessment in grades K–12. Their abstract states plainly that the commonly claimed effect of about 0.70, or 0.40 to 0.70, “is not supported by the existing research base.” Many studies had severely flawed designs yielding uninterpretable results. Only 13 provided enough information to calculate an effect size at all, producing 42 independent estimates. The median observed effect was 0.25; the weighted mean under a random-effects model was 0.20. Their moderator analysis estimated 0.32 for English language arts, 0.17 for mathematics and 0.09 for science.

    Then the argument got better rather than worse. Derek Briggs, Maria Araceli Ruiz-Primo, Erin Furtak, Lorrie Shepard and Yue Yin published a commentary in the same journal challenging the analysis on four grounds: that the keyword search was not validated and could not be fully replicated, that the inclusion criteria were applied inconsistently — they name two studies that met the criteria and were excluded and one that was wrongly included — that effect sizes computed without pretest data diverge substantially from adjusted ones, and that the analysis never examined whether outcome measures close to the taught curriculum inflated results differently across subjects.

    So the responsible reading is not “formative assessment barely works in science.” It is that 13 usable studies out of 300 is not an evidence base, and the subject-level split sits on a fraction of those 13. We treat contested evidence as contested on this site, and this is as contested as school research gets.

    Which leaves you with a practical standard instead of a statistical one: use a check because it makes student thinking visible to you in time to act on it. That is a claim you can verify in your own room by Friday, and it does not depend on anyone’s meta-analysis.

    Why Science Is Different From Reading and Writing

    Because the wrong ideas students bring in are coherent, useful to them, and survive being taught the right answer. A student who thinks heavier objects fall faster is not missing information; they have a working theory built from a decade of watching things fall, and it predicts most of what they have seen. Telling them the correct rule does not remove the theory. It adds a second one they use on tests.

    This is why the science version of “check for understanding” has to go after the model. A thumbs-up, a right answer on a plug-in-the-formula problem, or a confident nod all leave the old theory completely intact. Our broader piece on checking for understanding makes the case against compliance signals generally; in science the gap between the signal and the understanding is just wider.

    The second difference is the three-dimensional structure described above. A check that only asks students to recall a core idea is assessing one third of what the standards ask for and none of the practice. The strategies below are chosen because most of them put a practice — arguing from evidence, analysing data, constructing an explanation — into a five-minute container.

    Nine Formative Assessment Strategies That Fit Inside One Science Period

    Every one of these is readable in a planning period and none of them needs to be graded. Pick two and run them until they are automatic rather than trying all nine in a week.

    Numbered graphic listing nine formative assessment strategies for science: misconception probe, prediction before data, claim evidence reasoning exit slip, card sort, graph read, one-criterion notebook check, confidence rating, error analysis, and student-written question
    Nine checks, each short enough to run inside one period.

    1. The misconception probe. A short forced choice among several plausible student ideas, followed by “explain your thinking.” NSTA has published these for years as the Uncovering Student Ideas series by Page Keeley, and the teacher notes that come with them summarise the research behind each misconception. You can write your own in ten minutes once you know the common wrong answers in your unit. The choices are the hook; the explanations are the data.

    2. Prediction before data. Before the lab or the demo runs, every student writes down what will happen and why. Thirty seconds. The “why” is the whole point — a wrong prediction with sound reasoning is a different student than a right prediction with no reasoning, and only one of them needs reteaching. It also stops the quiet rewrite where students adjust their memory of what they expected once they see the result.

    3. The claim-evidence-reasoning exit slip. One claim, one piece of evidence from today’s data, one sentence of reasoning. Ten minutes at the end of class gives you a whole-class picture of who can connect data to a conclusion. More on what to look for below.

    4. Card sort. Twelve items to sort into examples and non-examples of a concept — physical and chemical change, or inherited and acquired traits. Sorting takes four minutes. The assessment is the argument over the three hard cards, and you should be circulating with a notebook while it happens.

    5. The graph read. Hand them an unfamiliar graph from the same system and ask one question: what does the slope mean here? Students who have learned a procedure answer the shape; students who understand the science answer the quantity. This is the fastest way to separate the two.

    6. One-criterion notebook check. Walk the room and check every notebook against exactly one thing — units, or the controlled variable, or whether the axis is labelled. A full notebook review does not scale and so it does not happen. A single-criterion pass takes six minutes and actually happens.

    7. Confidence rating. Answer the question, then rate how sure you are. The quadrant that matters is confident-and-wrong, because those students will not ask for help and will not revise. Unsure-and-right is a different problem and needs reassurance rather than reteaching.

    8. Error analysis. Give them a flawed explanation and ask them to find the fault. Catching a bad inference is cognitively harder than producing a tidy one, and it tells you whether a student can evaluate reasoning or only generate it. Write the flawed version yourself from the errors you saw last year.

    9. The student-written question. Ask each student to write a test question on today’s objective. What they think is worth testing tells you exactly what they think the lesson was about, which is frequently not what you thought it was about.

    What If You Teach 150 Students?

    Then you read a sample, not a set. Nobody reads 150 exit slips in a planning period, and pretending otherwise is how a good strategy dies in week three.

    Take one class’s worth — thirty slips — and sort them into three piles as you go: has it, partly has it, does not have it. Do not write on them. Count the piles, read four or five from the middle pile properly, and that is your instructional decision made in eight minutes. If the sampled class is wildly different from what you saw while circulating in the others, sample a second class before you change anything.

    The sample is for the decision. The individual feedback is a separate job and does not have to happen on every check — which is the trade most teachers get backwards, giving thin comments to everyone instead of a real decision to themselves.

    How Do You Check Reasoning and Not Just the Answer?

    Use claim, evidence and reasoning as three separate things to look at, and spend your attention on the third one. Katherine McNeill and Joseph Krajcik, writing for NSTA Press on assessing middle school students’ written scientific explanations, are direct about the asymmetry: the claim is the easiest component for students to construct.
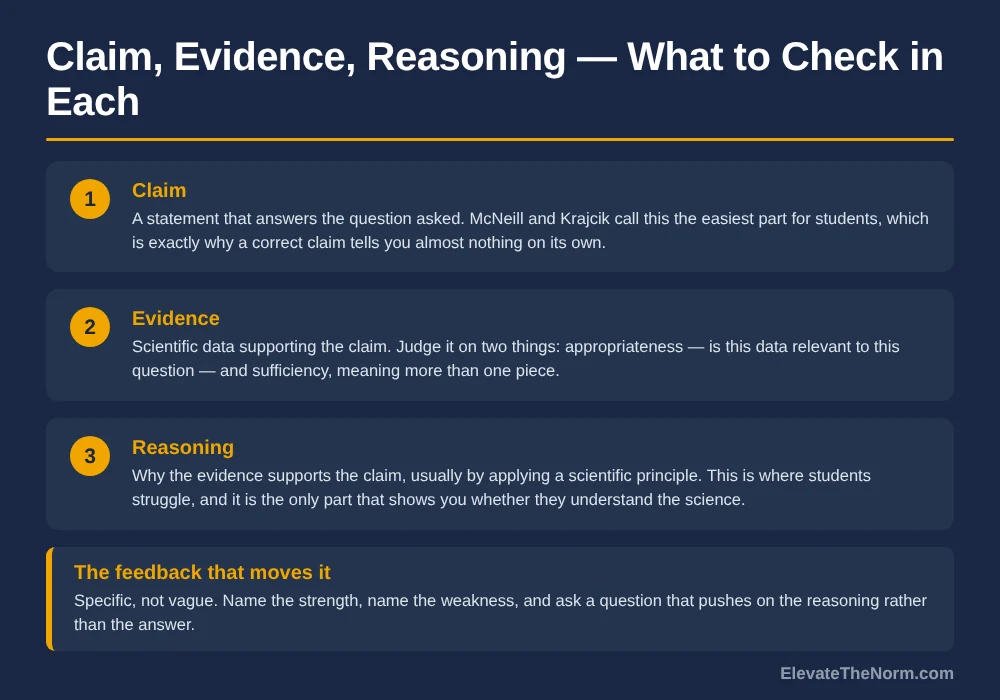
    Three-card graphic breaking down the claim, evidence and reasoning framework and what a teacher should check in each part, with a fourth row on giving specific feedback
    Reasoning is the part that tells you whether they understand the science.

    Their framework splits the work. The claim is a statement that answers the question. The evidence is scientific data supporting it, and they give you two criteria for judging it: appropriateness, meaning the data is actually relevant to the problem, and sufficiency, meaning students use more than one piece rather than resting on a single data point. The reasoning is the justification for why that evidence supports that claim, and it usually requires applying a scientific principle — which is also what tells students what counts as evidence in the first place.

    They report that students often struggle to justify their claims appropriately, which is the finding with the most practical consequence here. If you mark a CER response by checking whether the claim is right, you will grade a lot of students as proficient who cannot explain why anything follows from anything.

    One caution the framework does not raise and a science teacher has to. A written explanation is a literacy task sitting inside a science check, and a student who understands the chemistry but cannot yet produce a paragraph in English will score as not understanding the chemistry. That is a measurement error, not a finding. Sentence stems fix most of it — “My claim is… The evidence that supports this is… This matters because…” — and for students on language or writing accommodations, take the reasoning verbally or as a labelled diagram. You are assessing whether they can justify a claim, not whether they can type it.

    On feedback, their guidance is specific rather than encouraging: identify the particular strength, identify the particular weakness, suggest an improvement, and ask a question that pushes on the thinking. “Good evidence — explain more” is not feedback. “Your evidence is relevant but it is one trial; what would a second trial have to show for your claim to hold?” is.

    Where Science Formative Assessment Goes Wrong

    Four failure modes, and three of them are about what happens after the data arrives.

    You collect and do not act. This is the big one. A probe you read on Saturday and never mention again is a worksheet. If you are not willing to change Monday, do not run it on Friday.

    You reteach by repeating. If a dozen explanations contain the same wrong idea, you have found a shared model, and volume does not displace a model. Find the case their theory cannot explain and build ten minutes around that instead.

    You grade it. Covered above and worth repeating, because it is the most common way a good probe gets ruined. Record completion if you must record something.

    Say that part out loud to the room, and be ready to say it to a parent. Teenagers are not stupid about ungraded work; left unexplained, “this does not count” reads as “this does not matter,” and the effort drops accordingly. The version that works is the honest one: this is not graded because I need to know what you actually think, and if it counted you would write what you think I want. A parent asking why work in the gradebook is marked complete rather than scored gets the same sentence. It is a better answer than most grading policies can give.

    The other half of the dignity question is what you do with a wrong answer once you have it. Patterns go on the board; names do not. The whole arrangement depends on students believing that telling you what they really think is safe, and one wrong explanation read aloud with an author attached ends that for the year.

    You run too many. Nine strategies in one article is a menu, not a schedule. Two strategies you run every week beat nine you run once, both for your sanity and because students get fluent in a format and stop spending their effort decoding the task. That is the same argument as the one for stable classroom routines, applied to assessment.

    What to Do Next

    Pick two. One that runs before instruction — the misconception probe or the written prediction — and one that runs after, which for most science rooms should be the CER exit slip. Run them for three weeks before you judge them, because the first week measures how well students understand the format rather than the content.

    Then write down what you changed. If after three weeks you cannot name a lesson you taught differently because of what a check told you, the problem is not the strategy. It is that the data is arriving somewhere that does not feed a decision, and that is fixable in a way a 0.09 effect size is not.

    One note for anyone reading this with a department rather than a classroom in mind. Eight of these nine checks run on paper and none of them needs a device, a subscription or a consumable, which matters in a building where the lab budget and the technology cart are not evenly distributed. What they do need is the thing the National Research Council flagged: the skill to design and interpret them. That is a department-level job. A shared bank of probes for the three units everyone teaches, built once and reused, is worth considerably more than nine teachers each inventing their own in September.

    The sibling guides for other subjects are built the same way: formative assessment in reading and in writing, and the printable strategy guide collects the cross-subject versions in one free download.

    Frequently Asked Questions

    What are formative assessment strategies in science?

    They are the short, low-stakes checks a science teacher runs during a lesson or unit to find out what students actually think before the summative assessment does it for them. In science specifically they have to surface the student’s model of how something works — not just whether they got the answer — because a student can produce a correct result from a wrong mental model and nobody notices until the transfer question.

    Is formative assessment proven to work in science?

    Less than you have been told. Kingston and Nash’s meta-analysis found a weighted mean effect size of 0.20 across subjects and an estimated 0.09 in science — the lowest of the three subject areas they examined — from only 13 studies that were methodologically usable out of more than 300 reviewed. A published commentary then challenged that estimate on several grounds. The honest summary is that the research base is too thin to give you a number in either direction.

    How is science formative assessment different from reading or writing?

    Two things. First, science misconceptions are durable — students arrive with working theories about force, heat, inheritance and seasons that instruction often fails to displace, so a check has to go after the model and not the vocabulary. Second, the Next Generation Science Standards ask for three dimensions at once: a disciplinary core idea, a science practice and a crosscutting concept. A check that only tests recall is not assessing what you are teaching.

    How long should a formative check take?

    Five to ten minutes, and the reading of it should take less than that. If a strategy costs you twenty minutes of class and an evening of marking, it will not survive October, which means it is not a strategy — it is a one-off. The one-criterion notebook check exists precisely because a full notebook review does not scale and a single-criterion pass does.

    Do I have to grade formative assessments?

    No, and grading them usually ruins them. The moment a probe counts, students answer what they think you want rather than what they believe, and the data you wanted disappears. Record completion if your gradebook needs something. Keep the content ungraded.

    What is a misconception probe?

    A short question — often a forced choice between several plausible student ideas — followed by “explain your thinking.” NSTA publishes a long-running series of them under the title Uncovering Student Ideas, written by Page Keeley, with teacher notes that summarise the research on each misconception. The choice is only the hook. The explanation is the assessment.

    What do I do when half the class gets it wrong?

    Reteach, but not by repeating. If the same wrong idea shows up in a dozen explanations you have found a shared model, and saying the correct version louder does not displace a model — confronting it with a case it cannot explain does. Pick the piece of evidence their idea gets wrong and build the next ten minutes around that.

    Can I use these strategies without lab equipment?

    Most of them, yes. The misconception probe, card sort, graph read, error analysis and student-written question all run on paper. Prediction before data needs a demonstration rather than a full lab, and a single front-of-room demo works. The claim-evidence-reasoning exit slip needs data, which can be a data set you hand out rather than one the class collected.

    Sources

    1. Kingston, Neal, and Brooke Nash. “Formative Assessment: A Meta-Analysis and a Call for Research.” Educational Measurement: Issues and Practice, vol. 30, no. 4, 2011, pp. 28–37. More than 300 K–12 studies reviewed; only 13 allowed effect-size calculation, yielding 42 independent effect sizes. Median 0.25; random-effects weighted mean 0.20. Moderator estimates: ELA 0.32, mathematics 0.17, science 0.09. Cited from the published abstract via the ERIC record; the full article sits behind a publisher paywall and was not read in full. https://eric.ed.gov/?id=EJ951173
    2. Briggs, Derek C., Maria Araceli Ruiz-Primo, Erin Furtak, Lorrie Shepard, and Yue Yin. “Meta-Analytic Methodology and Inferences About the Efficacy of Formative Assessment.” Educational Measurement: Issues and Practice, 2012. Commentary challenging Kingston and Nash on four grounds: unvalidated and non-replicable keyword search; inconsistently applied inclusion criteria, naming Andrade et al. (2008) and Bonner (2009) as wrongly excluded and one study as wrongly included; divergence between effect sizes computed with and without pretest data; and unexamined effects of curriculum-proximal outcome measures. A commentary, not an independent meta-analysis — it argues the estimate is unreliable, not that a different number is correct. https://www.colorado.edu/education/sites/default/files/attached-files/EMIP_Commentary_FINAL_082012.pdf
    3. National Research Council. Developing Assessments for the Next Generation Science Standards. National Academies Press, 2014. Places classroom assessment at the centre of instruction; distinguishes formative assessment (guiding instructional decisions) from summative (assigning grades); states that three-dimensional assessment tasks require multiple components reflecting the connected use of science practices, crosscutting concepts and disciplinary core ideas, and that such tasks are challenging to design, implement and interpret. https://nap.nationalacademies.org/read/18409/chapter/2
    4. McNeill, Katherine L., and Joseph S. Krajcik. “Assessing middle school students’ content knowledge and reasoning through written scientific explanations.” National Science Teachers Association Press. Defines the claim-evidence-reasoning framework; identifies the claim as the easiest component for students to construct, sets appropriateness and sufficiency as the two criteria for evidence, and describes reasoning as the justification that applies a scientific principle. Reports that students often have difficulty appropriately justifying their claims, and recommends explicit, specific feedback over general comments. A book chapter written for practitioners, not a peer-reviewed empirical report; the version read is the authors’ accepted manuscript and carries no publication year on its face. https://websites.umich.edu/~krajcik/McNeill&Krajcik_NSTA.pdf
    5. “Uncovering Student Ideas Probes.” National Science Teaching Association. Describes the probe series by Page Keeley as questions designed to reveal what all students are thinking and to uncover initial ideas and misconceptions about core concepts, with teacher notes containing research summaries and instructional suggestions. A publisher’s description of a commercial series, cited for what a probe is rather than as evidence of effect. https://www.nsta.org/uncovering-student-ideas-probes
    About Clay Shumate

    Clay Shumate is a certified secondary Social Studies teacher in the public schools of West Alabama, with seven years of classroom experience, a B.A. in History, and an M.Ed. in Secondary Education. He writes about project-based learning, student responsibility, respect, and practical ways to hold young people to a higher standard while giving them room to learn from mistakes. He is a member of the Society of Professional Journalists and writes to its Code of Ethics; this site’s editorial standards and corrections policy are published in full. More about Clay.

  • End of Year Teacher Reflection: The Eight Decisions Worth Making Before You Clear the Room

    End of Year Teacher Reflection: The Eight Decisions Worth Making Before You Clear the Room

    By Clay Shumate

    An end of year teacher reflection is a short, structured review you run in the last two weeks of school to decide what to keep, what to cut, and what to fix before next year. It works when it ends in written decisions you will actually reopen in August. It fails when it ends in a form that goes into an evaluation file nobody reads again.

    Most of us do the second one. The district sends a self-assessment in May, you fill it in between a final exam and a textbook count, and it disappears. Then August arrives and you rebuild the same course with the same two problems in it, because the only record of what went wrong was in your head in June and your head in June is not reliable.

    Key Takeaways

    • Reflection that does not end in a decision is description. In one study of 198 reflective texts written by pre-service teachers, 84 percent stayed at the descriptive level and exactly one reached critical reflection. Writing more is not the fix. Deciding something is.
    • The research base is thinner than the advice. A review of the teacher-reflection literature found studies linking reflection to better instruction and not one that measured whether it improved student learning. Treat it as a decision tool, not a proven lever.
    • Gather before you think. Your gradebook, your students’ opinions and your student work samples all become hard or impossible to reach once the roster rolls over. Export in the last two weeks; think afterward.
    • Eight decisions is enough. Keep, cut, fix, front-load, policy, sequence, relationships, yourself. Three answered honestly beats twenty answered in a hurry.
    • Write it to yourself, not to your evaluator. The moment you know somebody else is reading it, you start writing the safe version, and the safe version is useless in August.

    What Is an End of Year Teacher Reflection?

    It is the deliberate review of a full year of teaching, done close enough to the end that you remember it and far enough from the chaos that you can think. It covers what you taught, how you taught it, what your policies actually did as opposed to what they were supposed to do, and which students you reached.

    It is not the same thing as the reflective habit you keep during the year. A running reflection journal captures single lessons while they are fresh. An end of year teacher reflection does something a journal cannot: it looks at the whole arc, where the calendar broke, and which problems were actually the same problem showing up in four different months.

    It is also not your evaluation paperwork, and conflating the two is the most common way this goes wrong. More on that below.

    Does Teacher Reflection Actually Change Anything?

    The evidence says it changes instruction. It does not say it changes student results, because almost nobody has checked. That is an uncomfortable thing to put at the top of an article recommending reflection, but this site does not inflate findings and the gap is real.

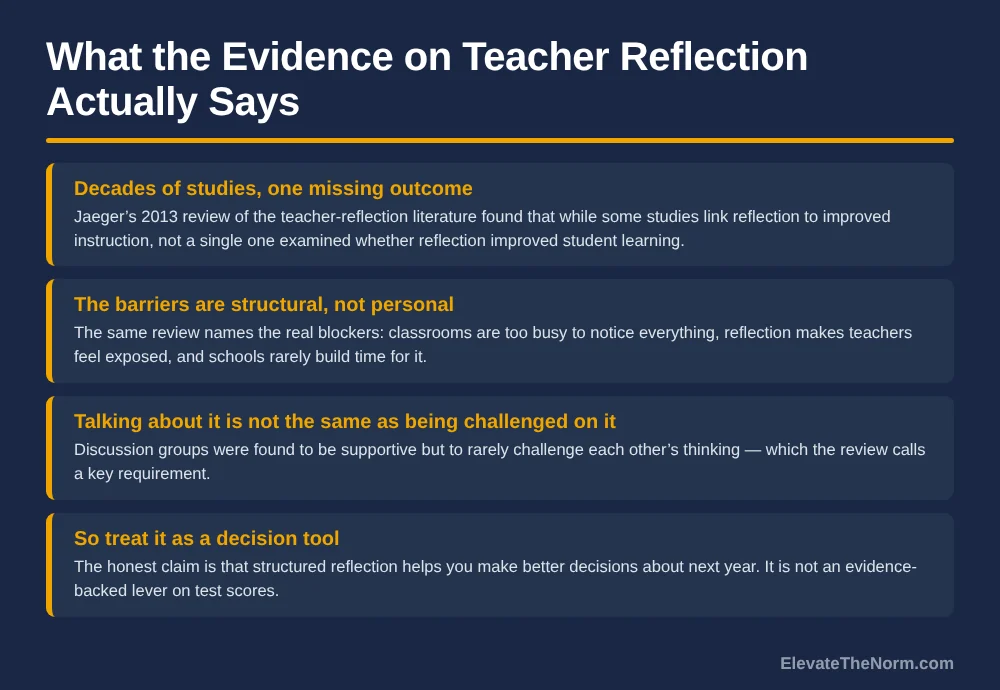
    Four-row graphic on the evidence for teacher reflection: decades of studies that never measured student learning, structural barriers in busy classrooms, discussion groups that rarely challenge thinking, and reflection treated as a decision tool
    The honest read on teacher reflection research.

    Elizabeth Jaeger’s review of the teacher-reflection literature, published in Issues in Teacher Education in 2013, laid out what supports reflection and what blocks it. The supports are the ones you would guess: structured cases, journals, recording and watching your own lesson, coaching conversations. The barriers are structural rather than personal — classrooms are busy enough that teachers can only attend to a fraction of what happens, reflection pushes people into not-knowing and therefore into feeling exposed, and schools rarely build the time for it.

    Then she names the hole. Across decades of research, some studies connect reflection to improved instruction, but she reports that not a single one addressed whether reflection improved student learning. That is a gap in the research rather than evidence that reflection fails. It does mean that anyone quoting you an effect size for teacher reflection is making it up.

    The second honest caveat is about quality. A 2024 mixed-methods study of 100 pre-service teachers in Germany analysed 198 reflective texts and sorted them by depth. Thirty-seven were pure description. One hundred twenty-nine were descriptive reflection. Thirty-one reached dialogic reflection. One text out of 198 reached critical reflection. These were trainees, not experienced teachers, and it was one university’s course, so do not read it as a finding about you. Read it as a warning about the default: left alone, reflective writing turns into a summary of events.

    Jaeger found the same thing in a different form — groups discussing teaching cases were supportive of each other but rarely challenged each other’s thinking, which she calls a key requirement. Being agreed with is pleasant and teaches you nothing.

    So the defensible claim is narrow: a structured end-of-year review helps you make better decisions about next year, and the structure is what keeps it from collapsing into description. That is worth ninety minutes. It is not worth pretending it is an intervention.

    The Eight Decisions Worth Making Before You Clear the Room

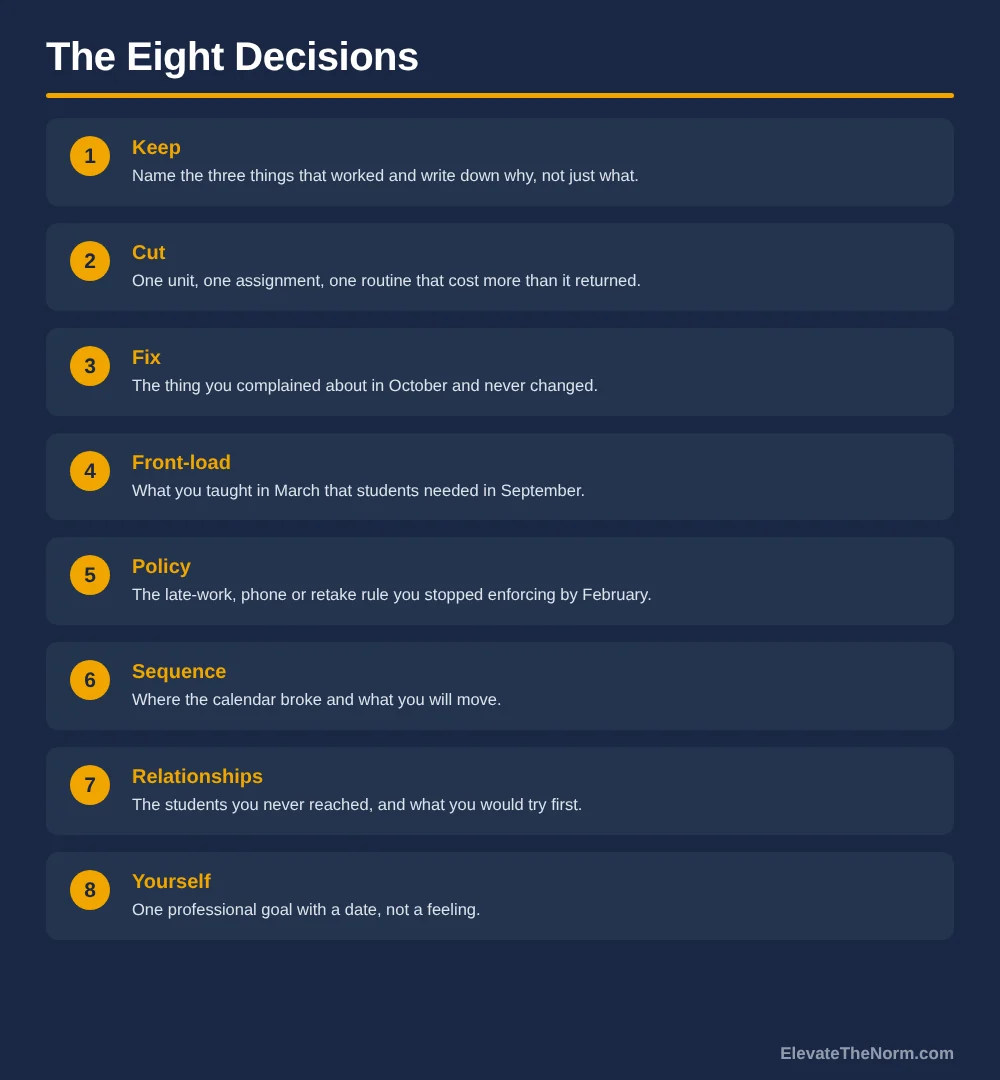
    Every item below has to end in a sentence somebody else could act on. “Group work was rough this year” is not a decision. “Roles get assigned by me for the first two projects and chosen by students after that” is.

    Numbered graphic listing eight end of year teacher reflection decisions: keep, cut, fix, front-load, policy, sequence, relationships and yourself
    Eight decisions, each ending in something written down.

    1. Keep. Name three things that worked and write down why, not just what. “The Socratic seminar went well” is useless in August. “The seminar worked because they had two days to prepare evidence and knew the question in advance” is a design rule you can reuse in a different unit.

    2. Cut. One unit, one assignment, one routine that cost more than it returned. You are not allowed to cut nothing. Teachers accumulate; almost nobody prunes, and a course that only grows is a course that gets shallower every year.

    3. Fix. The thing you complained about in October and never changed. You know what it is. Write the specific change, not the complaint.

    4. Front-load. What did you teach in March that students needed in September? Citation format, how to read a chart, how to disagree with a classmate without it becoming personal. If you taught it late because you assumed they had it, move it.

    5. Policy. Which written rule did you stop enforcing by February? Late work, phones, retakes, bathroom passes. A rule you abandon mid-year is worse than a looser rule you keep, because teenagers correctly conclude the next rule is negotiable too. Either rewrite it so you can hold it or drop it on purpose. One limit worth stating: if the rule is school-wide rather than yours, it is not yours to drop. Take the fact that it is unenforceable in your room to the person who owns the policy, with the specific reason, rather than quietly going your own way — inconsistent enforcement across a hallway is worse for students than either version of the rule. Our walk-through of late-work policies is the long version of this argument.

    6. Sequence. Where did the calendar break? Most years there is one place — a unit that ate three extra weeks, a testing window you forgot, a project that landed in the same fortnight as everyone else’s. Mark it on next year’s calendar now, while you remember the date. While you are there, answer the harder version: what did you not get to, and was it genuinely optional or did you just run out of road? A standard you skipped two years running is a sequencing problem, not an accident.

    7. Relationships. Name the students you never reached. Not to feel bad about it — to write down the first thing you would try differently. Usually it is earlier contact home, or a different seat, or a conversation outside the lesson in the first three weeks rather than the tenth.

    8. Yourself. One professional goal with a date on it, not a feeling. “Be more organised” is a feeling. “Build the first three weeks of routines and procedures on paper before August 1” is a goal.

    What Should You Capture Before You Lose Access to It?

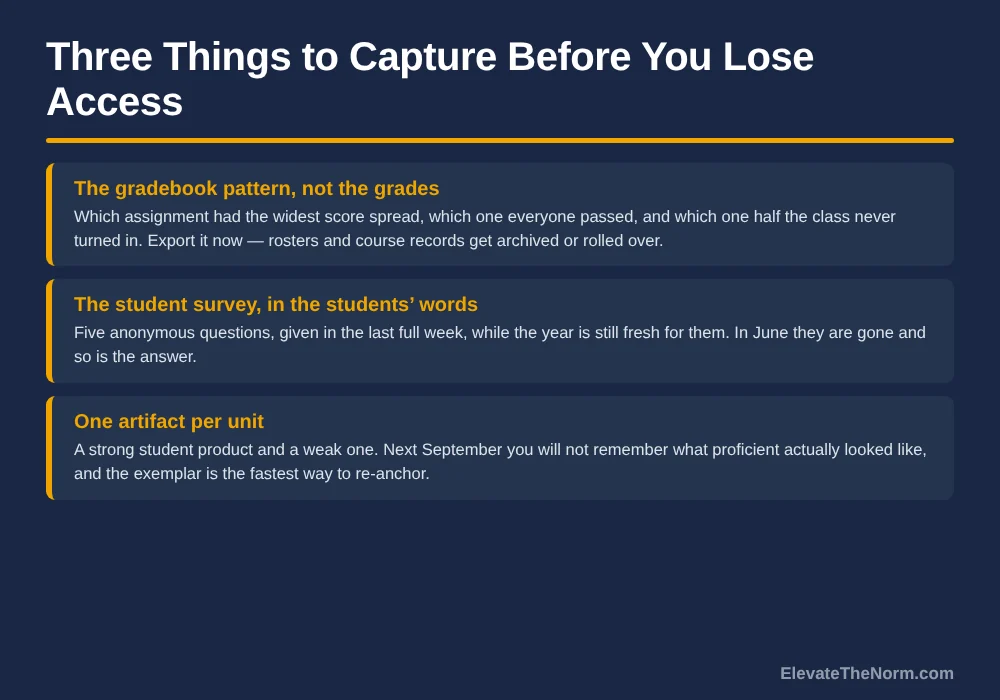
    Three things, and all three disappear when the year closes. This is the part of the process that is genuinely time-sensitive, which is why the gathering belongs in the last two weeks of instruction and the thinking can wait.

    Three-row graphic naming what to capture before access closes: the gradebook score pattern, an anonymous student survey in students own words, and one strong and one weak artifact per unit
    Gather these while the roster is still live.

    The gradebook pattern, not the grades. You do not need every score. You need which assignment had the widest spread, which one everybody passed, and which one half the class never turned in. Those three facts tell you where your instruction was unclear, where your assessment was too easy, and where the task was badly designed or badly timed. Export it while the course is live; in most systems the roster rolls over and getting it back becomes somebody else’s favour. Before you do, check how your district treats student data leaving the gradebook — many require it to stay inside district-managed accounts rather than a personal drive, and some require approval before you survey students at all. Summary patterns with no names attached are the safest form of all three records here.

    The student survey, in their words. Five anonymous questions in the last full week. What should I keep doing? What should I stop? What was the hardest thing and was it hard for a good reason? When did you feel like you actually learned something? What is one thing I did that did not work the way I think it did? The last one gets the best answers and the most uncomfortable ones.

    One artifact per unit — a strong one and a weak one. Next September you will not remember what proficient actually looked like. Anchor papers are the fastest way to recalibrate, and they are also the fastest way to find out your rubric and your actual grading had drifted apart.

    One practical caution on the third item. Under FERPA’s definition at 34 CFR § 99.3, education records are records directly related to a student and maintained by the school, and they come with handling obligations. The regulation carves out records kept in the sole possession of the maker, used only as a personal memory aid, and not shared with anyone else — which is where your own teaching notes sit, and is not where a stack of named student work sits. If you want exemplars, strip the names or ask permission. Check your district’s records policy before anything leaves the building.

    Should You Ask Your Students?

    Yes, and their answers are more consistent than you would expect — but be careful what you claim for them. The Measures of Effective Teaching project, published by the Bill & Melinda Gates Foundation in 2012, found that student perception surveys produced more consistent results than classroom observations or achievement-gain measures, on the reasoning that a survey aggregates the impressions of many people who have spent hundreds of hours with you, where an observation is one person for one period.

    The same report says student survey results were predictive of student achievement gains. It is worth saying plainly that the practice-and-policy summary presents that as a relationship on a chart and does not publish a correlation coefficient, so “predictive” there means a visible slope, not a number you can quote. It is also worth saying that the MET work was about using surveys inside formal teacher evaluation. You are not doing that. You are asking your own students, anonymously, for your own use, which removes most of the stakes that made that debate contentious in the first place.

    Keep it short, keep it anonymous, and do it before the last day, when half the class is already gone and the other half will write whatever ends the period fastest.

    One more thing, and it is the part most teachers skip. Tell them what you did with last year’s answers before you hand them this year’s. Teenagers are not naive about surveys; they have filled in plenty that went nowhere, and they can tell the difference between being asked and being harvested. Naming one concrete change — “last year’s classes said the review guide came out too late, so this year it goes out with the unit” — costs thirty seconds and buys you honest answers instead of polite ones.

    How Long Should an End of Year Teacher Reflection Take?

    About ninety minutes, split across three sittings. One sitting is where this falls apart — you get tired around decision four and the last four turn into one-word answers.

    The honest problem with the first sitting is that the last two weeks of school are already full. Finals, checkout lists, textbook counts, a class that has mentally left. That is exactly why the gathering step is twenty minutes and involves no thinking: a gradebook export is two clicks and a five-question form takes the final ten minutes of one class period. If the week collapses, protect the survey. The gradebook you can usually still pull in June; the students you cannot.

    • Sitting one, twenty minutes, last two weeks of class. Gather only. Export the gradebook summary, run the student survey, pull the artifacts. No analysis.
    • Sitting two, forty minutes, after students leave. Read what you gathered, then write decisions 1 through 5. Longhand or a document, whichever you will actually reopen.
    • Sitting three, thirty minutes, a week later. Decisions 6 through 8, which need distance. Then write the handoff paragraph: what you would tell the person teaching this course next year if you only got one paragraph.

    Put a calendar reminder on the first contract day of next year that links directly to the file. If you skip that step the whole exercise was a diary entry. If you want a structured place to put this, our free reflection template pack has the forms, and the worked reflection examples show what a decision-shaped entry looks like next to a descriptive one.

    Four Ways End of Year Reflection Goes Wrong

    All four are failures of audience or timing, not of effort.

    You write it for your evaluator. The moment you know somebody else reads it, you stop writing “I lost that class in November and never got them back” and start writing “I continued to refine my engagement strategies.” Fill out the district form honestly and separately. Then write the real one.

    You do it in August instead. By August you remember the shape of the year and none of the detail, and the detail is the whole value. You will also be rebuilding the course at the same time, which means you will reflect your way to the decisions you had already made.

    You write a performance review of yourself. Reflection is not the same as grading your own year, and turning it into a verdict on whether you were good makes it harder to look straight at what went badly. If this is landing on a year that has worn you down, the more useful read is on what actually protects teachers across a full year — that is a different problem than a weak unit plan, and it does not get solved by a reflection form.

    You answer twenty questions instead of eight. Longer forms produce shallower answers. The 198-text study is the warning: given room to write, most people describe. Fewer prompts, each demanding a decision, is the design that resists it.

    What to Do Next

    Put three calendar entries in now, even if your year ends in seven months. Twenty minutes in the second-to-last week of instruction labelled “export and survey.” Forty minutes the week after students leave. Thirty minutes a week after that.

    Then add a fourth: first contract day of next year, “read last year’s eight decisions before touching the syllabus.” That last one is the only step that converts the reflection into a changed course. Everything before it is preparation.

    And if the year ahead is only starting — the eight decisions work as a running list from day one. Teachers who keep a short weekly record arrive at the end of the year with the detail already written down, which is the one thing this process cannot manufacture after the fact.

    Frequently Asked Questions

    When should I do my end of year teacher reflection?

    In the last two weeks of instruction, not after the building closes. You want it while classes are still meeting, because two of the most useful inputs — the student survey and your gradebook exports — stop being available the moment the roster rolls over. Do the data-gathering in the last two weeks and the thinking in the first quiet week after.

    How is this different from the reflection form my evaluator asks for?

    The evaluation form is written to be read by somebody else, which quietly changes what you are willing to put on it. Your own reflection is written to be read by you in August. Keep them separate. Fill out the district form honestly, then write the one that actually tells next year’s you what to change.

    Is there research proving teacher reflection improves student outcomes?

    No, and anyone telling you otherwise is overselling it. Elizabeth Jaeger’s review of the teacher-reflection literature found studies linking reflection to improved instruction, but not one that examined whether it improved student learning. That is a gap in the research, not proof reflection fails — but it means you should treat reflection as a decision-making tool rather than an intervention.

    What if I am leaving the school or the profession?

    Do it anyway, and do it sooner. Nationally, 15.1% of teachers moved schools or left teaching between 2020–21 and 2021–22, and nearly three-quarters of those departures were voluntary and not retirements. If you are going somewhere else, the keep-cut-fix list is the part of this job that travels with you, and the person who inherits your course will use the handoff note.

    Can I take student work home over the summer to look at it?

    Check your district’s records policy first. Under FERPA, education records are records directly related to a student and maintained by the school, and they carry handling obligations. The regulation does carve out records kept in the sole possession of the maker, used only as a personal memory aid, and not shared with anyone else. Your own notes about your own teaching sit closer to that line than a stack of graded work with names on it does.

    How many questions should an end of year reflection have?

    Fewer than you think. Eight decisions is plenty, and most teachers would be better served by three answered properly than twenty answered in a hurry. A twenty-question form produces description. Description is the failure mode, not the goal.

    Should I share my reflection with my department or keep it private?

    Share the decisions, keep the raw notes. Your colleagues can use “I am cutting the research paper and replacing it with three shorter writes” immediately. They cannot use four pages of your private second-guessing, and knowing it will be read makes you write a safer, less honest version.

    What do I do with it in August?

    Open it before you touch a syllabus or a seating chart. That is the whole point and it is the step people skip. Put a calendar reminder on the first contract day of next year that links straight to the file. A reflection you do not reread is a diary entry.

    Sources

    1. Jaeger, Elizabeth L. “Teacher Reflection: Supports, Barriers, and Results.” Issues in Teacher Education, vol. 22, no. 1, Spring 2013, pp. 89–104. Literature review of teacher reflection; identifies reflection-generating activities and structural barriers, and reports that while some studies link reflection to improved instruction, none examined whether reflection improved student learning. A review article, not an original study; the “no study measured student learning” finding is a statement about the literature as of 2013. https://files.eric.ed.gov/fulltext/EJ1014037.pdf
    2. Gläser-Zikuda, Michaela, Chaoran Zhang, Florian Hofmann, Lisa Plößl, Lea Pösse, and Michaela Artmann. “Mixed methods research on reflective writing in teacher education.” Frontiers in Psychology, vol. 15, art. 1394641, 2024. 100 pre-service teachers, 198 reflective texts, mean length 230 words; 18.7% descriptive writing, 65.2% descriptive reflection, 15.7% dialogic reflection, 0.5% (one text) critical reflection. Pre-service teachers at a single German university; the authors name the small single-institution sample as a limitation. Do not read it as a finding about experienced teachers. https://pmc.ncbi.nlm.nih.gov/articles/PMC11496957/
    3. Tan, Tiffany S., Wesley Wei, Desiree Carver-Thomas, and Emma García. Teacher Turnover in the United States: Who Moves, Who Leaves, and Why. Learning Policy Institute, March 2026. Between 2020–21 and 2021–22, 15.1% of U.S. teachers moved schools or left the profession — 8.0% moved and 7.1% left; 74% of departures were voluntary and not retirements. https://learningpolicyinstitute.org/product/teacher-turnover-united-states-report
    4. Student Perception Surveys and Their Implementation: Asking Students about Teaching. Measures of Effective Teaching (MET) Project, Bill & Melinda Gates Foundation, 2012. Reports that student surveys produce more consistent results than classroom observations or achievement-gain measures, and that survey results were predictive of achievement gains. The practice-and-policy summary presents the achievement relationship graphically and publishes no correlation coefficient; the report’s context is formal teacher evaluation, not voluntary self-review. https://cepr.harvard.edu/sites/g/files/omnuum9881/files/cepr/files/asking_students_summary_doc_0.pdf
    5. U.S. Code of Federal Regulations. “Education records” definition, 34 CFR § 99.3 (Family Educational Rights and Privacy Act). Defines education records as those directly related to a student and maintained by an educational agency or institution, and excludes records kept in the sole possession of the maker, used only as a personal memory aid, and not accessible to any other person except a temporary substitute. Federal floor only — state law and district records policy may be stricter. https://www.ecfr.gov/current/title-34/subtitle-A/part-99/subpart-A/section-99.3

    About Clay Shumate

    Clay Shumate is a certified secondary Social Studies teacher in the public schools of West Alabama, with seven years of classroom experience, a B.A. in History, and an M.Ed. in Secondary Education. He writes about project-based learning, student responsibility, respect, and practical ways to hold young people to a higher standard while giving them room to learn from mistakes. He is a member of the Society of Professional Journalists and writes to its Code of Ethics; this site’s editorial standards and corrections policy are published in full. More about Clay.

  • Presentation Rubric: How to Grade a Student Presentation Without Grading Confidence

    Presentation Rubric: How to Grade a Student Presentation Without Grading Confidence

    By Clay Shumate

    A presentation rubric is a scoring guide that splits a student presentation into separate criteria and describes what each level of performance looks like on each one. A good one scores the claim, the evidence, the organization, the audience work and the answers to questions. A bad one scores how comfortable the student looked. That difference is the entire article.

    Most presentation rubrics you can download in thirty seconds have a row called “poise” or “confidence” or “enthusiasm.” I understand why — those are what you notice from the back of the room. They are also what you did not teach, cannot coach in a week, and should not be putting in a gradebook.

    Key Takeaways

    • Score five things: the claim, the evidence, the organization, the adaptation to the audience, and the answers to unscripted questions. Weight the claim heaviest.
    • Confidence is not a criterion. Neither is eye contact on its own. Both measure temperament and cultural habit more than anything you taught. Delivery still matters — it belongs inside audience adaptation, where it describes a choice the student made rather than a personality they have.
    • Rubrics improve scoring reliability, but only under conditions. A review of 75 studies found the gains come from rubrics that are analytic and topic-specific and paired with exemplars or rater training — not from having a rubric at all.
    • Visual aids are the least reliable row on any presentation form. In an ETS study, trained raters agreed exactly on visual aids only 40 percent of the time. Score whether the visual carries information, and nothing else.
    • Your own severity drifts across a week of presentations. That has been measured on seventh graders, and it drifted at the individual level, not the group level. Which means it is your problem to control, not the rubric’s.

    What Should a Presentation Rubric Measure?

    It should measure the five things a student can actually get better at: the accuracy of what they claimed, the quality of what they used to support it, whether a listener could follow the order, whether the talk was built for the people in the room, and whether the student could answer a question they did not write.

    Everything else on a typical form is either a proxy for one of those five or it is personality.

    Those five also map onto what most state speaking-and-listening standards ask for at the secondary level: present findings and supporting evidence clearly and logically, organize the information so a listener can follow the line of reasoning, make strategic use of a visual, and adapt speech to the task and audience. Check your own state’s wording before you borrow mine — but if your rubric has a row that matches no standard in your course of study, that row is worth questioning.

    The rubric is only as good as whether you can explain a row to a fifteen-year-old who disagrees with their score, so here is the one-line version of each. Claim: does the presentation say something, and is it right? A tour of a topic is not a claim. Evidence: is each point supported by a source named specifically enough to check? “A study said” is not sourcing. Organization: could a listener follow the sequence with the slides turned off? Audience adaptation: did the student define unfamiliar terms, pace it for listening, and answer the question this room would actually have? Response to questions: the one row that cannot be faked the night before, and the one most rubrics leave off entirely.

    Five-row graphic listing what a presentation rubric should measure: claim and content accuracy, evidence and sourcing, organization, audience adaptation, and response to questions
    Five criteria. The claim carries the most weight.

    On whether rubrics help at all: Anders Jonsson and Gunilla Svingby reviewed 75 studies of scoring rubrics for Educational Research Review and concluded that reliable scoring of performance assessments can be improved by rubrics — especially if those rubrics are analytic, topic-specific, and supported by exemplars or rater training. That qualifier is the useful part. They also found that a rubric does not by itself make the judgement valid. Handing out a form is not the intervention; the design and the training are.

    If you want a professionally built reference point, the National Communication Association’s Competent Speaker Speech Evaluation Form breaks public speaking into eight competencies — among them narrowing the topic for the audience and occasion, providing supporting material, using an organizational pattern, and using physical behaviors that support the verbal message — each scored unsatisfactory, satisfactory or excellent. Notice that even the delivery competencies are written as things the speaker does, not states they are in. One honest caveat: the 1990 development report states plainly that reliability and validity testing was still planned rather than completed, so treat the form as a well-reasoned professional instrument rather than a validated one.

    I am not going to re-argue analytic versus holistic scoring here, because that question already has a home on this site. The Socratic seminar rubric article works through that choice and the mechanics of scoring a room full of students at once, and the answer there applies to presentations too.

    Why Most Presentation Rubrics Grade the Wrong Thing

    Because the categories that are easiest to see from the back of the room — confidence, enthusiasm, eye contact, polish — are the categories least connected to anything you taught.

    Take the oral presentation rubric published by the National Council of Teachers of English through ReadWriteThink — probably the most-printed presentation rubric in American schools. It is a reasonable, free form covering grades 3 through 12 on a 1–4 scale across three categories: Delivery, Content/Organization, and Enthusiasm/Audience Awareness. I am naming it as the common case, not to dunk on it. But Delivery is defined there as eye contact and voice inflection, and Enthusiasm is scored as something a student either has or does not.

    For a third grader learning to speak above a whisper, those categories do real work. For a sixteen-year-old, scoring enthusiasm means putting a number on whether a teenager performed excitement about a topic you assigned. I have never heard anyone defend that score to a parent well.

    Four-row graphic listing what to keep off a presentation rubric: confidence, eye contact as its own line item, slide design polish, and group participation points
    Four categories that look fair on a rubric and are not.

    There is a fairness problem underneath this, and it is not a small one. This next part is my own judgement as a classroom teacher rather than a research finding, and I want it labeled that way. A rubric row for confidence transfers points from students with anxiety to students without it. A row for eye contact scores a cultural norm about looking adults in the face. A row for slide polish scores whose family owns a laptop and which students have had reason to learn design software. None of those rows are measuring the standard. All of them are measuring something a student brought in the door.

    The right move is not to stop caring about delivery. It is to put delivery inside audience adaptation, defined as choices the student made for the listener, which is coachable. “You spoke to the slides for two minutes without looking up, so the room stopped following” is feedback. “You seemed nervous” is an observation about a person.

    The Presentation Rubric

    Here is the full form. Five criteria, four levels, and the claim row weighted double. Copy it, cut a row if you must, and change the point values to fit your gradebook. It is free and there is no form to fill out.

    Criterion4 — Exceeds3 — Meets2 — Approaching1 — Not yet
    Claim and accuracy
    (×2)
    States a clear, specific, defensible claim and sustains it. No factual errors.States a clear claim and mostly sustains it. Minor errors that do not undercut the point.Topic is clear but the claim is vague, or an error undercuts part of the argument.No identifiable claim, or central content is inaccurate.
    Evidence and sourcingEvery significant point is supported. Sources named specifically enough to check. Weighs a counterpoint.Main points supported. Sources named.Some points supported; sourcing vague (“a study,” “online”).Assertions without support, or sources that do not exist as described.
    OrganizationA listener could follow the sequence with the visuals off. Opening frames it; close lands it.Clear beginning, middle and end. Order makes sense.Follows the slide order rather than an argument. Close trails off.No discernible structure.
    Audience adaptationUnfamiliar terms defined, pace set for listening, addresses the question this audience would have. Visual carries information the talk does not.Mostly built for the listener. Visual supports the talk.Delivered at the slides or the notes. Visual duplicates what is being said.Read verbatim; audience not accounted for.
    Response to questionsAnswers directly, distinguishes what they know from what they are inferring, says “I don’t know” where true.Answers the question asked, with reasonable accuracy.Answers adjacent to the question, or repeats a line from the talk.Cannot engage a question about their own material.
    A presentation rubric for grades 6–12. Claim is weighted double; delivery lives inside audience adaptation.

    One more thing worth doing, and it costs a class period’s first ten minutes: hand students the draft and let them argue one row’s descriptors. Not the criteria — those come from the standard and they are not up for a vote — but the wording of what a 3 looks like. Students who have argued over a descriptor stop treating the number as something that happened to them.

    Three notes on using it. Give it out before students plan, not before they present — a rubric handed out the morning of is a grading instrument, not a teaching one. Show them a 4 and a 2; Jonsson and Svingby’s review is explicit that exemplars are part of what makes rubric scoring reliable, and students calibrate off one example faster than off four paragraphs of descriptors. And say out loud that confidence is not on the rubric. The kids who most need to hear it are the ones who would otherwise spend their prep week worrying about the wrong thing.

    What If Your School Already Adopted a Rubric?

    Then use it, and use the rows above as your feedback rather than your grade.

    Plenty of schools have a common presentation rubric attached to a capstone, a portfolio or a graduate profile, and a teacher quietly swapping in their own form breaks the one thing that instrument is for — comparability across classrooms. Score the adopted rubric as written. Then give the student the five rows above in the comment, because that is where the coachable information is. If the adopted form scores confidence, that is a department or district conversation and it is worth having with the evidence in this article in hand. It is not worth having by going rogue on your own section.

    Visual Aids Are the Least Reliable Row You Will Score

    If you and another teacher score the same presentation, the row you are most likely to disagree about is the visual aid.

    An Educational Testing Service study had trained raters score video of oral presentations and reported intraclass correlations for each dimension. Most held up well — word choice at .93, vocal expression at .91, nonverbal behavior at .89, organization at .73. Visual aids came in at an ICC of .78 but only 40 percent exact agreement, the weakest exact-agreement figure on the form. The same study found that when raters worked from transcripts alone, scoring word choice collapsed to an ICC of .27 and persuasion to .39.

    Two caveats before anyone quotes that at a department meeting. The participants were college students and the raters were trained, not a teacher scoring period four. And trained raters disagreeing sets a ceiling, not a floor — your agreement with a colleague is unlikely to be better.

    Three-card research graphic: rubrics improve reliable scoring when analytic and paired with exemplars or rater training, visual aids reached only 40 percent exact agreement in an ETS study, and individual raters drifted more severe or lenient while scoring seventh-grade presentations over four days
    Three findings that change how you write and use a presentation rubric.

    The practical conclusion is to stop asking the visual-aid row to do too much. Do not score design. Ask one question: does the visual carry information the talk does not? A chart the student made from their own data is a 4. A slide of the paragraph they are reading aloud is a 1, no matter how clean the template. That question is answerable and it is the same question whether the student had Canva or a sheet of poster board.

    Your Scoring Drifts, and Somebody Measured It

    Over four days of presentations, individual raters got measurably more severe or more lenient — and the drift was personal, not shared.

    Aslıhan Erman Aslanoğlu and Mehmet Şata looked at exactly this in a secondary setting, which is rare and worth knowing about. Twenty-eight raters scored eight oral presentations by seventh graders across four days, two per day. Using many-facet Rasch measurement, they found that some raters tended toward more severity or more leniency over time, but found no significant rater drift at the group level. The shifts had no common pattern.

    That is a small study and it is one grade level. But the finding matches what every teacher who has graded thirty presentations in two days already suspects, and the group-level result is the interesting half: you cannot correct for drift by assuming everyone drifts the same way. Four things help, and none of them cost money.

    1. Score during the presentation, not after the period. Scores written from memory are scores written against whoever presented most recently.
    2. Keep two anchor examples in front of you — a known 4 and a known 2, from last year or from the exemplars you showed the class.
    3. Randomize the order, and tell students it is random. Volunteers-first means your strongest students set your scale on day one.
    4. Re-score the first two presentations at the end — before you enter anything. If those scores move, your scale moved, and the fix is to re-score the set rather than to split the difference. Do this while the grades are still in your notes; changing a posted grade is a conversation with a family that you do not need to have.

    How to Get Thirty Presentations Through in One Period

    Cap the talk at four minutes, take one question, and finish the rubric in the sixty seconds while the next student sets up.

    Thirty four-minute presentations will not fit in one period, so make the call deliberately: run them across two days, run them in parallel small groups with you rotating, or shorten the format. A four-minute talk with a required claim and two pieces of evidence tests more than a twelve-minute one, because the student has to decide what matters.

    The question row only works if a question gets asked, and in a real room it will not happen on its own. Assign it. Two students per presenter, named in advance, each owing one question that is not “how long did this take you.” If nobody bites, you ask — but then you are the only questioner for thirty presentations, and by the twentieth your questions get thin.

    Do not write comments live. Score the five rows, write one sentence, and move. The sentence should name the single highest-value change: “Your evidence was strong but the claim never got stated as a sentence — write it on a card next time and open with it.” If you try to write paragraphs you will either stop watching or stop scoring, and both are worse than a short comment.

    If the goal is to get more students talking more often rather than to grade a formal performance, a presentation is a heavy tool for the job. A gallery walk puts every student’s work in front of an audience in one period, and most of the quicker moves on the list of formative assessment strategies get you the same information about who understands the material without anyone standing up, and a Socratic seminar gets them accountable for speaking without the stage. Use the rubric above when the presentation itself is the standard being assessed — not as the default whenever you want students to speak.

    Grading Group Presentations Without Hiding the Silent Student

    Score each speaker on their own segment against the same five criteria, then score one shared row for whether the parts added up to a single argument.

    A single group score is how a student who said eleven words gets the same grade as the student who built the thing, and it makes the grade indefensible the moment a parent asks what their kid specifically did. The fix is not peer-rated effort percentages, which mostly measure social standing. It is to require that every member owns a segment, and to score the segment.

    The individual-versus-group grading problem is worked through in more depth in the project based learning rubric, including how to keep collaboration points from covering for weak content. The principle is the same here: teamwork can be a criterion, but it cannot be a criterion that rescues a grade.

    What About the Student Who Cannot Stand Up There?

    Change the size of the audience, not the criteria.

    Some students genuinely cannot present to thirty peers, and a few have a documented plan that says so. Those plans are not optional — follow them and talk to the case manager rather than improvising.

    And do not build an informal workaround for a student you merely suspect is struggling. If a student seems unable to do this, the route is the counselor or the case manager, not a side deal at your desk — a private arrangement that changes how a student is assessed is a modification nobody has reviewed, and it can quietly cost that student the evaluation that would have gotten them real support.

    For everyone else, notice what the five criteria actually require. A claim, evidence, structure, adaptation to an audience, and answering a question. None of that requires a stage. A student can present to you and two classmates at a back table, or record it, or present to a group of four, and still be scored on the identical form. If you take the recording route, check your district’s policy first and keep the file out of shared drives — a video of a minor is not a normal piece of student work, and a parent is entitled to ask where it went. What you must not do is quietly drop the claim row or the questions row because the setting got smaller. That is lowering the standard and calling it an accommodation, and students can tell.

    And the fixed version of the rubric helps here more than any kindness would. When confidence is not scored, the student who shakes through four minutes and nails the claim, the evidence and the questions gets the grade they earned.

    What to Do Next

    Tell families what the rubric does and does not score before the first grade is entered. A one-line note that reads “this presentation is graded on the claim, the evidence, the structure, how it was built for the audience, and the answers to questions — not on confidence or slide design” prevents most of the emails you would otherwise get, and it reaches the parent of the anxious kid before that kid spends a week dreading the wrong thing.

    Take the table above, cut it to the rows you can defend, and hand it out with the assignment rather than the week of. Pull a 4 and a 2 to show the class. Then, the first time you use it, re-score your first two presentations at the end of the set and see whether your scale moved. That one check will tell you more about your grading than the rubric will.

    If you only change one thing today, delete the confidence row.

    Frequently Asked Questions

    What should a presentation rubric include?

    Five criteria, each scored separately: the accuracy and clarity of the student’s claim, the quality and sourcing of their evidence, the organization of the talk, how well it was adapted to the audience in the room, and how the student handled a question they did not script. Weight the claim heaviest, because it is the only row that measures the subject you teach. Everything else on a typical form is either a proxy for one of those five or it is personality.

    Should a presentation rubric grade confidence or eye contact?

    No. Confidence is a trait rather than a skill you taught, and scoring it moves points from students with anxiety to students without it. Eye contact as its own line scores a cultural habit about looking adults in the face. Delivery still matters — put it inside an audience-adaptation row, where it describes a choice the student made for the listener and can therefore be coached. “You spoke to the slides, so the room stopped following” is feedback. “You seemed nervous” is not.

    How do you grade a group presentation fairly?

    Require that every member owns a segment, then score each student on their own segment against the same five criteria, and add one shared row for whether the parts added up to a single argument. A single group score lets the student who said eleven words earn the same grade as the student who built the project, and it is indefensible the first time a parent asks what their child specifically did. Avoid peer-rated effort percentages — they mostly measure social standing.

    How do you score thirty presentations in one class period?

    You do not. Thirty four-minute talks is two hours of speaking before a single question. Make the call deliberately: run presentations across two days, run parallel small groups with you rotating, or shorten the format. Score the rows during the presentation rather than from memory afterwards, write one sentence naming the single highest-value change, and move. Scores written at the end of the period are scores written against whoever presented most recently.

    Do rubrics actually make grading more consistent?

    They help, but not automatically. Jonsson and Svingby’s review of 75 studies found that reliable scoring of performance assessments is improved by rubrics — especially rubrics that are analytic, topic-specific, and paired with exemplars or rater training. They also found that having a rubric does not by itself make the judgement valid. The design and the training are the intervention, not the handout.

    Does my scoring really change over several days of presentations?

    There is evidence that it does. Aslanoğlu and Şata had 28 raters score eight oral presentations by seventh graders across four days and found that individual raters tended to get more severe or more lenient over time — with no significant drift at the group level, meaning the shifts had no shared pattern. Practical defences: keep a known 4 and a known 2 in front of you, randomize the presentation order, and re-score your first two before you enter any grades.

    What if a student has severe anxiety about presenting?

    Change the size of the audience, not the criteria. A claim, evidence, structure, audience adaptation and answering a question do not require a stage — a student can present to you and two classmates, to a group of four, or on video and be scored on the identical form. What you must not do is quietly drop the claim row or the questions row because the setting got smaller; students can tell. If a student has a documented plan, follow it and talk to the case manager rather than improvising a private arrangement nobody has reviewed.

    Is this presentation rubric free to use?

    Yes. Copy it, cut rows, change the point values, put your school’s name on it. There is no email form, no download gate and nothing to buy. Everything on ElevateTheNorm.com is free.

    Sources

    1. Jonsson, A., & Svingby, G. (2007). The Use of Scoring Rubrics: Reliability, Validity and Educational Consequences. Educational Research Review, 2(2), 130–144. A review of 75 studies; reliable scoring is improved by rubrics that are analytic, topic-specific, and complemented with exemplars and/or rater training, and a rubric alone does not ensure a valid judgement. https://eric.ed.gov/?id=EJ796733
    2. Erman Aslanoğlu, A., & Şata, M. (2023). Examining the Rater Drift in the Assessment of Presentation Skills in Secondary School Context. Journal of Measurement and Evaluation in Education and Psychology. 28 raters scored 8 oral presentations by 7th-grade students across four days; individual-level drift toward severity or leniency was found, with no significant drift at the group level. Small sample, one grade level. https://dergipark.org.tr/en/pub/epod/issue/76343/1213969
    3. A Proof-of-Concept Study on Scoring Oral Presentation Videos in Higher Education. (2019). ETS Research Report Series. Trained raters scoring full videos reached ICCs of .73–1.00 across dimensions; visual aids had the weakest exact agreement at 40 percent, and transcript-only scoring dropped word choice to ICC .27. Participants were college students and raters were trained — not a secondary-classroom sample. https://files.eric.ed.gov/fulltext/EJ1238389.pdf
    4. Morreale, S. P., et al. (1990). “The Competent Speaker”: Development of a Communication-Competency Based Speech Evaluation Form and Manual. National Communication Association / ERIC ED325901. Eight competencies, each scored unsatisfactory, satisfactory or excellent. The report states that reliability and validity testing was planned rather than completed at publication, so it is cited here as a professionally developed instrument, not a validated one. https://files.eric.ed.gov/fulltext/ED325901.pdf
    5. National Council of Teachers of English. Oral Presentation Rubric. ReadWriteThink. A free grades 3–12 form scoring Delivery, Content/Organization and Enthusiasm/Audience Awareness on a 1–4 scale. Cited as the widely used common case this article argues with, not as supporting evidence. https://www.readwritethink.org/classroom-resources/printouts/oral-presentation-rubric

    About Clay Shumate

    Clay Shumate is a certified secondary Social Studies teacher in the public schools of West Alabama, with seven years of classroom experience, a B.A. in History, and an M.Ed. in Secondary Education. He writes about project-based learning, student responsibility, respect, and practical ways to hold young people to a higher standard while giving them room to learn from mistakes. He is a member of the Society of Professional Journalists and writes to its Code of Ethics; this site’s editorial standards and corrections policy are published in full. More about Clay.

  • One Pager Assignment: How to Make It Think Instead of Decorate

    One Pager Assignment: How to Make It Think Instead of Decorate

    By Clay Shumate

    A one pager assignment asks a student to put their thinking about a text, a topic or a unit onto a single page, combining writing and drawing. Done well, it is a compact analysis task with a visual element. Done badly, it is a craft project with a quotation glued to it — and the difference is almost entirely in what you require and what you grade.

    The format came out of AVID and has spread well beyond it. The spread is the problem: most of what teachers see online is the finished art, which tells you nothing about whether the student understood anything.

    Key Takeaways

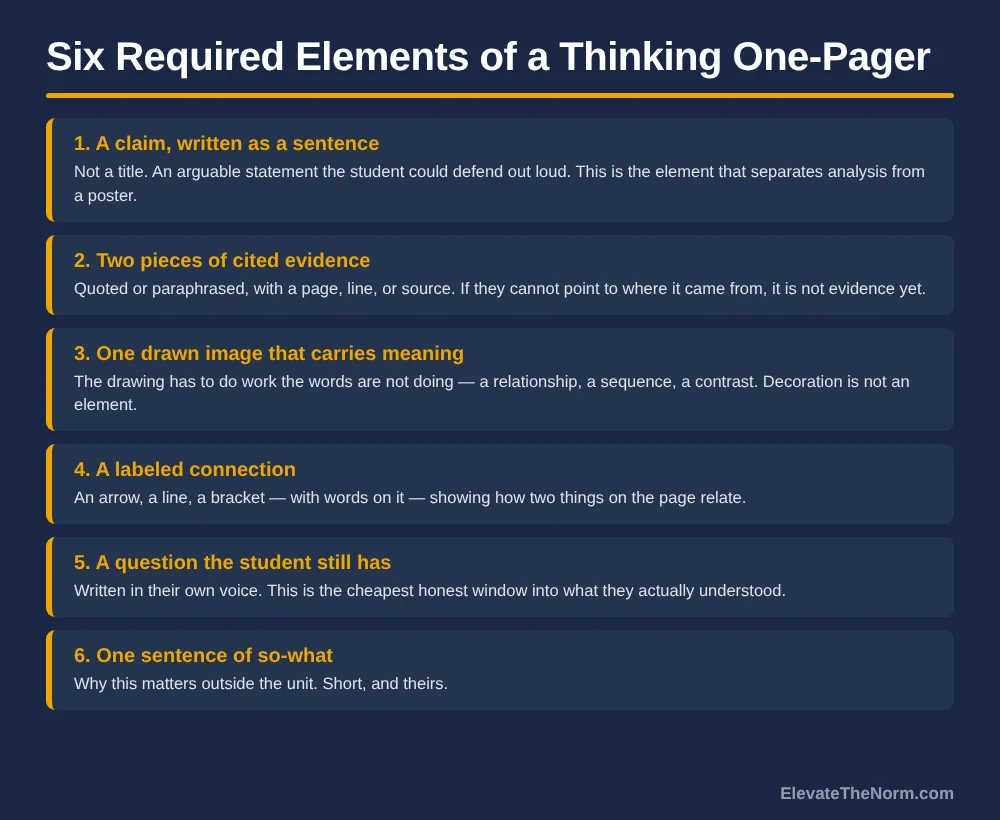
    • Require elements, not an aesthetic. A claim written as a sentence, two cited pieces of evidence, a drawing that carries an idea, a labelled connection, a lingering question, and one line of so-what. If you can hit every requirement and still not have thought, the requirements are wrong.
    • The research supports the ingredients, not the poster. Drawing to learn improved outcomes in 26 of 28 comparisons at a median effect size of 0.40; summarizing in 26 of 30 at a median of 0.50. Both come with a condition: students need to be taught how.
    • Do not justify a one-pager with “visual learners.” The meshing hypothesis has been examined and found wanting. Justify it because drawing and summarizing are generative work — which is a better reason anyway.
    • Grade the thinking. Four criteria: accuracy of the claim, quality of the evidence, whether the image carries an idea, and completeness. Artistic skill appears nowhere.
    • A template is not a crutch. It is the thing that lets the non-artist start, and the research on drawing says explicitly that pretraining and structure improve the effect rather than diluting it.

    What Is a One Pager Assignment?

    It is a single page on which a student represents their understanding of something, in words and images, using a required set of elements. That is the whole definition. The page is the constraint; the elements are the assignment.

    AVID developed the strategy and it is now used well outside AVID classrooms. In practice you will see it most in English and social studies — after a novel, a chapter, a documentary, a unit — but nothing about the format is subject-specific. A one-pager works anywhere a student needs to compress something large into something defensible.

    What it is not is a poster. A poster communicates to an audience. A one-pager is evidence of thinking, submitted to you. Those two things want different rules, and most of the trouble with one-pagers starts when a teacher writes poster rules and grades them as analysis.

    Three-row research graphic: drawing to learn supported with 26 of 28 comparisons positive and median effect size 0.40, summarizing supported with 26 of 30 positive and median 0.50 but requiring training, and visual learners not supported
    Two of the three claims people make about one-pagers hold up. The third does not.

    Does the Research Support One-Pagers?

    Not directly — there is no body of research on “one-pagers” as such. What there is, and it is good, is evidence on the two things a one-pager makes students do: draw and summarize.

    Fiorella and Mayer’s 2015 review in Educational Psychology Review is the best single place to see it. They assessed eight generative learning strategies against the experimental record. Drawing produced positive effects in 26 of 28 comparisons, with a median effect size of d = 0.40, across elementary, high school and college students — one of their strongest examples was ninth graders working on chemistry comprehension. Summarizing produced positive effects in 26 of 30 comparisons, median d = 0.50.

    So far, so encouraging. Here is the part that changes how you run the assignment. For drawing, the authors are explicit that the effect improves when students receive explicit pretraining in how to draw, detailed guidance about which elements to include, partial illustrations to work from, or a chance to compare their drawing with the author’s. The thing they warn against is “extraneous cognitive load caused by the mechanics of drawing” — a student spending their working memory on composition is not spending it on the content. For summarizing, the training studies they review gave middle schoolers roughly six hours of instruction over five weeks before the summaries got good.

    Read that honestly and it says something uncomfortable: handing out a blank page and saying “be creative” is the version of this assignment the research does not support.

    There is a second line of evidence worth knowing. Fernandes, Wammes and Meade’s 2018 review in Current Directions in Psychological Science describes a reliable “drawing effect” on memory — drawing a word at encoding beats writing it, repeatedly, and the benefit holds for older adults and even appeared in a small group of patients with dementia. Two details matter for a classroom. The benefit arrived with as little as four seconds of drawing per item, and it applies “regardless of one’s artistic talent.” The caveat is the population: these were adults in memory experiments with word lists, not teenagers writing about a novel. It tells you the mechanism is real. It does not tell you the size of the effect on a literary analysis.

    What About “Visual Learners”?

    Leave it out of your rationale. It is the most common justification given for one-pagers and it is the weakest one available.

    Pashler, McDaniel, Rohrer and Bjork examined the evidence for the meshing hypothesis — the idea that matching instruction to a student’s preferred style improves learning — in Psychological Science in the Public Interest in 2008. Their finding was blunt: they found “virtually no evidence for the interaction pattern” that would be required to validate the educational application, and concluded that “there is no adequate evidence base to justify incorporating learning-styles assessments into general educational practice.”

    This is not a reason to stop assigning one-pagers. It is a reason to describe them accurately to students, to parents and to an administrator who asks. The honest sentence is: drawing and summarizing are generative activities with a decent evidence base, so I am asking every student to do both. That is stronger ground than a learning style, and it does not sort children into categories the research does not support.

    Six-row graphic listing required elements of a one pager assignment: a claim written as a sentence, two pieces of cited evidence, one drawn image that carries meaning, a labeled connection, a question the student still has, and one sentence of so-what
    Six required elements. Every one of them is thinking, not decoration.

    What Should a One-Pager Actually Require?

    Six elements, each of which is a thinking move rather than a design choice. The test for any element you add: could a student satisfy it without understanding the material? If yes, cut it.

    A claim, written as a sentence. Not a title, not a theme word. An arguable statement the student could defend out loud. This single requirement does more work than the other five combined, because it is the one that cannot be faked with a border.

    Two pieces of cited evidence. Quoted or paraphrased, with a page number, a line, or a source. “Cited” is doing real work here — if a student cannot point to where it came from, it is not evidence yet.

    One drawn image that carries meaning. The drawing has to do something the words are not doing: show a relationship, a sequence, a contrast, a scale. A decorative border is not an element. A badly drawn diagram that makes a comparison visible is.

    A labelled connection. An arrow, a line or a bracket with words on it, showing how two things on the page relate. This is the cheapest way to force synthesis, and it is the element students most often skip.

    A question the student still has. In their own voice. It is the most honest window you will get into what they actually understood, and it costs them thirty seconds. If you want a wider version of this, it is the same instinct behind asking a student to judge their own work before you do.

    One sentence of so-what. Why this matters outside the unit. Short, and theirs. Most students will write something flat the first time. They get better at it the fourth time, which is an argument for assigning one-pagers more than once a year.

    Numbered four-criteria grading graphic for a one pager assignment: accuracy of the claim, quality of the evidence, whether the image carries an idea, and completeness and legibility rather than neatness
    Four criteria, none of which is artistic skill.

    How Do You Grade a One-Pager Without Grading Art?

    Put artistic skill nowhere on the rubric, and tell students that before they start. Four criteria will carry it.

    Accuracy of the claim is the heaviest weight. Is it defensible against the text or the evidence? This has nothing to do with how the page looks. Quality of the evidence comes second: cited, relevant, and actually supporting the claim rather than being the first quotation the student found. Does the image think? — scored on whether the drawing carries an idea, never on execution. A labelled stick figure can score full marks and should. Completeness and legibility is the last and the smallest: all six elements present, and a reader can follow it. Legibility is not neatness. A page can be messy and perfectly readable.

    Two things to resist. Do not add a “creativity” or “visual appeal” category — it is unscoreable, it rewards students who already had art supplies at home, and it is the single fastest way to turn this into an equity problem. And do not give points for colour. If you want the general version of this argument, the same reasoning applies to any rubric where presentation can hide thin understanding.

    Three practical conditions follow from that. The assignment has to be completable with a pencil — if markers are required, you have built a supply test, so keep whatever you have in a tub on the counter and do the work in class rather than at home. Score the “question you still have” element present-or-absent, never on quality, or students will stop telling you the truth in the one place they were being honest. And tell families the rubric excludes artistic skill before the first grade goes in the book, because a parent looking at a drawing with a C on it will reasonably assume you graded the drawing.

    Alternatives need to be available without a formal plan: typed and printed elements pasted down, cut images instead of drawn ones, or the whole thing explained to you verbally while you score the same four criteria. A student with a fine-motor difficulty, a visual impairment, or a hand in a cast should not have to disclose anything to get a different route.

    On grading time — this is the objection every teacher with 150 students will have, and it is correct. Score in one pass, in bands rather than points, and write a comment only on the claim. If the claim is wrong, nothing downstream of it is worth your ink. Four criteria scored 1–4 with one sentence on the first of them runs about ninety seconds a page.

    One more move that costs four minutes and is worth more than the rubric. Walk the room while they work and ask three or four students to defend the claim on their page out loud — not to justify the picture, just the sentence. I do a version of this constantly: circulating, pulling a student aside, and making them explain the decision they made rather than telling them whether it was right. You find the gap between a page that looks finished and a page that is understood in about twenty seconds, and you find it while there is still time to fix it. That is the same thing any good in-the-moment check is for.

    What About the Student Who Says They Cannot Draw?

    Give them a template and say the sentence out loud: nobody is being graded on drawing. Then mean it, because teenagers will test whether you meant it.

    Betsy Potash, writing at Cult of Pedagogy, identifies the problem exactly: the one-pagers that circulate online are made by artistic students, and everybody else concludes the assignment is not for them. Her fix is a template — a page with designated spaces for each required element — which she describes as a creative constraint that paradoxically frees students up, because the paralysis is usually about placement rather than content. Students who want a blank page can flip the template over and use the back.

    That is a practitioner’s recommendation rather than a research finding, and it should be read as one. But it points the same direction the research does: Fiorella and Mayer found that structure, partial illustrations and guidance about which elements to include increase the benefit of drawing rather than watering it down. The template is not a concession. It is the scaffold the evidence asks for.

    Where One-Pagers Go Wrong

    Four failure modes, and three of them are the teacher’s.

    The first is the blank page with no requirements, which produces decoration from the artists and panic from everyone else. The second is grading the aesthetic, which teaches students that the assignment was about markers all along. The third is assigning it once, at the end of a unit, as a summative grade — the first one a student makes is always the worst one, and the research on summarizing says the skill takes weeks of instruction to develop. Run the first as practice. The fourth is the student version: filling every element with something technically present and entirely hollow. The claim sentence catches most of this, and the four-minute verbal check catches the rest.

    How Do You Launch It the First Time?

    Spend twenty minutes before anyone touches a page. This is the pretraining the drawing research keeps pointing at, and skipping it is why most first attempts disappoint.

    Show two finished examples — one strong, one weak — and have the class score both against your four criteria before they know which is which. Make the weak one visually attractive and analytically thin, because that is the trap. Then model the hardest element: write a claim sentence in front of them, out loud, and revise it once. Then let them start, with the template on the desk and the requirements on the board.

    If you want the pages to do a second job, hang them and run a structured walk around the room where students read each other’s claims and leave one question each. The reading is worth more than the display, and it makes the “question you still have” element feel like it has a purpose beyond the gradebook. Make the display opt-out without explanation — some students are genuinely uncomfortable having a drawing on the wall, and nothing about the learning requires it to be public.

    Afterwards, do not just file them. Read the question column across the whole class in one sitting; it is the cheapest reteach list you will ever assemble, and it was generated by students who thought nobody was grading it.

    What to Do Next

    Take whatever you were going to assign as a written response this month and convert it — same content, six required elements, four grading criteria, a template on every desk, and twenty minutes of launch before the first page gets made. Run it as practice rather than as a test grade.

    Then do it again inside the same semester. Almost everything useful about one-pagers shows up on the second and third attempt, once students have stopped worrying about the layout and started arguing on paper. If you need the in-between measurement, a two-minute check sorted by where it falls in a lesson will tell you more, sooner, than waiting for the pages to come in.

    Frequently Asked Questions

    What is a one pager assignment?

    A single page on which a student represents their understanding of a text, topic or unit using both words and images, against a required set of elements. The strategy came out of AVID and is now used well beyond it, most commonly in English and social studies. The page is the constraint; the required elements are the actual assignment. It is not a poster — a poster communicates to an audience, while a one-pager is evidence of thinking submitted to a teacher, and the two want different rules.

    Is there research showing one-pagers work?

    Not on one-pagers as a named format. There is good evidence on the two things a one-pager makes students do. In Fiorella and Mayer’s review of generative learning strategies, drawing produced positive effects in 26 of 28 comparisons at a median effect size of d = 0.40, and summarizing in 26 of 30 at a median of d = 0.50, across elementary, high school and college students. Both come with the same condition: the effect improves when students are explicitly taught how, and the summarizing training studies gave middle schoolers roughly six hours of instruction over five weeks.

    Should I say one-pagers are good for visual learners?

    No. Pashler, McDaniel, Rohrer and Bjork examined the meshing hypothesis — that matching instruction to a preferred style improves learning — and found “virtually no evidence” for the interaction pattern it requires, concluding there is “no adequate evidence base” for using learning-styles assessments in general practice. Use the better justification instead: drawing and summarizing are generative activities with real support, so every student does both. That reasoning survives a conversation with an administrator, and it does not sort students into categories the evidence does not back.

    How do I grade a one-pager fairly?

    On four criteria, none of which is artistic skill: accuracy of the claim, quality of the cited evidence, whether the drawn image carries an idea rather than decorates, and completeness and legibility. Weight the claim heaviest. Do not add a creativity or visual-appeal category — it is unscoreable and it rewards students who own art supplies. Tell families the rubric excludes drawing before the first grade is entered, because a parent seeing a low mark on a page with a picture on it will assume you graded the picture.

    What do I do about students who say they cannot draw?

    Give them a template with a designated space for each element and say out loud that nobody is graded on drawing — then hold to it, because they will test whether you meant it. A labelled stick figure that makes a comparison visible should score full marks. Alternatives need to be available without a formal plan: typed elements pasted down, cut images rather than drawn ones, or explaining the page to you verbally while you score the same four criteria.

    Does a template make the assignment too restrictive?

    The evidence points the other way. Fiorella and Mayer found that structure, partial illustrations and guidance about which elements to include increase the benefit of drawing rather than diluting it, and the risk they name is extraneous cognitive load from the mechanics of drawing — which is exactly what a blank page creates. The template removes the paralysis about placement so the student can spend their attention on the content. Students who want the open page can use the back of it.

    Should a one-pager be a test grade?

    Not the first one. The first attempt is always the worst attempt, and the research on summarizing says the skill takes weeks of instruction to develop, so a summative grade on a first try is measuring unfamiliarity with the format. Run the first as practice, assign a second inside the same semester, and grade that one. Almost everything useful about one-pagers appears on the second and third attempt, once students have stopped worrying about layout and started arguing on paper.

    Does handwriting the page help more than typing it?

    There is no good evidence for that, and it is worth knowing because the claim gets repeated a lot. Urry and colleagues ran a direct replication of the well-known longhand-versus-laptop study with 142 undergraduates and found a negligible effect in the opposite direction on conceptual questions, and a mini meta-analysis across eight studies found no significant difference in quiz performance. Assign a one-pager because drawing and summarizing are generative, not because the student held a pen.

    Sources

    1. Fiorella, Logan, and Richard E. Mayer. “Eight Ways to Promote Generative Learning.” Educational Psychology Review, vol. 27, 2015, pp. 1–47. Drawing: positive effects in 26 of 28 comparisons, median d = 0.40, across elementary, high school and college students; effect increases with explicit pretraining in how to draw, guidance on elements, partial illustrations or comparison with author-provided drawings, and the stated risk is extraneous cognitive load from the mechanics of drawing. Summarizing: 26 of 30 comparisons positive, median d = 0.50; middle-school training studies required roughly six hours of instruction over five weeks. https://doi.org/10.1007/s10648-015-9348-9
    2. Fernandes, Myra A., Jeffrey D. Wammes, and Melissa E. Meade. “The Surprisingly Powerful Influence of Drawing on Memory.” Current Directions in Psychological Science, vol. 27, no. 5, 2018, pp. 302–308. Reports a reliable recall advantage for drawn over written words, benefits arriving with as little as four seconds of drawing per item, and the authors’ statement that the benefit applies “regardless of one’s artistic talent.” Populations are younger adults, older adults and a group of 13 patients in long-term care — not secondary students, and the materials are word lists rather than academic content. Cited for mechanism, not for an effect size on classroom work. https://doi.org/10.1177/0963721418755385
    3. Pashler, Harold, Mark McDaniel, Doug Rohrer, and Robert Bjork. “Learning Styles: Concepts and Evidence.” Psychological Science in the Public Interest, vol. 9, no. 3, 2008, pp. 105–119. The authors found “virtually no evidence for the interaction pattern” required to validate learning-styles instruction and concluded “there is no adequate evidence base to justify incorporating learning-styles assessments into general educational practice.” https://doi.org/10.1111/j.1539-6053.2009.01038.x
    4. Urry, Heather L., et al. “Don’t Ditch the Laptop Just Yet: A Direct Replication of Mueller and Oppenheimer’s (2014) Study 1 Plus Mini Meta-Analyses Across Similar Studies.” Psychological Science, vol. 32, no. 10, 2021, pp. 1479–1492. Direct replication, N = 142 undergraduates. Conceptual-question performance showed a negligible effect in the opposite direction to the original (Hedges’s g = −0.13, 95% CI [−0.45, 0.20]), significantly different from the original result. A mini meta-analysis of eight studies found g = 0.04, 95% CI [−0.13, 0.20], not significant. The authors conclude results “do not support the idea that longhand note taking improves immediate learning via better encoding of information.” Cited as contrary evidence: do not justify handwritten work on the grounds that writing by hand beats typing. https://doi.org/10.1177/0956797620965541
    5. Potash, Betsy. “A Simple Trick for Success with One-Pagers.” Cult of Pedagogy, 26 May 2019 (updated 2026). Credits AVID with developing the strategy; describes the template as a creative constraint that helps non-artistic students start, and recommends simple rubric categories such as textual analysis, required elements and thoroughness. Cited as practitioner recommendation, not as research evidence. https://www.cultofpedagogy.com/one-pagers/

    About Clay Shumate

    Clay Shumate is a certified secondary Social Studies teacher in the public schools of West Alabama, with seven years of classroom experience, a B.A. in History, and an M.Ed. in Secondary Education. He writes about project-based learning, student responsibility, respect, and practical ways to hold young people to a higher standard while giving them room to learn from mistakes. He is a member of the Society of Professional Journalists and writes to its Code of Ethics; this site’s editorial standards and corrections policy are published in full. More about Clay.

  • Free Teacher Printables for Grades 6-12: What Is Worth Printing, and How to Tell

    Free Teacher Printables for Grades 6-12: What Is Worth Printing, and How to Tell

    By Clay Shumate

    Free teacher printables are classroom-ready documents — primary source sets, data tables, reading guides, rubrics, trackers — that you can download and print without paying. For grades 6–12 the best ones come from federal agencies, museums, archives, universities and public media rather than worksheet mills. The hard part is not finding them. The hard part is telling which ones are worth the paper.

    Most search traffic for free printables lands in elementary territory: coloring pages, letter tracing, bulletin board sets. This article stays in middle and high school, where the useful material looks completely different. A good secondary printable is usually a document, a data set, a structured protocol or a rubric — not a fill-in-the-blank page. Below are the quality criteria first, then the places that actually have the goods, with links I opened in October 2026.

    Key Takeaways

    • Judge the task, not the design. A clean-looking page that asks students to copy definitions is worse than an ugly page that asks them to explain something.
    • Federal material is usually public domain. U.S. copyright law states that copyright protection is not available for any work of the U.S. Government, which is why National Archives and Library of Congress material is so adaptable.
    • Free is not the same as unrestricted. Marketplace downloads typically carry single-classroom licenses and explicit bans on reposting, even when the file cost nothing.
    • Worksheets have one strong, narrow use. Retrieval practice and spaced review are the two study techniques rated high utility in the major cognitive-psychology review. Most other worksheet uses are not supported.
    • Check the reading level before you print thirty copies. A primary source at a grade 14 reading level is an accessibility decision, not a rigor decision.
    • Everything on this site is free and ungated. All 53 printables in our library download directly, with no email, account or sign-up.

    What are free teacher printables, really?

    They are any document you can print and put in front of students without paying for it, which covers an enormous range of quality. That range is the whole problem. The phrase lumps together a declassified cable from the National Archives and a crossword of vocabulary words, and search engines cannot tell them apart.

    For grades 6–12, useful printables tend to fall into five types. Primary and secondary source documents. Data sets, tables and charts students have to interpret. Structured protocols — discussion formats, peer review sheets, lab procedures, project planners. Rubrics and checklists. And practice sets, where the point is repeated retrieval rather than discovery.

    Notice what is missing from that list: anything whose main function is to occupy time. That is not a moral judgment about busywork, it is a practical one. Paper that occupies time without producing evidence of thinking gives you nothing to grade honestly and gives students nothing to be proud of.

    What is a worksheet actually good for?

    A worksheet has one strong use: structured, repeated retrieval of things students need fast and automatic. Vocabulary, formulas, dates, conjugations, equation forms, map features. That use is well supported and worth defending.

    The large review by Dunlosky, Rawson, Marsh, Nathan and Willingham rated ten common learning techniques for utility. Only two earned a high rating: practice testing and distributed practice. They write that these “received high utility assessments because they benefit learners of different ages and abilities.” Rereading and highlighting were both rated low utility — highlighting, which students lean on heavily, “does not consistently boost students’ performance.” Summarization and keyword mnemonics also came in low, and elaborative interrogation and self-explanation came in moderate, partly because they “have not been adequately evaluated in educational contexts” (Dunlosky et al., Psychological Science in the Public Interest, 14(1), 4–58, 2013).

    That review covers a wide age range and a lot of laboratory work, not only secondary classrooms, so take it as a guide to which direction the evidence points rather than a prescription. But the direction is clear. A printable that functions as a short retrieval quiz, returned to a week later, is doing something the research supports. A printable that asks students to find and highlight the definitions is doing something the research rates poorly.

    So: use worksheets for retrieval and spacing. Do not use them to introduce concepts, to substitute for reading, or to fill a Friday. That is the narrow good use, stated plainly.

    Five of the seven screening questions for evaluating a free classroom printable before copying it
    Two minutes of screening rejects most of what a search turns up.

    Seven questions to ask before you print

    Run any candidate printable through these seven questions. It takes about two minutes and will reject most of what you find.

    1. Does it match what I am actually teaching? Not the topic — the specific skill or standard in this unit. Topical overlap is not alignment.
    2. Does it ask students to think, or to transcribe? Read the directions on the student page. If the verb is “list,” “match,” or “copy,” ask what the thinking is.
    3. What is the reading level, and who gets left out? Paste a paragraph into a readability tool. Then decide whether you are scaffolding the text or just hoping.
    4. Is the source credible and named? An anonymous PDF with no author, date or institution is a guess. Historical and scientific content from an unnamed source is a particular risk.
    5. Is it accurate? Spot-check two factual claims. Free content is not peer reviewed, and errors in dates, units and attributions are common.
    6. What does the license allow? Can you adapt it, copy it for all your sections, share it with a colleague, post it to your LMS? These are four different permissions.
    7. Does it produce something I can look at? If finished student work would not tell you anything you did not already know, skip it.

    Question three deserves one more sentence. A document written for adults in 1863 is not automatically rigorous for a ninth grader; it is simply hard. Either you excerpt it, gloss it, chunk it, and build a scaffold, or you are handing out an obstacle. Checking whether the text landed matters more than the text’s prestige.

    What may I legally adapt, copy and share?

    Three separate things govern a free file: copyright, the license, and your district’s policy. Free to download tells you nothing about any of them.

    The most permissive category is federal government work. Section 105 of U.S. copyright law states that “Copyright protection under this title is not available for any work of the United States Government,” while noting the government may hold copyrights transferred to it (17 U.S.C. § 105). In practice that is why you can crop, excerpt, retype and remix a National Archives document or a federal data table freely. Two cautions: material a federal site hosts may still be owned by someone else, and some agency logos and seals carry separate restrictions.

    Openly licensed material is the next tier. OER Commons, which has been curating open materials since 2007, labels resources so you can tell adaptation rights at a glance — the site states that “each resource has one of four conditions of use labels” that “help you quickly distinguish whether a resource can be changed or shared without further permission required” (OER Commons). Read the label. Share-alike and non-commercial conditions are real conditions.

    Then there are free files with restrictive licenses, which is most of a teacher marketplace. A free download from Teachers Pay Teachers typically comes with a single-classroom license and explicit instructions not to repost. Browsing the free section, you will find terms like “PLEASE DO NOT POST THIS PRODUCT ANYWHERE. Not on your classroom website, not online for your friends, nowhere” and resources marked “for personal use only” (TPT free resources). Those terms are not unreasonable, but they mean a free file can still be one you may not put in a shared department drive.

    Federal sources, and why they are the best starting point

    Start with the National Archives and the Library of Congress. These are the two highest-value free sources for secondary social studies, English and anything document-based, and both are built by people who understand classrooms.

    DocsTeach, run with support from the National Archives Foundation, offers “thousands of primary sources — letters, photographs, speeches, posters, maps, videos, and other document types — spanning the course of American history.” When I checked in October 2026 the site listed 13,639 primary source documents and 294 activities available without registering, and states plainly: “It’s completely free!” A free account adds more teacher-built activities and lets you build and save your own (DocsTeach).

    The Library of Congress publishes classroom materials “Created by teachers for teachers” — primary source sets organized by topic, many with teacher’s guides, covering the Civil War, the American Revolution, the civil rights movement and dozens more (Library of Congress classroom materials).

    For economics and personal finance, the Federal Reserve’s education site describes itself as “A FREE platform with economics and personal finance resources for classrooms and communities,” with middle school, high school and college levels, and lessons, readings, modules and infographic posters. Browsing is open; saving resources and getting answer keys requires a free teacher account (Federal Reserve Education).

    Museums, libraries and archives

    The Smithsonian Learning Lab is the strongest single museum source for grades 6–12. It describes itself as “Free to discover,” holding “millions of Smithsonian digital images, recordings, texts, and videos in history, art and culture, and the sciences” plus “thousands of examples of resources organized and structured for teaching and learning,” with collections filterable by grade band (Smithsonian Learning Lab). Browsing is open; saving and assigning requires an account.

    Your state archive and your state historical society are underused. Nearly every state has digitized local newspapers, maps, census records and photographs, and local documents are frequently more interesting to teenagers than national ones. Your county or city public library system often has free database access with a library card, which is a genuinely free resource most teachers never mention to students.

    Four categories of free classroom material sources for middle and high school teachers
    Institutions beat worksheet mills, especially above grade six.

    Public media, associations and universities

    Public media is reliable but usually gated behind a free account. PBS LearningMedia offers videos, interactives and lesson plans and is free, stating plainly “Register Now It’s free!” — which does mean an account (PBS LearningMedia). That is a reasonable trade, but it is a gate and I am not going to pretend otherwise.

    Subject-matter professional associations are the most reliable source of standards-aligned secondary material, because they write the standards. The national councils and associations for English, mathematics, science, social studies and world languages all publish free classroom material alongside their member-only content. Check what is open before paying for membership for that reason alone.

    University centers publish free curriculum too, and the quality is usually high because it is tied to research programs. These sources often require a free account, and the material is frequently narrow — one skill, done thoroughly. That is a feature.

    A warning about link rot from this same category. When I verified sources for this article in October 2026, the deep links for the National Endowment for the Humanities’ EDSITEment lesson plans — recommended in teacher materials for over two decades — redirected to a single NEH project page rather than the lesson library. Any list of free resources older than about a year will contain dead ends. Open the link before you plan around it.

    Teacher marketplaces and their free tiers

    Marketplaces have enormous free sections and wildly variable quality, and the filter has to be yours. Teachers Pay Teachers lists hundreds of thousands of free resources across all grades and subjects, and an account is required to download them.

    Two honest cautions. First, marketplace material is not reviewed for accuracy or alignment by anyone except the buyer, so questions four and five in the checklist above matter most here. Second, the volume skews heavily elementary, so grade 6–12 searching takes patience and tight filters. When it works, it works well for exactly one thing: a structure someone else already built that you would otherwise spend an evening making.

    Our own free teacher printables, and what we charge for

    Every printable on this site is free and downloads directly — no email, no account, no sign-up. As of October 2026 the resource library holds 53 free printable PDFs, organized into classroom management, assessment and grading, instruction and discussion, families and conferences, integrity and responsibility, and teacher wellbeing and reflection.

    Concretely, that includes seating chart planners, transition cues, formative assessment checks, standards-based grading templates, Socratic seminar protocols, project planners, bell ringers, parent communication logs, student-led conference templates, academic integrity materials and reflection journals. All grades 6–12. All ungated.

    We also sell some packaged versions of this material on Teachers Pay Teachers. Those are paid. Stating that plainly is the point: nothing that is free here will ever move behind a purchase, and if you only ever use the free files, that is the intended outcome, not a loss.

    Five common ways free printables fail with middle and high school students
    Secondary students will do hard work with a visible purpose and resist easy work without one.

    Where free printables go wrong in middle and high school

    The failure mode is almost always age mismatch dressed up as differentiation. A few patterns to watch for.

    • Elementary material relabeled. Clip art, large fonts, one-word answers. Teenagers read this instantly as being talked down to, and they are right.
    • Volume substituted for difficulty. Forty problems at the same level is not more rigorous than eight at increasing levels. It is longer.
    • The reading level nobody checked. An unexcerpted primary source handed out cold, with no glossary and no chunking.
    • Answers in the directions. Graphic organizers so prescriptive that filling them in requires no decisions.
    • No visible purpose. If a student asks why they are doing this and the honest answer is “to have something to turn in,” do not print it.

    That last one is the test I would apply above all others. Secondary students will do difficult work if the purpose is legible to them, and they will resist easy work whose purpose is not. Treating them as developing young adults means the paper has to be able to justify itself, which is also the argument for giving them real choices inside an assignment rather than more pages of it.

    A quick comparison of source types

    Source typeTypical qualityAccount needed?Adaptation rightsBest for
    Federal agencies and archivesHigh; curated by educatorsUsually no for browsingBroadest — federal works are not copyrightable under § 105Primary sources, data sets, document-based tasks
    Museums and librariesHighBrowsing open; saving usually requires oneVaries by item; check eachImages, objects, curated collections by grade band
    Public mediaHighUsually yes, freeClassroom use; redistribution restrictedVideo-anchored lessons, interactives
    Professional associationsHigh, standards-alignedMixed; some member-onlyVaries; frequently classroom-use onlyStandards alignment, assessment design
    Open education collectionsVariable but labeledUsually noExplicitly labeled; often adaptableFull units, textbooks, remixable material
    Teacher marketplacesVery variableYes, to downloadUsually single classroom, no repostingReady-made structures and templates

    Free teacher printables: a short plan for this week

    Pick the one unit coming up where you are least happy with your materials, and spend forty minutes on free teacher printables for that unit only. General browsing produces a folder you never open. A specific hunt produces something you use on Thursday.

    Start at the National Archives or the Library of Congress if the unit is document-based, the Federal Reserve if it is economics, the Smithsonian if it is object- or image-based. Run every candidate through the seven questions, especially reading level and what the task asks students to do. Check the license before you put anything in a shared drive. And if what you need is a protocol, a tracker or a rubric rather than content, start with our free printable library, which downloads directly with no email required.

    One more thing worth saying. Hunting for materials is legitimate professional work, and it counts. If you are building a growth goal you will actually revisit or logging hours toward your state’s license renewal requirement, improving your materials is a real place to point that effort — as long as the test stays the same: does this paper produce thinking I can look at?

    Sources

    1. John Dunlosky, Katherine A. Rawson, Elizabeth J. Marsh, Mitchell J. Nathan and Daniel T. Willingham, “Improving Students’ Learning With Effective Learning Techniques,” Psychological Science in the Public Interest, 14(1), 4–58, 2013. Supports the high utility ratings for practice testing and distributed practice and the low ratings for rereading, highlighting and summarization. Caveat: the review spans a wide age range and relies substantially on laboratory studies rather than secondary classrooms; the authors note some techniques are rated moderate precisely because they “have not been adequately evaluated in educational contexts.” https://journals.sagepub.com/doi/10.1177/1529100612453266
    2. U.S. Copyright Law, Title 17, Section 105, “Subject matter of copyright: United States Government works,” U.S. Copyright Office. Supports the statement that copyright protection is not available for works of the U.S. Government. Caveat: this covers works authored by the federal government, not everything hosted on a federal website, and agency seals and logos may carry separate restrictions. https://www.copyright.gov/title17/92chap1.html
    3. DocsTeach, National Archives, accessed October 2026. Supports the document and activity counts, the “completely free” statement, and the distinction between browsing without an account and the additional activities a free account adds. https://www.docsteach.org/
    4. Library of Congress, “Classroom Materials,” accessed October 2026. Supports the description of teacher-built primary source sets with teacher’s guides organized by historical topic. Caveat: the landing page does not itself state grade bands, so check each set. https://www.loc.gov/classroom-materials/
    5. Smithsonian Learning Lab, accessed October 2026, and Federal Reserve Education, accessed October 2026. Support the quoted descriptions of holdings, the grade-band filtering, the “FREE platform” description, and the statement that a free teacher account is needed to save resources and access answer keys. https://learninglab.si.edu/
    6. OER Commons, accessed October 2026. Supports the four conditions-of-use labeling system and the 2007 founding date used to describe the collection. https://www.oercommons.org/
    7. Teachers Pay Teachers, free resources browse page, accessed October 2026. Supports the existence of a large free tier, the requirement to log in to download, and the quoted single-classroom and no-reposting terms that individual sellers attach. Caveat: licensing terms are set per resource by sellers, so read the terms on the specific file rather than assuming. https://www.teacherspayteachers.com/Browse/Price-Range/Free

    Frequently Asked Questions

    Are worksheets bad for middle and high school students?

    No, but they have one narrow good use: structured, repeated retrieval of things students need fast and automatic, revisited after a gap. That use lines up with the only two techniques rated high utility in the major review of learning strategies — practice testing and distributed practice. What is not supported is using a worksheet to introduce a concept, to replace reading, or to fill a period. The question to ask is not whether a page is a worksheet, but whether finished student work on it would tell you something you did not already know.

    If a printable is free, can I change it and share it with my department?

    Not automatically, and these are separate permissions. Works authored by the U.S. federal government are not protected by copyright, which is why National Archives and Library of Congress material can be cropped, excerpted and remixed freely. Openly licensed material carries explicit labels you should read, including share-alike and non-commercial conditions. Free marketplace downloads usually carry single-classroom licenses and explicit bans on reposting, even though the file cost nothing. Before anything goes into a shared drive or an LMS, read the terms attached to that specific file.

    How do I check whether a document is too hard for my students?

    Paste a representative paragraph into a readability tool and look at the grade estimate, then make a deliberate decision rather than hoping. A document written for adults in 1863 is not automatically rigorous for a ninth grader; it is simply hard. If you keep it, excerpt it, chunk it, gloss the vocabulary and build a scaffold. If you cannot do that work before Thursday, pick a different text. Handing out an unmodified hard source and calling it rigor mostly produces students who learn that reading is futile.

    Why do so many free printable sites skew elementary?

    Because that is where the demand volume is, and because elementary material is faster to produce. The practical consequence for secondary teachers is that general searches waste time and you should go to specific institutions instead. Federal archives, museums, the Federal Reserve, professional subject associations and university centers all produce genuinely secondary-level material. On marketplaces, use tight grade and subject filters from the start. And be suspicious of anything with clip art and one-word answer lines, which is usually elementary material relabeled.

    Do I have to create an account to get free materials?

    It depends on the source, and it is worth knowing before you plan a lesson around something. Browsing the National Archives, Library of Congress, OER Commons and the Smithsonian Learning Lab works without an account, though saving and assigning on the Smithsonian site requires one. PBS LearningMedia and the Federal Reserve both ask you to register for free. Teachers Pay Teachers requires an account even for free downloads. Everything in this site’s own library downloads directly with no email, account or sign-up, which is a deliberate choice.

    Is paid material from a marketplace better than free material?

    Not reliably. Price is a signal about packaging and the seller’s time, not about accuracy or alignment. Marketplace material of either kind is not reviewed by anyone except the buyer, so a paid file and a free file from the same marketplace deserve the same scrutiny. Where paying can genuinely be worth it is for a complete, coherent structure you would otherwise spend several evenings building. Where it is rarely worth it is for single pages, which free institutional sources usually provide at equal or better quality.

    How often do free resource links break?

    Often enough that you should open every link before planning around it. While checking sources for this article in October 2026, I found that the deep links for a federal humanities agency’s long-recommended lesson plan library now redirect to a single project page rather than the lessons themselves. That resource had been recommended in teacher materials for over two decades. If a federal site can move out from under its own URLs, any roundup list older than a year will contain dead ends. Download the files you rely on rather than bookmarking them.

    How should I decide what to look for in the first place?

    Start from a unit, never from a browse. Pick the one upcoming unit where you are least happy with your materials, name the specific gap — a text, a data set, a protocol, a rubric — and spend forty focused minutes on that gap only. General browsing produces a folder of downloads you never open again. A targeted hunt produces something in students’ hands on Thursday. Then run each candidate through the alignment, task, reading level, credibility, accuracy, license and evidence questions before it goes near a copier.

    About Clay Shumate

    Clay Shumate is a certified secondary Social Studies teacher in the public schools of West Alabama, with seven years of classroom experience, a B.A. in History, and an M.Ed. in Secondary Education. He writes about project-based learning, student responsibility, respect, and practical ways to hold young people to a higher standard while giving them room to learn from mistakes. He is a member of the Society of Professional Journalists and writes to its Code of Ethics; this site’s editorial standards and corrections policy are published in full. More about Clay.

Teacher Emergency Toolkit — practical resources, real classroom support. Shop on TPT.Teacher Emergency Toolkit — practical resources, real classroom support. Shop on TPT.