Category: Assessment & Feedback

Checking for understanding, feedback, and assessment that changes what happens next.

  • Presentation Rubric: How to Grade a Student Presentation Without Grading Confidence

    Presentation Rubric: How to Grade a Student Presentation Without Grading Confidence

    By Clay Shumate

    A presentation rubric is a scoring guide that splits a student presentation into separate criteria and describes what each level of performance looks like on each one. A good one scores the claim, the evidence, the organization, the audience work and the answers to questions. A bad one scores how comfortable the student looked. That difference is the entire article.

    Most presentation rubrics you can download in thirty seconds have a row called “poise” or “confidence” or “enthusiasm.” I understand why — those are what you notice from the back of the room. They are also what you did not teach, cannot coach in a week, and should not be putting in a gradebook.

    Key Takeaways

    • Score five things: the claim, the evidence, the organization, the adaptation to the audience, and the answers to unscripted questions. Weight the claim heaviest.
    • Confidence is not a criterion. Neither is eye contact on its own. Both measure temperament and cultural habit more than anything you taught. Delivery still matters — it belongs inside audience adaptation, where it describes a choice the student made rather than a personality they have.
    • Rubrics improve scoring reliability, but only under conditions. A review of 75 studies found the gains come from rubrics that are analytic and topic-specific and paired with exemplars or rater training — not from having a rubric at all.
    • Visual aids are the least reliable row on any presentation form. In an ETS study, trained raters agreed exactly on visual aids only 40 percent of the time. Score whether the visual carries information, and nothing else.
    • Your own severity drifts across a week of presentations. That has been measured on seventh graders, and it drifted at the individual level, not the group level. Which means it is your problem to control, not the rubric’s.

    What Should a Presentation Rubric Measure?

    It should measure the five things a student can actually get better at: the accuracy of what they claimed, the quality of what they used to support it, whether a listener could follow the order, whether the talk was built for the people in the room, and whether the student could answer a question they did not write.

    Everything else on a typical form is either a proxy for one of those five or it is personality.

    Those five also map onto what most state speaking-and-listening standards ask for at the secondary level: present findings and supporting evidence clearly and logically, organize the information so a listener can follow the line of reasoning, make strategic use of a visual, and adapt speech to the task and audience. Check your own state’s wording before you borrow mine — but if your rubric has a row that matches no standard in your course of study, that row is worth questioning.

    The rubric is only as good as whether you can explain a row to a fifteen-year-old who disagrees with their score, so here is the one-line version of each. Claim: does the presentation say something, and is it right? A tour of a topic is not a claim. Evidence: is each point supported by a source named specifically enough to check? “A study said” is not sourcing. Organization: could a listener follow the sequence with the slides turned off? Audience adaptation: did the student define unfamiliar terms, pace it for listening, and answer the question this room would actually have? Response to questions: the one row that cannot be faked the night before, and the one most rubrics leave off entirely.

    Five-row graphic listing what a presentation rubric should measure: claim and content accuracy, evidence and sourcing, organization, audience adaptation, and response to questions
    Five criteria. The claim carries the most weight.

    On whether rubrics help at all: Anders Jonsson and Gunilla Svingby reviewed 75 studies of scoring rubrics for Educational Research Review and concluded that reliable scoring of performance assessments can be improved by rubrics — especially if those rubrics are analytic, topic-specific, and supported by exemplars or rater training. That qualifier is the useful part. They also found that a rubric does not by itself make the judgement valid. Handing out a form is not the intervention; the design and the training are.

    If you want a professionally built reference point, the National Communication Association’s Competent Speaker Speech Evaluation Form breaks public speaking into eight competencies — among them narrowing the topic for the audience and occasion, providing supporting material, using an organizational pattern, and using physical behaviors that support the verbal message — each scored unsatisfactory, satisfactory or excellent. Notice that even the delivery competencies are written as things the speaker does, not states they are in. One honest caveat: the 1990 development report states plainly that reliability and validity testing was still planned rather than completed, so treat the form as a well-reasoned professional instrument rather than a validated one.

    I am not going to re-argue analytic versus holistic scoring here, because that question already has a home on this site. The Socratic seminar rubric article works through that choice and the mechanics of scoring a room full of students at once, and the answer there applies to presentations too.

    Why Most Presentation Rubrics Grade the Wrong Thing

    Because the categories that are easiest to see from the back of the room — confidence, enthusiasm, eye contact, polish — are the categories least connected to anything you taught.

    Take the oral presentation rubric published by the National Council of Teachers of English through ReadWriteThink — probably the most-printed presentation rubric in American schools. It is a reasonable, free form covering grades 3 through 12 on a 1–4 scale across three categories: Delivery, Content/Organization, and Enthusiasm/Audience Awareness. I am naming it as the common case, not to dunk on it. But Delivery is defined there as eye contact and voice inflection, and Enthusiasm is scored as something a student either has or does not.

    For a third grader learning to speak above a whisper, those categories do real work. For a sixteen-year-old, scoring enthusiasm means putting a number on whether a teenager performed excitement about a topic you assigned. I have never heard anyone defend that score to a parent well.

    Four-row graphic listing what to keep off a presentation rubric: confidence, eye contact as its own line item, slide design polish, and group participation points
    Four categories that look fair on a rubric and are not.

    There is a fairness problem underneath this, and it is not a small one. This next part is my own judgement as a classroom teacher rather than a research finding, and I want it labeled that way. A rubric row for confidence transfers points from students with anxiety to students without it. A row for eye contact scores a cultural norm about looking adults in the face. A row for slide polish scores whose family owns a laptop and which students have had reason to learn design software. None of those rows are measuring the standard. All of them are measuring something a student brought in the door.

    The right move is not to stop caring about delivery. It is to put delivery inside audience adaptation, defined as choices the student made for the listener, which is coachable. “You spoke to the slides for two minutes without looking up, so the room stopped following” is feedback. “You seemed nervous” is an observation about a person.

    The Presentation Rubric

    Here is the full form. Five criteria, four levels, and the claim row weighted double. Copy it, cut a row if you must, and change the point values to fit your gradebook. It is free and there is no form to fill out.

    Criterion4 — Exceeds3 — Meets2 — Approaching1 — Not yet
    Claim and accuracy
    (×2)
    States a clear, specific, defensible claim and sustains it. No factual errors.States a clear claim and mostly sustains it. Minor errors that do not undercut the point.Topic is clear but the claim is vague, or an error undercuts part of the argument.No identifiable claim, or central content is inaccurate.
    Evidence and sourcingEvery significant point is supported. Sources named specifically enough to check. Weighs a counterpoint.Main points supported. Sources named.Some points supported; sourcing vague (“a study,” “online”).Assertions without support, or sources that do not exist as described.
    OrganizationA listener could follow the sequence with the visuals off. Opening frames it; close lands it.Clear beginning, middle and end. Order makes sense.Follows the slide order rather than an argument. Close trails off.No discernible structure.
    Audience adaptationUnfamiliar terms defined, pace set for listening, addresses the question this audience would have. Visual carries information the talk does not.Mostly built for the listener. Visual supports the talk.Delivered at the slides or the notes. Visual duplicates what is being said.Read verbatim; audience not accounted for.
    Response to questionsAnswers directly, distinguishes what they know from what they are inferring, says “I don’t know” where true.Answers the question asked, with reasonable accuracy.Answers adjacent to the question, or repeats a line from the talk.Cannot engage a question about their own material.
    A presentation rubric for grades 6–12. Claim is weighted double; delivery lives inside audience adaptation.

    One more thing worth doing, and it costs a class period’s first ten minutes: hand students the draft and let them argue one row’s descriptors. Not the criteria — those come from the standard and they are not up for a vote — but the wording of what a 3 looks like. Students who have argued over a descriptor stop treating the number as something that happened to them.

    Three notes on using it. Give it out before students plan, not before they present — a rubric handed out the morning of is a grading instrument, not a teaching one. Show them a 4 and a 2; Jonsson and Svingby’s review is explicit that exemplars are part of what makes rubric scoring reliable, and students calibrate off one example faster than off four paragraphs of descriptors. And say out loud that confidence is not on the rubric. The kids who most need to hear it are the ones who would otherwise spend their prep week worrying about the wrong thing.

    What If Your School Already Adopted a Rubric?

    Then use it, and use the rows above as your feedback rather than your grade.

    Plenty of schools have a common presentation rubric attached to a capstone, a portfolio or a graduate profile, and a teacher quietly swapping in their own form breaks the one thing that instrument is for — comparability across classrooms. Score the adopted rubric as written. Then give the student the five rows above in the comment, because that is where the coachable information is. If the adopted form scores confidence, that is a department or district conversation and it is worth having with the evidence in this article in hand. It is not worth having by going rogue on your own section.

    Visual Aids Are the Least Reliable Row You Will Score

    If you and another teacher score the same presentation, the row you are most likely to disagree about is the visual aid.

    An Educational Testing Service study had trained raters score video of oral presentations and reported intraclass correlations for each dimension. Most held up well — word choice at .93, vocal expression at .91, nonverbal behavior at .89, organization at .73. Visual aids came in at an ICC of .78 but only 40 percent exact agreement, the weakest exact-agreement figure on the form. The same study found that when raters worked from transcripts alone, scoring word choice collapsed to an ICC of .27 and persuasion to .39.

    Two caveats before anyone quotes that at a department meeting. The participants were college students and the raters were trained, not a teacher scoring period four. And trained raters disagreeing sets a ceiling, not a floor — your agreement with a colleague is unlikely to be better.

    Three-card research graphic: rubrics improve reliable scoring when analytic and paired with exemplars or rater training, visual aids reached only 40 percent exact agreement in an ETS study, and individual raters drifted more severe or lenient while scoring seventh-grade presentations over four days
    Three findings that change how you write and use a presentation rubric.

    The practical conclusion is to stop asking the visual-aid row to do too much. Do not score design. Ask one question: does the visual carry information the talk does not? A chart the student made from their own data is a 4. A slide of the paragraph they are reading aloud is a 1, no matter how clean the template. That question is answerable and it is the same question whether the student had Canva or a sheet of poster board.

    Your Scoring Drifts, and Somebody Measured It

    Over four days of presentations, individual raters got measurably more severe or more lenient — and the drift was personal, not shared.

    Aslıhan Erman Aslanoğlu and Mehmet Şata looked at exactly this in a secondary setting, which is rare and worth knowing about. Twenty-eight raters scored eight oral presentations by seventh graders across four days, two per day. Using many-facet Rasch measurement, they found that some raters tended toward more severity or more leniency over time, but found no significant rater drift at the group level. The shifts had no common pattern.

    That is a small study and it is one grade level. But the finding matches what every teacher who has graded thirty presentations in two days already suspects, and the group-level result is the interesting half: you cannot correct for drift by assuming everyone drifts the same way. Four things help, and none of them cost money.

    1. Score during the presentation, not after the period. Scores written from memory are scores written against whoever presented most recently.
    2. Keep two anchor examples in front of you — a known 4 and a known 2, from last year or from the exemplars you showed the class.
    3. Randomize the order, and tell students it is random. Volunteers-first means your strongest students set your scale on day one.
    4. Re-score the first two presentations at the end — before you enter anything. If those scores move, your scale moved, and the fix is to re-score the set rather than to split the difference. Do this while the grades are still in your notes; changing a posted grade is a conversation with a family that you do not need to have.

    How to Get Thirty Presentations Through in One Period

    Cap the talk at four minutes, take one question, and finish the rubric in the sixty seconds while the next student sets up.

    Thirty four-minute presentations will not fit in one period, so make the call deliberately: run them across two days, run them in parallel small groups with you rotating, or shorten the format. A four-minute talk with a required claim and two pieces of evidence tests more than a twelve-minute one, because the student has to decide what matters.

    The question row only works if a question gets asked, and in a real room it will not happen on its own. Assign it. Two students per presenter, named in advance, each owing one question that is not “how long did this take you.” If nobody bites, you ask — but then you are the only questioner for thirty presentations, and by the twentieth your questions get thin.

    Do not write comments live. Score the five rows, write one sentence, and move. The sentence should name the single highest-value change: “Your evidence was strong but the claim never got stated as a sentence — write it on a card next time and open with it.” If you try to write paragraphs you will either stop watching or stop scoring, and both are worse than a short comment.

    If the goal is to get more students talking more often rather than to grade a formal performance, a presentation is a heavy tool for the job. A gallery walk puts every student’s work in front of an audience in one period, and most of the quicker moves on the list of formative assessment strategies get you the same information about who understands the material without anyone standing up, and a Socratic seminar gets them accountable for speaking without the stage. Use the rubric above when the presentation itself is the standard being assessed — not as the default whenever you want students to speak.

    Grading Group Presentations Without Hiding the Silent Student

    Score each speaker on their own segment against the same five criteria, then score one shared row for whether the parts added up to a single argument.

    A single group score is how a student who said eleven words gets the same grade as the student who built the thing, and it makes the grade indefensible the moment a parent asks what their kid specifically did. The fix is not peer-rated effort percentages, which mostly measure social standing. It is to require that every member owns a segment, and to score the segment.

    The individual-versus-group grading problem is worked through in more depth in the project based learning rubric, including how to keep collaboration points from covering for weak content. The principle is the same here: teamwork can be a criterion, but it cannot be a criterion that rescues a grade.

    What About the Student Who Cannot Stand Up There?

    Change the size of the audience, not the criteria.

    Some students genuinely cannot present to thirty peers, and a few have a documented plan that says so. Those plans are not optional — follow them and talk to the case manager rather than improvising.

    And do not build an informal workaround for a student you merely suspect is struggling. If a student seems unable to do this, the route is the counselor or the case manager, not a side deal at your desk — a private arrangement that changes how a student is assessed is a modification nobody has reviewed, and it can quietly cost that student the evaluation that would have gotten them real support.

    For everyone else, notice what the five criteria actually require. A claim, evidence, structure, adaptation to an audience, and answering a question. None of that requires a stage. A student can present to you and two classmates at a back table, or record it, or present to a group of four, and still be scored on the identical form. If you take the recording route, check your district’s policy first and keep the file out of shared drives — a video of a minor is not a normal piece of student work, and a parent is entitled to ask where it went. What you must not do is quietly drop the claim row or the questions row because the setting got smaller. That is lowering the standard and calling it an accommodation, and students can tell.

    And the fixed version of the rubric helps here more than any kindness would. When confidence is not scored, the student who shakes through four minutes and nails the claim, the evidence and the questions gets the grade they earned.

    What to Do Next

    Tell families what the rubric does and does not score before the first grade is entered. A one-line note that reads “this presentation is graded on the claim, the evidence, the structure, how it was built for the audience, and the answers to questions — not on confidence or slide design” prevents most of the emails you would otherwise get, and it reaches the parent of the anxious kid before that kid spends a week dreading the wrong thing.

    Take the table above, cut it to the rows you can defend, and hand it out with the assignment rather than the week of. Pull a 4 and a 2 to show the class. Then, the first time you use it, re-score your first two presentations at the end of the set and see whether your scale moved. That one check will tell you more about your grading than the rubric will.

    If you only change one thing today, delete the confidence row.

    Frequently Asked Questions

    What should a presentation rubric include?

    Five criteria, each scored separately: the accuracy and clarity of the student’s claim, the quality and sourcing of their evidence, the organization of the talk, how well it was adapted to the audience in the room, and how the student handled a question they did not script. Weight the claim heaviest, because it is the only row that measures the subject you teach. Everything else on a typical form is either a proxy for one of those five or it is personality.

    Should a presentation rubric grade confidence or eye contact?

    No. Confidence is a trait rather than a skill you taught, and scoring it moves points from students with anxiety to students without it. Eye contact as its own line scores a cultural habit about looking adults in the face. Delivery still matters — put it inside an audience-adaptation row, where it describes a choice the student made for the listener and can therefore be coached. “You spoke to the slides, so the room stopped following” is feedback. “You seemed nervous” is not.

    How do you grade a group presentation fairly?

    Require that every member owns a segment, then score each student on their own segment against the same five criteria, and add one shared row for whether the parts added up to a single argument. A single group score lets the student who said eleven words earn the same grade as the student who built the project, and it is indefensible the first time a parent asks what their child specifically did. Avoid peer-rated effort percentages — they mostly measure social standing.

    How do you score thirty presentations in one class period?

    You do not. Thirty four-minute talks is two hours of speaking before a single question. Make the call deliberately: run presentations across two days, run parallel small groups with you rotating, or shorten the format. Score the rows during the presentation rather than from memory afterwards, write one sentence naming the single highest-value change, and move. Scores written at the end of the period are scores written against whoever presented most recently.

    Do rubrics actually make grading more consistent?

    They help, but not automatically. Jonsson and Svingby’s review of 75 studies found that reliable scoring of performance assessments is improved by rubrics — especially rubrics that are analytic, topic-specific, and paired with exemplars or rater training. They also found that having a rubric does not by itself make the judgement valid. The design and the training are the intervention, not the handout.

    Does my scoring really change over several days of presentations?

    There is evidence that it does. Aslanoğlu and Şata had 28 raters score eight oral presentations by seventh graders across four days and found that individual raters tended to get more severe or more lenient over time — with no significant drift at the group level, meaning the shifts had no shared pattern. Practical defences: keep a known 4 and a known 2 in front of you, randomize the presentation order, and re-score your first two before you enter any grades.

    What if a student has severe anxiety about presenting?

    Change the size of the audience, not the criteria. A claim, evidence, structure, audience adaptation and answering a question do not require a stage — a student can present to you and two classmates, to a group of four, or on video and be scored on the identical form. What you must not do is quietly drop the claim row or the questions row because the setting got smaller; students can tell. If a student has a documented plan, follow it and talk to the case manager rather than improvising a private arrangement nobody has reviewed.

    Is this presentation rubric free to use?

    Yes. Copy it, cut rows, change the point values, put your school’s name on it. There is no email form, no download gate and nothing to buy. Everything on ElevateTheNorm.com is free.

    Sources

    1. Jonsson, A., & Svingby, G. (2007). The Use of Scoring Rubrics: Reliability, Validity and Educational Consequences. Educational Research Review, 2(2), 130–144. A review of 75 studies; reliable scoring is improved by rubrics that are analytic, topic-specific, and complemented with exemplars and/or rater training, and a rubric alone does not ensure a valid judgement. https://eric.ed.gov/?id=EJ796733
    2. Erman Aslanoğlu, A., & Şata, M. (2023). Examining the Rater Drift in the Assessment of Presentation Skills in Secondary School Context. Journal of Measurement and Evaluation in Education and Psychology. 28 raters scored 8 oral presentations by 7th-grade students across four days; individual-level drift toward severity or leniency was found, with no significant drift at the group level. Small sample, one grade level. https://dergipark.org.tr/en/pub/epod/issue/76343/1213969
    3. A Proof-of-Concept Study on Scoring Oral Presentation Videos in Higher Education. (2019). ETS Research Report Series. Trained raters scoring full videos reached ICCs of .73–1.00 across dimensions; visual aids had the weakest exact agreement at 40 percent, and transcript-only scoring dropped word choice to ICC .27. Participants were college students and raters were trained — not a secondary-classroom sample. https://files.eric.ed.gov/fulltext/EJ1238389.pdf
    4. Morreale, S. P., et al. (1990). “The Competent Speaker”: Development of a Communication-Competency Based Speech Evaluation Form and Manual. National Communication Association / ERIC ED325901. Eight competencies, each scored unsatisfactory, satisfactory or excellent. The report states that reliability and validity testing was planned rather than completed at publication, so it is cited here as a professionally developed instrument, not a validated one. https://files.eric.ed.gov/fulltext/ED325901.pdf
    5. National Council of Teachers of English. Oral Presentation Rubric. ReadWriteThink. A free grades 3–12 form scoring Delivery, Content/Organization and Enthusiasm/Audience Awareness on a 1–4 scale. Cited as the widely used common case this article argues with, not as supporting evidence. https://www.readwritethink.org/classroom-resources/printouts/oral-presentation-rubric
    About Clay Shumate

    Clay Shumate is a certified secondary Social Studies teacher in the public schools of West Alabama, with seven years of classroom experience, a B.A. in History, and an M.Ed. in Secondary Education. He writes about project-based learning, student responsibility, respect, and practical ways to hold young people to a higher standard while giving them room to learn from mistakes. He is a member of the Society of Professional Journalists and writes to its Code of Ethics; this site’s editorial standards and corrections policy are published in full. More about Clay.

  • One Pager Assignment: How to Make It Think Instead of Decorate

    One Pager Assignment: How to Make It Think Instead of Decorate

    By Clay Shumate

    A one pager assignment asks a student to put their thinking about a text, a topic or a unit onto a single page, combining writing and drawing. Done well, it is a compact analysis task with a visual element. Done badly, it is a craft project with a quotation glued to it — and the difference is almost entirely in what you require and what you grade.

    The format came out of AVID and has spread well beyond it. The spread is the problem: most of what teachers see online is the finished art, which tells you nothing about whether the student understood anything.

    Key Takeaways

    • Require elements, not an aesthetic. A claim written as a sentence, two cited pieces of evidence, a drawing that carries an idea, a labelled connection, a lingering question, and one line of so-what. If you can hit every requirement and still not have thought, the requirements are wrong.
    • The research supports the ingredients, not the poster. Drawing to learn improved outcomes in 26 of 28 comparisons at a median effect size of 0.40; summarizing in 26 of 30 at a median of 0.50. Both come with a condition: students need to be taught how.
    • Do not justify a one-pager with “visual learners.” The meshing hypothesis has been examined and found wanting. Justify it because drawing and summarizing are generative work — which is a better reason anyway.
    • Grade the thinking. Four criteria: accuracy of the claim, quality of the evidence, whether the image carries an idea, and completeness. Artistic skill appears nowhere.
    • A template is not a crutch. It is the thing that lets the non-artist start, and the research on drawing says explicitly that pretraining and structure improve the effect rather than diluting it.

    What Is a One Pager Assignment?

    It is a single page on which a student represents their understanding of something, in words and images, using a required set of elements. That is the whole definition. The page is the constraint; the elements are the assignment.

    AVID developed the strategy and it is now used well outside AVID classrooms. In practice you will see it most in English and social studies — after a novel, a chapter, a documentary, a unit — but nothing about the format is subject-specific. A one-pager works anywhere a student needs to compress something large into something defensible.

    What it is not is a poster. A poster communicates to an audience. A one-pager is evidence of thinking, submitted to you. Those two things want different rules, and most of the trouble with one-pagers starts when a teacher writes poster rules and grades them as analysis.

    Three-row research graphic: drawing to learn supported with 26 of 28 comparisons positive and median effect size 0.40, summarizing supported with 26 of 30 positive and median 0.50 but requiring training, and visual learners not supported
    Two of the three claims people make about one-pagers hold up. The third does not.

    Does the Research Support One-Pagers?

    Not directly — there is no body of research on “one-pagers” as such. What there is, and it is good, is evidence on the two things a one-pager makes students do: draw and summarize.

    Fiorella and Mayer’s 2015 review in Educational Psychology Review is the best single place to see it. They assessed eight generative learning strategies against the experimental record. Drawing produced positive effects in 26 of 28 comparisons, with a median effect size of d = 0.40, across elementary, high school and college students — one of their strongest examples was ninth graders working on chemistry comprehension. Summarizing produced positive effects in 26 of 30 comparisons, median d = 0.50.

    So far, so encouraging. Here is the part that changes how you run the assignment. For drawing, the authors are explicit that the effect improves when students receive explicit pretraining in how to draw, detailed guidance about which elements to include, partial illustrations to work from, or a chance to compare their drawing with the author’s. The thing they warn against is “extraneous cognitive load caused by the mechanics of drawing” — a student spending their working memory on composition is not spending it on the content. For summarizing, the training studies they review gave middle schoolers roughly six hours of instruction over five weeks before the summaries got good.

    Read that honestly and it says something uncomfortable: handing out a blank page and saying “be creative” is the version of this assignment the research does not support.

    There is a second line of evidence worth knowing. Fernandes, Wammes and Meade’s 2018 review in Current Directions in Psychological Science describes a reliable “drawing effect” on memory — drawing a word at encoding beats writing it, repeatedly, and the benefit holds for older adults and even appeared in a small group of patients with dementia. Two details matter for a classroom. The benefit arrived with as little as four seconds of drawing per item, and it applies “regardless of one’s artistic talent.” The caveat is the population: these were adults in memory experiments with word lists, not teenagers writing about a novel. It tells you the mechanism is real. It does not tell you the size of the effect on a literary analysis.

    What About “Visual Learners”?

    Leave it out of your rationale. It is the most common justification given for one-pagers and it is the weakest one available.

    Pashler, McDaniel, Rohrer and Bjork examined the evidence for the meshing hypothesis — the idea that matching instruction to a student’s preferred style improves learning — in Psychological Science in the Public Interest in 2008. Their finding was blunt: they found “virtually no evidence for the interaction pattern” that would be required to validate the educational application, and concluded that “there is no adequate evidence base to justify incorporating learning-styles assessments into general educational practice.”

    This is not a reason to stop assigning one-pagers. It is a reason to describe them accurately to students, to parents and to an administrator who asks. The honest sentence is: drawing and summarizing are generative activities with a decent evidence base, so I am asking every student to do both. That is stronger ground than a learning style, and it does not sort children into categories the research does not support.

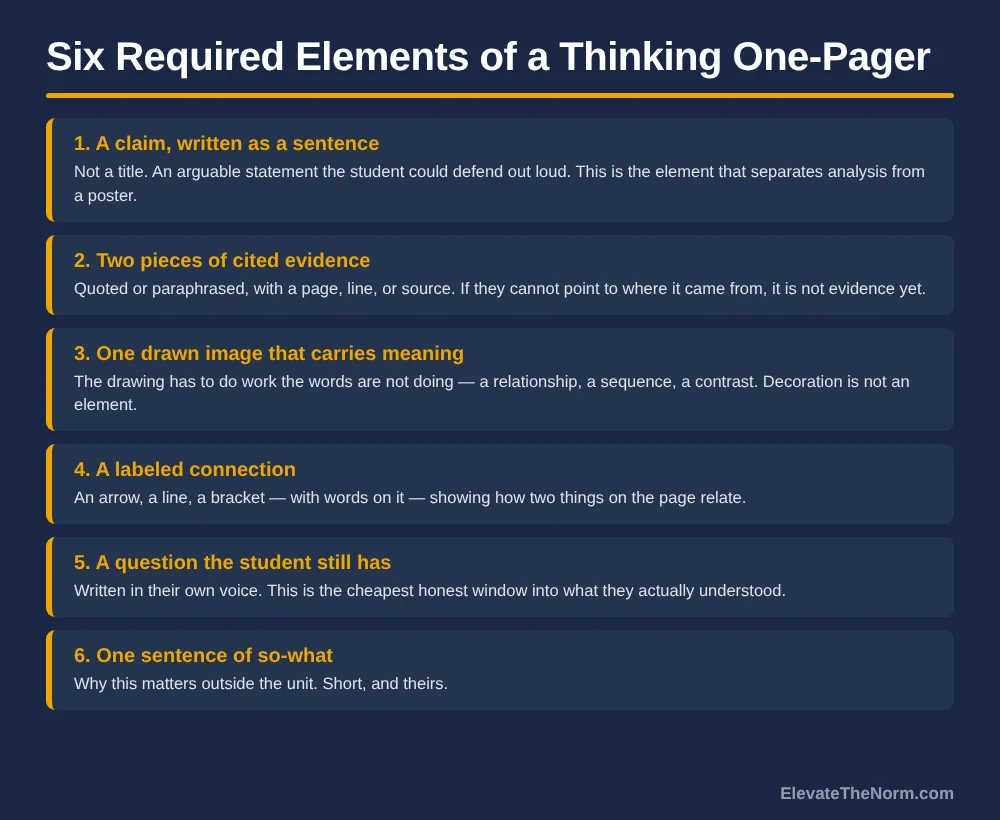
    Six-row graphic listing required elements of a one pager assignment: a claim written as a sentence, two pieces of cited evidence, one drawn image that carries meaning, a labeled connection, a question the student still has, and one sentence of so-what
    Six required elements. Every one of them is thinking, not decoration.

    What Should a One-Pager Actually Require?

    Six elements, each of which is a thinking move rather than a design choice. The test for any element you add: could a student satisfy it without understanding the material? If yes, cut it.

    A claim, written as a sentence. Not a title, not a theme word. An arguable statement the student could defend out loud. This single requirement does more work than the other five combined, because it is the one that cannot be faked with a border.

    Two pieces of cited evidence. Quoted or paraphrased, with a page number, a line, or a source. “Cited” is doing real work here — if a student cannot point to where it came from, it is not evidence yet.

    One drawn image that carries meaning. The drawing has to do something the words are not doing: show a relationship, a sequence, a contrast, a scale. A decorative border is not an element. A badly drawn diagram that makes a comparison visible is.

    A labelled connection. An arrow, a line or a bracket with words on it, showing how two things on the page relate. This is the cheapest way to force synthesis, and it is the element students most often skip.

    A question the student still has. In their own voice. It is the most honest window you will get into what they actually understood, and it costs them thirty seconds. If you want a wider version of this, it is the same instinct behind asking a student to judge their own work before you do.

    One sentence of so-what. Why this matters outside the unit. Short, and theirs. Most students will write something flat the first time. They get better at it the fourth time, which is an argument for assigning one-pagers more than once a year.

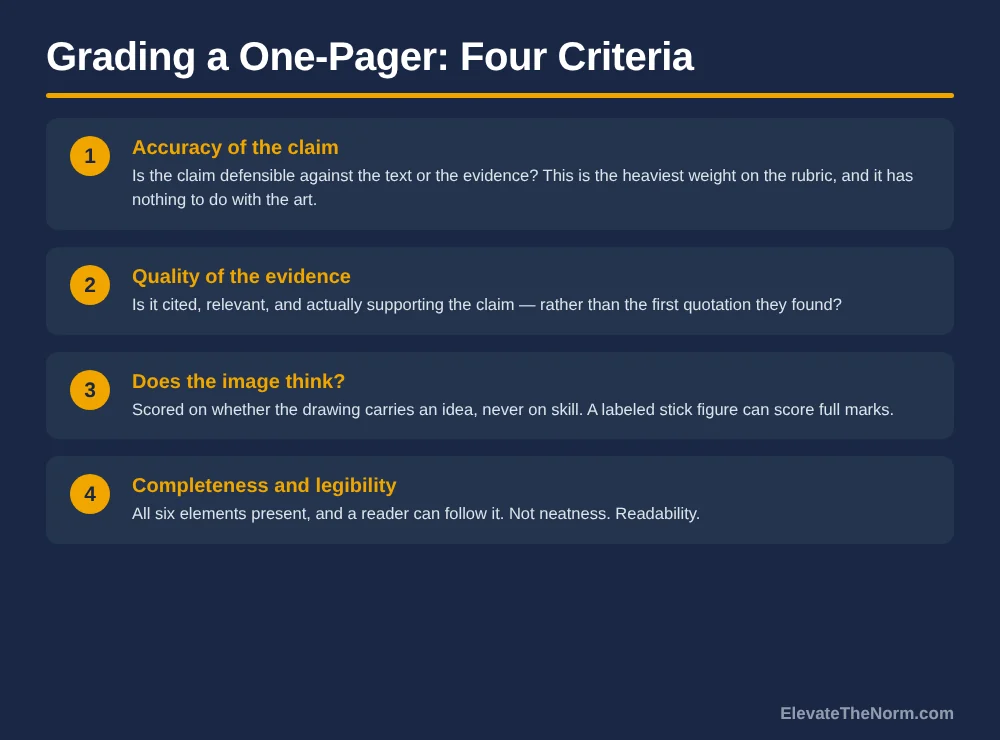
    Numbered four-criteria grading graphic for a one pager assignment: accuracy of the claim, quality of the evidence, whether the image carries an idea, and completeness and legibility rather than neatness
    Four criteria, none of which is artistic skill.

    How Do You Grade a One-Pager Without Grading Art?

    Put artistic skill nowhere on the rubric, and tell students that before they start. Four criteria will carry it.

    Accuracy of the claim is the heaviest weight. Is it defensible against the text or the evidence? This has nothing to do with how the page looks. Quality of the evidence comes second: cited, relevant, and actually supporting the claim rather than being the first quotation the student found. Does the image think? — scored on whether the drawing carries an idea, never on execution. A labelled stick figure can score full marks and should. Completeness and legibility is the last and the smallest: all six elements present, and a reader can follow it. Legibility is not neatness. A page can be messy and perfectly readable.

    Two things to resist. Do not add a “creativity” or “visual appeal” category — it is unscoreable, it rewards students who already had art supplies at home, and it is the single fastest way to turn this into an equity problem. And do not give points for colour. If you want the general version of this argument, the same reasoning applies to any rubric where presentation can hide thin understanding.

    Three practical conditions follow from that. The assignment has to be completable with a pencil — if markers are required, you have built a supply test, so keep whatever you have in a tub on the counter and do the work in class rather than at home. Score the “question you still have” element present-or-absent, never on quality, or students will stop telling you the truth in the one place they were being honest. And tell families the rubric excludes artistic skill before the first grade goes in the book, because a parent looking at a drawing with a C on it will reasonably assume you graded the drawing.

    Alternatives need to be available without a formal plan: typed and printed elements pasted down, cut images instead of drawn ones, or the whole thing explained to you verbally while you score the same four criteria. A student with a fine-motor difficulty, a visual impairment, or a hand in a cast should not have to disclose anything to get a different route.

    On grading time — this is the objection every teacher with 150 students will have, and it is correct. Score in one pass, in bands rather than points, and write a comment only on the claim. If the claim is wrong, nothing downstream of it is worth your ink. Four criteria scored 1–4 with one sentence on the first of them runs about ninety seconds a page.

    One more move that costs four minutes and is worth more than the rubric. Walk the room while they work and ask three or four students to defend the claim on their page out loud — not to justify the picture, just the sentence. I do a version of this constantly: circulating, pulling a student aside, and making them explain the decision they made rather than telling them whether it was right. You find the gap between a page that looks finished and a page that is understood in about twenty seconds, and you find it while there is still time to fix it. That is the same thing any good in-the-moment check is for.

    What About the Student Who Says They Cannot Draw?

    Give them a template and say the sentence out loud: nobody is being graded on drawing. Then mean it, because teenagers will test whether you meant it.

    Betsy Potash, writing at Cult of Pedagogy, identifies the problem exactly: the one-pagers that circulate online are made by artistic students, and everybody else concludes the assignment is not for them. Her fix is a template — a page with designated spaces for each required element — which she describes as a creative constraint that paradoxically frees students up, because the paralysis is usually about placement rather than content. Students who want a blank page can flip the template over and use the back.

    That is a practitioner’s recommendation rather than a research finding, and it should be read as one. But it points the same direction the research does: Fiorella and Mayer found that structure, partial illustrations and guidance about which elements to include increase the benefit of drawing rather than watering it down. The template is not a concession. It is the scaffold the evidence asks for.

    Where One-Pagers Go Wrong

    Four failure modes, and three of them are the teacher’s.

    The first is the blank page with no requirements, which produces decoration from the artists and panic from everyone else. The second is grading the aesthetic, which teaches students that the assignment was about markers all along. The third is assigning it once, at the end of a unit, as a summative grade — the first one a student makes is always the worst one, and the research on summarizing says the skill takes weeks of instruction to develop. Run the first as practice. The fourth is the student version: filling every element with something technically present and entirely hollow. The claim sentence catches most of this, and the four-minute verbal check catches the rest.

    How Do You Launch It the First Time?

    Spend twenty minutes before anyone touches a page. This is the pretraining the drawing research keeps pointing at, and skipping it is why most first attempts disappoint.

    Show two finished examples — one strong, one weak — and have the class score both against your four criteria before they know which is which. Make the weak one visually attractive and analytically thin, because that is the trap. Then model the hardest element: write a claim sentence in front of them, out loud, and revise it once. Then let them start, with the template on the desk and the requirements on the board.

    If you want the pages to do a second job, hang them and run a structured walk around the room where students read each other’s claims and leave one question each. The reading is worth more than the display, and it makes the “question you still have” element feel like it has a purpose beyond the gradebook. Make the display opt-out without explanation — some students are genuinely uncomfortable having a drawing on the wall, and nothing about the learning requires it to be public.

    Afterwards, do not just file them. Read the question column across the whole class in one sitting; it is the cheapest reteach list you will ever assemble, and it was generated by students who thought nobody was grading it.

    What to Do Next

    Take whatever you were going to assign as a written response this month and convert it — same content, six required elements, four grading criteria, a template on every desk, and twenty minutes of launch before the first page gets made. Run it as practice rather than as a test grade.

    Then do it again inside the same semester. Almost everything useful about one-pagers shows up on the second and third attempt, once students have stopped worrying about the layout and started arguing on paper. If you need the in-between measurement, a two-minute check sorted by where it falls in a lesson will tell you more, sooner, than waiting for the pages to come in.

    Frequently Asked Questions

    What is a one pager assignment?

    A single page on which a student represents their understanding of a text, topic or unit using both words and images, against a required set of elements. The strategy came out of AVID and is now used well beyond it, most commonly in English and social studies. The page is the constraint; the required elements are the actual assignment. It is not a poster — a poster communicates to an audience, while a one-pager is evidence of thinking submitted to a teacher, and the two want different rules.

    Is there research showing one-pagers work?

    Not on one-pagers as a named format. There is good evidence on the two things a one-pager makes students do. In Fiorella and Mayer’s review of generative learning strategies, drawing produced positive effects in 26 of 28 comparisons at a median effect size of d = 0.40, and summarizing in 26 of 30 at a median of d = 0.50, across elementary, high school and college students. Both come with the same condition: the effect improves when students are explicitly taught how, and the summarizing training studies gave middle schoolers roughly six hours of instruction over five weeks.

    Should I say one-pagers are good for visual learners?

    No. Pashler, McDaniel, Rohrer and Bjork examined the meshing hypothesis — that matching instruction to a preferred style improves learning — and found “virtually no evidence” for the interaction pattern it requires, concluding there is “no adequate evidence base” for using learning-styles assessments in general practice. Use the better justification instead: drawing and summarizing are generative activities with real support, so every student does both. That reasoning survives a conversation with an administrator, and it does not sort students into categories the evidence does not back.

    How do I grade a one-pager fairly?

    On four criteria, none of which is artistic skill: accuracy of the claim, quality of the cited evidence, whether the drawn image carries an idea rather than decorates, and completeness and legibility. Weight the claim heaviest. Do not add a creativity or visual-appeal category — it is unscoreable and it rewards students who own art supplies. Tell families the rubric excludes drawing before the first grade is entered, because a parent seeing a low mark on a page with a picture on it will assume you graded the picture.

    What do I do about students who say they cannot draw?

    Give them a template with a designated space for each element and say out loud that nobody is graded on drawing — then hold to it, because they will test whether you meant it. A labelled stick figure that makes a comparison visible should score full marks. Alternatives need to be available without a formal plan: typed elements pasted down, cut images rather than drawn ones, or explaining the page to you verbally while you score the same four criteria.

    Does a template make the assignment too restrictive?

    The evidence points the other way. Fiorella and Mayer found that structure, partial illustrations and guidance about which elements to include increase the benefit of drawing rather than diluting it, and the risk they name is extraneous cognitive load from the mechanics of drawing — which is exactly what a blank page creates. The template removes the paralysis about placement so the student can spend their attention on the content. Students who want the open page can use the back of it.

    Should a one-pager be a test grade?

    Not the first one. The first attempt is always the worst attempt, and the research on summarizing says the skill takes weeks of instruction to develop, so a summative grade on a first try is measuring unfamiliarity with the format. Run the first as practice, assign a second inside the same semester, and grade that one. Almost everything useful about one-pagers appears on the second and third attempt, once students have stopped worrying about layout and started arguing on paper.

    Does handwriting the page help more than typing it?

    There is no good evidence for that, and it is worth knowing because the claim gets repeated a lot. Urry and colleagues ran a direct replication of the well-known longhand-versus-laptop study with 142 undergraduates and found a negligible effect in the opposite direction on conceptual questions, and a mini meta-analysis across eight studies found no significant difference in quiz performance. Assign a one-pager because drawing and summarizing are generative, not because the student held a pen.

    Sources

    1. Fiorella, Logan, and Richard E. Mayer. “Eight Ways to Promote Generative Learning.” Educational Psychology Review, vol. 27, 2015, pp. 1–47. Drawing: positive effects in 26 of 28 comparisons, median d = 0.40, across elementary, high school and college students; effect increases with explicit pretraining in how to draw, guidance on elements, partial illustrations or comparison with author-provided drawings, and the stated risk is extraneous cognitive load from the mechanics of drawing. Summarizing: 26 of 30 comparisons positive, median d = 0.50; middle-school training studies required roughly six hours of instruction over five weeks. https://doi.org/10.1007/s10648-015-9348-9
    2. Fernandes, Myra A., Jeffrey D. Wammes, and Melissa E. Meade. “The Surprisingly Powerful Influence of Drawing on Memory.” Current Directions in Psychological Science, vol. 27, no. 5, 2018, pp. 302–308. Reports a reliable recall advantage for drawn over written words, benefits arriving with as little as four seconds of drawing per item, and the authors’ statement that the benefit applies “regardless of one’s artistic talent.” Populations are younger adults, older adults and a group of 13 patients in long-term care — not secondary students, and the materials are word lists rather than academic content. Cited for mechanism, not for an effect size on classroom work. https://doi.org/10.1177/0963721418755385
    3. Pashler, Harold, Mark McDaniel, Doug Rohrer, and Robert Bjork. “Learning Styles: Concepts and Evidence.” Psychological Science in the Public Interest, vol. 9, no. 3, 2008, pp. 105–119. The authors found “virtually no evidence for the interaction pattern” required to validate learning-styles instruction and concluded “there is no adequate evidence base to justify incorporating learning-styles assessments into general educational practice.” https://doi.org/10.1111/j.1539-6053.2009.01038.x
    4. Urry, Heather L., et al. “Don’t Ditch the Laptop Just Yet: A Direct Replication of Mueller and Oppenheimer’s (2014) Study 1 Plus Mini Meta-Analyses Across Similar Studies.” Psychological Science, vol. 32, no. 10, 2021, pp. 1479–1492. Direct replication, N = 142 undergraduates. Conceptual-question performance showed a negligible effect in the opposite direction to the original (Hedges’s g = −0.13, 95% CI [−0.45, 0.20]), significantly different from the original result. A mini meta-analysis of eight studies found g = 0.04, 95% CI [−0.13, 0.20], not significant. The authors conclude results “do not support the idea that longhand note taking improves immediate learning via better encoding of information.” Cited as contrary evidence: do not justify handwritten work on the grounds that writing by hand beats typing. https://doi.org/10.1177/0956797620965541
    5. Potash, Betsy. “A Simple Trick for Success with One-Pagers.” Cult of Pedagogy, 26 May 2019 (updated 2026). Credits AVID with developing the strategy; describes the template as a creative constraint that helps non-artistic students start, and recommends simple rubric categories such as textual analysis, required elements and thoroughness. Cited as practitioner recommendation, not as research evidence. https://www.cultofpedagogy.com/one-pagers/

    About Clay Shumate

    Clay Shumate is a certified secondary Social Studies teacher in the public schools of West Alabama, with seven years of classroom experience, a B.A. in History, and an M.Ed. in Secondary Education. He writes about project-based learning, student responsibility, respect, and practical ways to hold young people to a higher standard while giving them room to learn from mistakes. He is a member of the Society of Professional Journalists and writes to its Code of Ethics; this site’s editorial standards and corrections policy are published in full. More about Clay.

  • Test Corrections: How to Make Them Teach Instead of Hand Back Points

    Test Corrections: How to Make Them Teach Instead of Hand Back Points

    By Clay Shumate

    Test corrections are a structured second pass in which a student identifies why an answer was wrong and produces a correct one. The research on learning from errors is strong and supports the practice. The research on what students actually do with error feedback is much less flattering, and it is the part that determines whether your version works.

    Done well, a test correction is the most efficient reteaching you will ever get: the student already knows what they missed. Done badly, it is twenty minutes of copying answers off a neighbor’s paper for half the points back.

    Key Takeaways

    • Making errors and then correcting them beats avoiding errors. A review in the Annual Review of Psychology concluded that error avoidance “appears to be the rule in American classrooms” and that errorful learning followed by corrective feedback produces better retention.
    • Feedback is not optional — it is the whole mechanism. In one lab study, errors were corrected on a later test about 70% of the time with feedback and roughly 4% of the time without it.
    • Your most confident wrong answers are the ones most likely to get fixed. That is the hypercorrection effect, and it means the student who argues with you about question 14 is the student most likely to remember the right answer in May.
    • When corrections are optional, most students skip them. Across 20,058 assessments from 2,826 students in grades 5–11, students opened the detailed error feedback in only 44% of cases — and the students with the lowest scores were the least likely to look.
    • A reflection form on its own does nothing. A randomized study of “exam wrappers” found no effect on exam scores, final grades, or measured metacognition. The structure has to force the thinking, not just ask for it.

    Free Download · PDF

    The Test Correction Sheet and Policy Card (2 pages)

    Page 1 is the student sheet — three blocks of the four-box correction, with the reasoning box that makes copying an answer useless. Page 2 is a policy card to fill in and staple to the first test of the term, plus a sorting sheet for reading a class set in five minutes.

    Download the free PDF

    Free. No email address required. Designed for grades 6–12. Browse every printable in Your Free Library.

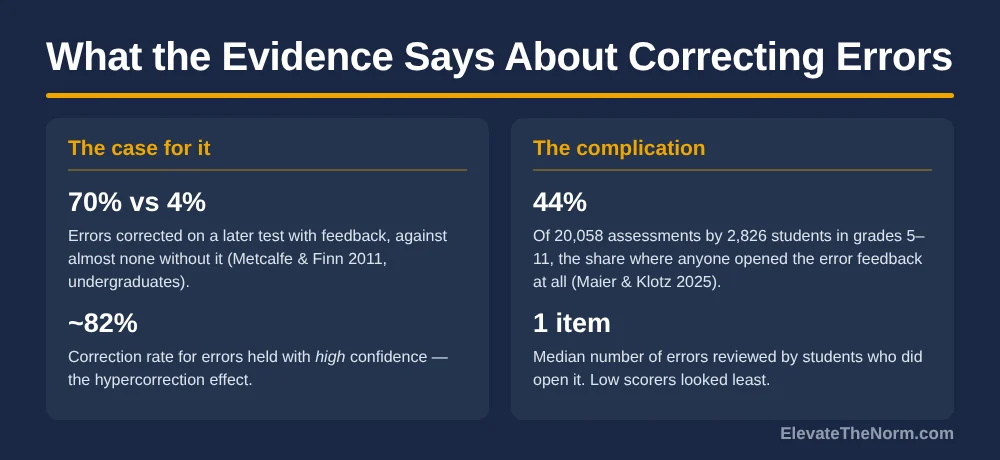
    Two-column graphic on test corrections evidence: 70 percent versus 4 percent correction rates with and without feedback and roughly 82 percent for high-confidence errors on one side, a 44 percent feedback open rate and a median of one error reviewed on the other
    The case for corrections and the complication, side by side.

    What Are Test Corrections?

    A test correction is a required second pass over a returned assessment in which the student states what the right answer is and why their first one was wrong. That second clause is the whole practice. Without it you have a transcription exercise.

    Two versions run in American schools under the same name, and they produce opposite results.

    Version one: hand back the test, let students fix wrong answers, give half credit back. Most look at the answer key, write the right letter, hand it in. Nobody learns anything, the grade goes up, and the next test looks exactly like the last one.

    Version two: the student has to name the error — not the answer, the error. What did I think was true that was not? That version is slower, harder to grade, and is the one with research behind it.

    If you only take one thing from this article: the credit is not the intervention. The credit is the thing that gets students to do the intervention. Confusing the two is how a good practice turns into grade inflation with extra steps.

    Does the Research Actually Support Learning From Mistakes?

    Yes, and more strongly than most teachers assume. Janet Metcalfe’s review “Learning from Errors,” published in the Annual Review of Psychology in 2017, surveys the laboratory evidence and reaches a blunt conclusion: error avoidance “appears to be the rule in American classrooms,” and it is the wrong rule. Errorful learning followed by corrective feedback produces better retention than carefully steering students around mistakes.

    Her recommendation is that teachers should “allow and even encourage students to commit and correct errors while they are in low-stakes learning situations rather than to assiduously avoid errors at all costs,” precisely because the goal is performance later, when the stakes are high.

    The crucial qualifier is the phrase followed by corrective feedback. Metcalfe is explicit that the feedback, “including analysis of the reasoning leading up to the mistake,” is what makes the error productive. A wrong answer left wrong is just a wrong answer. Same logic that makes formative assessment worth the class time: information is only worth collecting if something happens next.

    Why Your Most Confident Students Gain the Most

    Students correct the errors they were most sure about more reliably than the ones they guessed at. That is the hypercorrection effect, and it is counterintuitive enough that it is worth stating twice.

    Janet Metcalfe and Bridgid Finn tested it directly in a 2011 paper in the Journal of Experimental Psychology: Learning, Memory, and Cognition. Participants answered general-knowledge questions, rated their confidence, received corrective feedback on their errors, and were tested again later. Errors held with high confidence were corrected on the final test around 82% of the time. Overall recall after feedback was about 70%. Without feedback, correction rates fell to roughly 4%.

    Two things follow. First, the gap between 70% and 4% is the clearest number in this entire literature, and it says the thing teachers most need to hear: returning a graded test without a correction process is close to doing nothing. Second, the student who comes up after class and argues that question 14 was unfair is not being difficult. High confidence plus a wrong answer is the configuration most likely to produce durable learning. Argue back, with evidence.

    Stated honestly: these were college undergraduates, in a lab, answering trivia. Samples ran from 25 to 45 people per experiment. The mechanism is about confidence and attention rather than age, so it is reasonable to expect it to transfer to a fifteen-year-old and a unit test. The exact percentages are not yours to quote as classroom results.

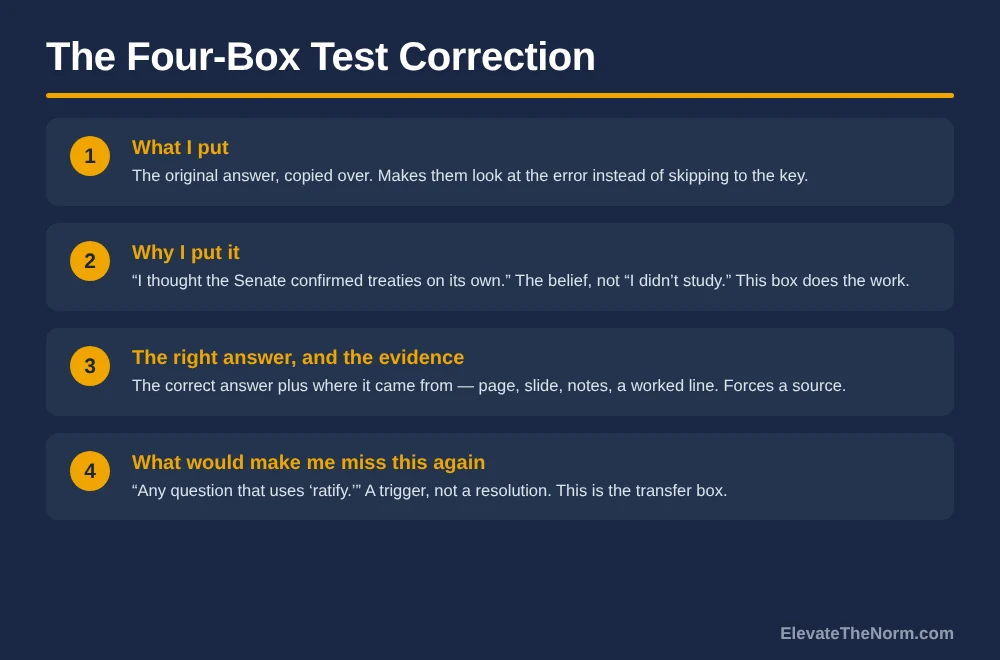
    Four numbered boxes of a test correction form: what I put, why I put it, the right answer and where it came from, and what would make me miss this again
    Box 2 is the one that makes copying an answer off a neighbour useless.

    So Why Don’t Test Corrections Always Work?

    Because when looking at the feedback is optional, most students don’t — and the ones who need it most are the least likely to. This is the finding that should change what you build, and it comes from the largest secondary-school sample in this article.

    Ulrich Maier and Christian Klotz analyzed log data from a digital formative assessment system used in German schools, published in Contemporary Educational Psychology in 2025. The scale is unusual: 2,826 students across 182 secondary classrooms in grades 5 through 11, covering 20,058 formative assessment cases collected between 2020 and 2024. After each assessment the system offered a detailed error feedback page explaining what went wrong.

    What students did with it:

    • They opened the error feedback page in only 44% of cases. In the majority of assessments, nobody looked at the explanation at all.
    • Among those who opened it, the median number of error items reviewed was one. The average was 1.74, roughly half of the errors available to them.
    • Prior knowledge was by far the strongest predictor of whether a student looked. Higher scorers were dramatically more likely to seek feedback. The authors state the paradox plainly: low-achieving students tend to ignore elaborated feedback, despite being the group most likely to benefit from it.
    • Students who thought they had passed were more likely to open the feedback than students who thought they had failed — even when the confident ones had actually failed.

    That is a digital platform rather than a paper test, and German secondary schools rather than American ones, so the exact rates will not be yours. But the shape of it will be. Optional reflection is self-selecting, and it selects for the students who already understand the material. Any correction process you design has to assume the student who most needs it will skip it unless the structure does not permit skipping.

    The Reflection Sheet Is Not the Intervention

    A form that asks students to reflect does not, on its own, produce reflection. There is a direct test of this.

    Raechel Soicher and Regan Gurung studied “exam wrappers” — short reflection sheets students complete after a returned exam about how they studied and what they will change. Published in Psychology Learning & Teaching in 2017, the study randomly assigned 86 students to three conditions: real exam wrappers with metacognitive instruction, sham wrappers with no instruction, or a control group. There were no improvements in exam performance, final grades, or measured metacognitive ability. Scores on the Metacognitive Awareness Inventory rose over the semester in every condition, including the control, which is a reminder of what happens to an uncontrolled before-and-after comparison.

    The authors suggest the effect may require use across multiple courses rather than one. Fair. But the practical lesson for a secondary teacher is immediate: if your test correction process is a sheet of reflection prompts stapled to the front, you have bought the packaging and not the thing. The questions that produce learning are about the specific item — this question, this error, this misconception — not about study habits in general.

    A Four-Part Test Correction That Produces Thinking

    Each wrong answer gets four boxes. Not three, and not six. This is the smallest structure that makes transcription impossible.

    BoxWhat the student writesWhy it is there
    1. What I putThe original answer, copied over.Makes them look at the error rather than skipping straight to the key. Takes five seconds.
    2. Why I put it“I thought the Senate confirmed treaties on its own.” A sentence naming the belief, not “I didn’t study.”This is the box that does the work. It is also the one students resist, because it requires admitting what they believed.
    3. The right answer, and the evidenceThe correct answer plus where it came from — page, slide, notes, a worked line.Forces a source. A student who cannot find it does not understand it yet, and now you both know.
    4. What would make me miss this again“Any question that uses ‘ratify.’” A trigger, not a resolution.Transfer. The point is the next question of this type, not this question.

    Box 2 is the one people cut when they are short on time, and it is the only one that distinguishes this from an answer key. “Careless mistake” is not an acceptable entry in box 2 more than once per test; if a student writes it three times, the pattern is the finding and it is worth a two-minute conversation.

    For a free-response or math item, box 3 becomes “the first line where it went wrong,” which is more useful than reworking the whole problem and usually faster.

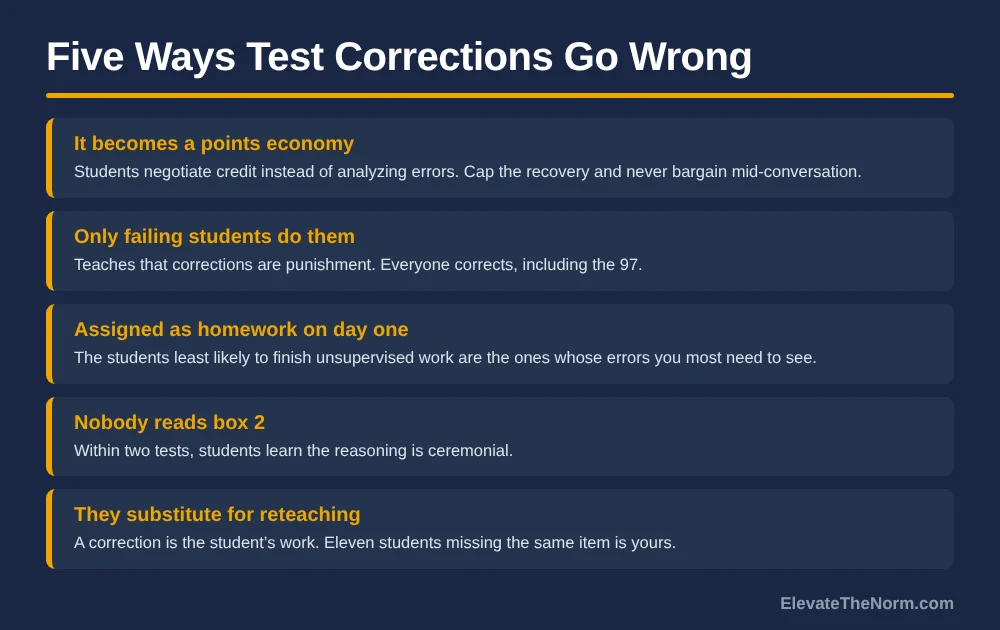
    List of five ways test corrections go wrong, including becoming a points economy and only failing students completing them, each with a fix
    Each of these turns a correction into paperwork.

    How Much Credit Should Test Corrections Be Worth?

    Enough that students do them, little enough that the grade still means something. Half the missed points back is the common answer and it is defensible. So is a flat cap — corrections can move a score up to a 79 and no further.

    Three things to settle before you announce it:

    1. Check your district’s grading policy first. Many boards have adopted language about reassessment, grade replacement, and minimum scores. A teacher-invented points-back scheme that conflicts with board policy is a problem that has nothing to do with pedagogy, and you will lose that argument in March rather than in September.
    2. Write it down and hand it out. Parents are reasonable about a policy that exists and furious about one that appears to change by student. “Up to half the missed points, corrections due within one week, box 2 must be completed” fits on an index card.
    3. Decide whether a correction can raise an A. The honest answer is yes. A student who got a 97 has three errors worth understanding, and excluding the strongest students from the only reteaching structure in the class is backwards. If credit is the only incentive you have, offer the strongest students the thing they actually want: the correction counts, and it gets read.

    A note on what this does to your gradebook. If corrections replace scores rather than adding points, you are most of the way to standards-based grading already, and you should read the honest case against it before you commit, because the implementation problems there are real.

    Test Corrections or a Retake — Which One Do You Need?

    A correction analyzes the test the student already took. A retake is a new assessment of the same material. They answer different questions and they are not substitutes.

    • Use corrections when the errors are scattered. A 71 made of eleven different small mistakes is a diagnosis problem. Corrections surface the pattern.
    • Use a retake when the student did not know the material. A 44 does not have a pattern to find. It has a hole, and corrections on a test you did not understand is just copying.
    • Use both, in order, when the stakes are real. Corrections first, as the price of admission to the retake. It is a reasonable gate and it stops the retake from being a free second roll of the dice.

    Sequencing them that way also solves a fairness problem administrators raise: if a retake is available to anyone who asks, the students who ask are the students whose families know to ask. Requiring the correction makes the path the same for everybody.

    What About the Student Who Just Copies the Right Answer?

    Assume this will happen and build so it does not pay. Box 2 is most of the defence — you cannot copy someone else’s misconception off their paper, because it was not your misconception.

    Beyond that the answers are ordinary. Do corrections in class, not as homework, at least the first few times — so you see the thinking happen and so students without a quiet place to work are not disadvantaged. Spend two of those minutes circulating and asking one student per row to explain box 2 out loud.

    The Grading Burden, Honestly

    If you teach 150 students and read four boxes on every missed item, you will stop doing this by October. Anyone who tells you otherwise has not graded a stack of 150.

    Three ways to make it survivable:

    • Cap it. Students correct their five worst items, not all of them. Five is plenty for a pattern and it bounds your reading.
    • Score box 2 only, and score it pass/fail. A complete, specific sentence gets the credit. A blank or “I didn’t study” does not. You can do that at a glance.
    • Read them as a class set, not as individual papers. Sort the box-2 responses into piles by misconception. Five minutes of sorting tells you what to reteach tomorrow, which is the only reason to collect them at all.

    That last one is also the answer to a coach’s question: the evidence of learning is not the corrected test. It is what you teach differently on the next item of that type, and whether the same misconception shows up again on the unit after this one. If it does, the corrections were decoration. The habit of asking that question after an assessment is the same one behind any serious approach to checking for understanding.

    What Does This Look Like From a Student’s Seat?

    It looks like being asked to write down, on paper, in your own handwriting, the thing you were wrong about. That is harder than it sounds at fifteen, and it is worth naming out loud the first time you assign it.

    Say the thing directly: this is not a punishment, everyone does it including the people who scored highest, and nobody is reading box 2 to laugh at you. Then make that true. A correction process where the teacher reads a student’s misconception back to them in front of the class is a process that will be filled in with nothing real by Thanksgiving.

    Students should also be able to argue. If a student’s box 2 says “I put B because the question says ‘primarily,’ and both A and B are true,” they may be right and the item may be bad. Give points back when they are. A correction process in which the teacher is never wrong is one the students will correctly read as theatre.

    And handle accommodations through the plan, not through the policy. A student with extended time or a scribe on the test has the same entitlement on the correction. A student with a processing or writing accommodation can answer box 2 out loud to you in ninety seconds; the requirement is the thinking, not the handwriting. The plan governs, and designing the correction so that honoring it looks ordinary is easier than making an exception every time.

    Where Test Corrections Go Wrong

    • They become a points economy. Students negotiate credit instead of analyzing errors. Fix: cap the recovery and never bargain over it mid-conversation.
    • Only failing students do them. Which teaches that corrections are what happens when you mess up, rather than what everyone does with a returned test. Fix: everyone corrects, including the 97.
    • They are assigned as homework on day one. The students least likely to complete unsupervised work are the students whose errors you most need to see — the same self-selection Maier and Klotz measured.
    • Nobody reads box 2. If the teacher never responds to the reasoning, students learn within two tests that the reasoning is ceremonial.
    • They substitute for reteaching. A correction is the student’s work. If eleven students missed the same item, that is your work.

    What to Do Next

    Take the next test you are about to hand back and do three things. Require corrections from every student, not just the ones who failed. Make box 2 — why I put it — mandatory for credit, and refuse “careless mistake” as a repeat answer. Then sort the box-2 responses into piles before you plan tomorrow, because that pile is the most honest data you will get all unit.

    The deeper argument here is not about points. It is that a test handed back and filed away teaches a teenager that a wrong answer is a verdict, and a test corrected teaches them it is information. That is the same case the site makes about learning from mistakes everywhere else, and it is the reason a correction belongs in the student’s hands rather than the gradebook — which is also the argument for student self-assessment as a routine rather than an event.

    Before you go: grab the free The Test Correction Sheet and Policy Card (2 pages) (PDF) — ElevateTheNorm.com branded, printable, no email required.

    Frequently Asked Questions

    Do test corrections actually work?

    The underlying mechanism is well supported. Metcalfe’s 2017 review in the Annual Review of Psychology concludes that errorful learning followed by corrective feedback beats error avoidance, and in one lab study errors were corrected on a later test about 70% of the time with feedback against roughly 4% without it. The complication is compliance. In a study of 20,058 assessments by 2,826 students in grades 5–11, the error feedback page was opened in only 44% of cases. Corrections work. Optional corrections mostly do not.

    How much credit should test corrections be worth?

    Enough that students do them and little enough that the grade still means something. Half the missed points back is the common answer and it is defensible; so is a flat cap that lets corrections raise a score to a 79 and no further. Check your district’s grading and reassessment policy before you announce anything, write the policy down, hand it out, and do not vary it by student.

    What is the difference between test corrections and a retake?

    A correction analyzes the test the student already took. A retake is a new assessment of the same material. Use corrections when the errors are scattered — a 71 made of eleven small mistakes is a diagnosis problem. Use a retake when the student did not know the material, because corrections on a test you did not understand is just copying. When the stakes are real, use both in order and make the completed correction the price of admission to the retake.

    How do I stop students from just copying the right answer?

    Require a box that asks why they put what they put — the belief, not "I didn’t study." You cannot copy somebody else’s misconception off their paper, because it was not your misconception. Beyond that, do the first few rounds in class rather than as homework so you can see the thinking happen, and ask one student per row to explain that box out loud.

    Should students who got an A do test corrections?

    Yes. A student who scored 97 has three errors worth understanding, and excluding your strongest students from the only reteaching structure in the class is backwards. It also fixes a dignity problem: if only failing students correct, corrections become what happens when you mess up rather than what everybody does with a returned test.

    How do I grade test corrections for 150 students?

    Cap it at the five worst items per student, score only the reasoning box and score it pass/fail at a glance, and read the set as a class rather than as individual papers — sort the responses into piles by misconception. Five minutes of sorting tells you what to reteach tomorrow, which is the only real reason to collect them. If you are reading four boxes on every missed item for 150 students, you will stop doing this by October.

    Is there a free test corrections template?

    Yes — the two-page PDF linked on this page. Page 1 is the student sheet with three blocks of the four-box correction. Page 2 is a policy card to fill in and staple to the first test of the term, plus a sorting sheet for reading the set as a class. Free, printable, no email address required.

    What should a student actually write in the "why I put it" box?

    A sentence naming the belief that produced the wrong answer — "I thought the Senate confirmed treaties on its own" rather than "I rushed" or "careless mistake." Careless mistake is acceptable once per test. Written three times it is itself the finding, and worth a two-minute conversation. Students should also be allowed to argue: if the box says the item was ambiguous and they are right, give the points back. A correction process in which the teacher is never wrong is one students will correctly read as theatre.

    Sources

    1. Metcalfe, Janet. “Learning from Errors.” Annual Review of Psychology, vol. 68, 2017, pp. 465–489. Review concluding that error avoidance “appears to be the rule in American classrooms” and that errorful learning followed by corrective feedback is beneficial; that corrective feedback “including analysis of the reasoning leading up to the mistake” is crucial; and recommending that educators allow students to commit and correct errors in low-stakes situations. A review of laboratory evidence, not a classroom trial. https://www.annualreviews.org/content/journals/10.1146/annurev-psych-010416-044022
    2. Metcalfe, Janet, and Bridgid Finn. “People’s Hypercorrection of High-Confidence Errors: Did They Know It All Along?” Journal of Experimental Psychology: Learning, Memory, and Cognition, vol. 37, no. 2, 2011, pp. 437–448. Three experiments, 25–45 participants each. High-confidence errors corrected at roughly 82% on the final test; overall recall with feedback about 70%; correction without feedback roughly 4%. College undergraduates answering general-knowledge questions in a laboratory, not secondary students on a unit test. https://pmc.ncbi.nlm.nih.gov/articles/PMC3079415
    3. Maier, Ulrich, and Christian Klotz. “Students Ignore Their Mistakes: Elaborated Error Feedback Processing in a Digital Learning System.” Contemporary Educational Psychology, vol. 82, 2025, article 102395. Observational log analysis of 20,058 formative assessment cases from 2,826 students across 182 secondary classrooms, grades 5–11, 2020–2024. Error feedback opened in 44% of cases; median one error item reviewed; 51% of available errors reviewed on average; prior knowledge the strongest predictor of feedback seeking. Observational, German secondary schools, a digital grammar application rather than a paper test. https://www.sciencedirect.com/science/article/pii/S0361476X25000608
    4. Soicher, Raechel N., and Regan A. R. Gurung. “Do Exam Wrappers Increase Metacognition and Performance? A Single Course Intervention.” Psychology Learning & Teaching, 2017, pp. 64–73. 86 students randomly assigned to exam wrappers, sham wrappers, or control. No improvement in exam performance, final grades, or Metacognitive Awareness Inventory scores; MAI rose in all conditions including control. University students, single course. https://liberalarts.oregonstate.edu/biblio/do-exam-wrappers-increase-metacognition-and-performance-single-course-intervention
    5. Rice, Bethany S. “How Extra Credit Quizzes and Test Corrections Improve Student Learning While Reducing Stress.” ASEE 127th Annual Conference & Exposition, 2020. Average exam scores rose 5% (2018) and 3% (2019) when corrections were offered; 80% of students participated; survey responses strongly favourable. Cited as a descriptive classroom report, not a controlled study: no comparison group, 31 survey respondents, university engineering technology students. https://peer.asee.org/how-extra-credit-quizzes-and-test-corrections-improve-student-learning-while-reducing-stress.pdf
    6. McDade, Margaret. “Using Test Corrections as a Learning Tool.” Edutopia, George Lucas Educational Foundation. A high school math teacher’s small-group correction routine, with retesting for full credit rather than partial credit on corrections. Cited as practice knowledge: the article reports a teacher’s own method and cites no studies. https://www.edutopia.org/article/test-corrections-high-school-math/

    About Clay Shumate

    Clay Shumate is a certified secondary Social Studies teacher in the public schools of West Alabama, with seven years of classroom experience, a B.A. in History, and an M.Ed. in Secondary Education. He writes about project-based learning, student responsibility, respect, and practical ways to hold young people to a higher standard while giving them room to learn from mistakes. He is a member of the Society of Professional Journalists and writes to its Code of Ethics; this site’s editorial standards and corrections policy are published in full. More about Clay.

  • Late Work Policy: What the Evidence Supports After the Famous Study Was Retracted

    Late Work Policy: What the Evidence Supports After the Famous Study Was Retracted

    By Clay Shumate

    A late work policy decides two separate things: what happens to the grade, and what happens to the student. Most policies collapse those into one number and then stop working. The evidence does not hand you a clean answer, and the study most often quoted in these arguments was retracted in September 2026 — which is the first thing anybody writing a policy this year should know.

    Below is what the research actually supports, what it does not, and a six-part policy you can write on one page and still defend in a parent meeting.

    Key Takeaways

    • The famous deadline study is gone. Ariely and Wertenbroch’s 2002 paper on spaced deadlines was retracted on 2 September 2026. A 124-person replication found no effect of deadline condition on any outcome measure.
    • Loosening grading has not been shown to help students. Students assigned to stricter-grading teachers scored higher in math — in that class and in later ones — across every subgroup studied.
    • Removing late penalties has a measured cost. In one high school chemistry class, homework completion fell by more than a third.
    • The zero is a math problem before it is a policy problem. On a 100-point scale, the gap between passing grades is 10 points and the gap from D to F is 60.
    • The deeper issue is the scale and the averaging, not the zero. Research supports grading scales with four to seven levels for reliability; the 100-point scale invents precision that is not there.
    • Separate the grade from the behavior. Report lateness as conduct and let the grade report what the student knows. That one move resolves most of the argument.

    Free Download · PDF

    The One-Page Late Work Policy and Window Log (2 pages)

    Page 1 is the six-part policy to fill in, the practice-versus-assessment split, and the sentence to give a parent. Page 2 is the window log that turns the policy into information, plus the honest cost of all three common policies.

    Download the free PDF

    Free. No email address required. Designed for grades 6–12. Browse every printable in Your Free Library.

    Why Is a Late Work Policy So Hard to Get Right?

    Because a grade is being asked to do two jobs at once, and they conflict.

    Job one is reporting what a student knows and can do. Job two is enforcing a deadline. A 10-percent-per-day deduction does job two by corrupting job one: after five days the number on the report card is half knowledge and half calendar, and nobody reading it — not the next teacher, not a parent, not the student — can tell which half is which.

    A zero does job two harder and job one worse. And the people on the other side of the argument are not making a soft case. The claim that deadlines do not matter has a measured cost attached, which is the part that usually goes missing in articles about this.

    So the honest version of the problem is not “should kids face consequences.” It is: how do you keep the deadline real without making the grade lie?

    Four evidence findings on late work policy: stricter grading linked to higher math scores and a one-third drop in homework completion when late penalties were removed, a small undergraduate trial where an early-bonus plus late-penalty policy produced work 1.45 days early, the arithmetic problem of a zero on a 100-point scale, and the September 2026 retraction of the Ariely and Wertenbroch deadline study
    Four findings that do not all point the same way. That is the honest picture.

    What Does the Research Actually Say About Deadlines?

    Less than you have been told, and one widely quoted finding has been formally withdrawn.

    For twenty years, the standard citation for “students do better with evenly spaced interim deadlines” has been Ariely and Wertenbroch (2002) in Psychological Science. You have probably read it quoted in a PD slide deck. It was retracted on 2 September 2026.

    The retraction is not a technicality. Data Colada’s analysis of Study 2 found eighteen of twenty participants in one condition had exact duplicates across all three tasks, correlations that should have been strong were absent, and self-reported times showed almost none of the rounding that real human responses show. Their conclusion was that the data were “severely tampered with or fabricated.” Coauthor Klaus Wertenbroch stated that “much or all of the data — and therefore the results — are false.”

    A pre-registered replication by Hyndman and Bisin, published in 2025 with 124 participants across three deadline conditions, found no statistical evidence that performance was influenced by the deadline condition on any of three measures — errors found, days late, or payment, all p > 0.1. The original had reported all differences significant at p < 0.01. The replication authors concluded that the received wisdom about spaced deadlines limiting procrastination is “possibly false.”

    Two things follow. First, if your department’s late work policy was built on that study, it needs a different foundation. Second — and this is the part worth holding onto — the retraction says nothing about whether deadlines matter in a classroom. It says one famous laboratory result about self-imposed versus imposed deadlines cannot be relied on. Interim checkpoints on a long project may still be good practice. They just are not evidence-backed in the way everyone has been saying.

    Does Removing Late Penalties Hurt Students?

    There is real evidence that looser grading costs something, and it deserves to be stated as plainly as the case for reform usually is.

    Gershenson’s work on high school math found that students with tougher-grading teachers scored higher in math, both in that teacher’s class and in subsequent math courses, and that this held across every student subgroup. Figlio and Lucas found the same direction at elementary level: students assigned to stricter graders showed greater test-score growth in reading and math. In one high school chemistry class where late penalties were removed, homework completion dropped by more than a third.

    The strongest single trial on late policies specifically is small and not from a high school. Korpusik, Freitas and Dionisio compared four late policies across 248 lab submissions in an introductory programming course. Work came in 2.43 days late under no policy, 4.71 days late under an early-completion bonus alone, 0.44 days late under a late penalty, and 1.45 days early under a combined early bonus and late penalty — which also produced the highest grades. Their read was that late penalties externally regulate students who have not yet regulated themselves.

    Size that evidence honestly before you use it: 31 students who consented to the analysis, mostly first-years, taught online during the pandemic. It is a signal, not a mandate. But it points the same direction as the grading-strictness work, and a teacher who ignores both because the conclusion is unfashionable is doing the thing this site complains about when it goes the other way.

    Does It Matter What the Assignment Was For?

    More than any other question here, and most policies never ask it.

    If the work was practice — a problem set, a draft, a reading check whose job was to tell you what to reteach — then late is a timing failure with a real instructional cost, because the information arrived after you needed it. The honest response is to collect it, use it, and record the lateness as conduct. Scoring it down does not recover the information.

    If the work was the assessment — the essay, the project, the unit test — then the deadline is doing something different. It is the point at which you are claiming to know what the student can do. Here a window still makes sense, but a narrow one, and after it closes the student demonstrates the standard some other way rather than handing in the same artifact in December.

    Running one blanket rule over both is why so many late work policies feel wrong in practice. A missing formative check and a missing final project are not the same event and should not get the same sentence.

    So Why Not Just Give Zeros?

    Because of arithmetic, not sentiment.

    Reeves laid this out in Phi Delta Kappan. On a standard 100-point scale with letter grades at 10-point intervals, every passing grade sits 10 points from its neighbor — and the interval between D and F is not 10 points but 60. A single zero therefore carries roughly six times the weight of any other failing mark in an average. Reeves’s point is that if an F is one interval below a D, the mathematically consistent value is 50, not 0. On a 4-point scale nobody hesitates: missing work gets a 0, exactly one point below a 1. The same logic on a 100-point scale would require a –6, which no one would give.

    Guskey, Fisher and Frey take that further in Educational Leadership, and their version is the one to carry into a faculty meeting: “The true problem is not the zero; it’s the use of the 100-point percentage grading scale and the practice of averaging scores.” They point out that the problems with percentage scales have been documented since Starch and Elliott in 1913, and that research supports scales with four to seven levels for optimal reliability and discrimination. A 101-level scale manufactures precision nobody can actually defend.

    That reframing matters for a late work policy because it tells you where the real fix is. Arguing about whether a missed assignment is a 0 or a 50 is arguing about a symptom. If your gradebook averages percentages across a semester, a single missed assignment distorts the picture no matter which number you put in the box.

    If this is live at your school, the fuller version of that argument is in the standards-based grading guide, and the honest case against it is in why standards-based grading doesn’t work. Both are worth reading before anyone proposes a schoolwide change.

    Comparison of three common late work policies with honest costs: a zero after the due date, ten percent off per day late, and full credit with no deadline, each listed with what it is honest about and what it costs
    None of these is free. The question is which cost you can live with.

    What Does a Workable Late Work Policy Look Like?

    Six parts. It fits on one page, and every part of it survives a parent asking why.

    Six numbered components of a workable late work policy: state what the deadline is for, set a hard floor instead of a zero, separate the grade from the behavior, publish one window and hold it, make the make-up cost time rather than points, and record which students keep using the window
    Six parts, and the sixth one turns the policy into information.

    1. Say what the deadline is for

    “This is due Friday because on Monday we build on it” is a reason. “Because I said Friday” is not, and teenagers are unusually good at telling the difference. A deadline with a downstream purpose gets taken seriously by more students than a deadline without one, and it also tells you which deadlines you should actually defend. If nothing depends on Friday, Friday was arbitrary and you should stop pretending otherwise.

    2. Set a hard floor, not a zero

    A missed assignment scores the bottom of the scale, not the bottom of the number line. On a four-point scale that is a 0. On a 100-point scale it is a 50. The point is not generosity; it is that the floor should be one interval below the lowest passing mark, which is what every other grade boundary already is.

    3. Separate the grade from the behavior

    This is the move that resolves most of the argument, and it costs nothing. Lateness is a conduct fact. Report it as one — a comment on the report, a contact home that happens the same week, a scheduled session — and let the grade report what the student knows. A parent who is told “she understands this material and she has turned in four assignments late” has two usable pieces of information. A parent told “she has a 61” has none.

    4. Publish one window and hold it

    “Late work is accepted until the unit assessment” is a rule a fourteen-year-old can plan against. “Depends when you ask me” is not a policy, it is a mood, and students read inconsistency as unfairness faster than they read strictness as unfairness. Pick a window, write it in the syllabus, and then do exactly what you said — which is the whole of respecting students in practice rather than on a poster.

    5. Make the make-up cost time, not points

    Being late should cost something. Time is the honest currency: a scheduled session at lunch, before school, or during an intervention block. It is a real cost, students feel it, and it leaves the grade intact. A ten-percent-per-day deduction costs them something too — the accuracy of the transcript.

    6. Write down who keeps using the window

    Keep a list. Not to punish with — to read. Three students using the late window every single time is not a late work problem, it is a signal about workload, home, organization, or something nobody has asked about yet. A policy that generates that list is doing a second job for free. A policy that just applies a deduction tells you nothing you did not already know. This is the same logic as treating attendance data as a referral system rather than a compliance record. The same read applies to arrival times, where a tiered response sorts the one-off from the pattern in a way a blanket deduction never will.

    One cost this policy does carry, and it should be named rather than buried: an open window produces a flood at the end of it. If the window closes at the unit assessment, expect a stack the night before, and expect it to arrive in the same week you are marking the assessment itself. Two things keep that survivable. Cap what comes back — late work gets a score and a one-line comment, not the full written feedback a punctual draft gets, and say so in advance. And put the make-up session mid-unit rather than at the end, so the work trickles in instead of arriving at once. A policy that quietly doubles your marking in the last week of a unit is a policy you will abandon by Thanksgiving, which is its own kind of unfairness. The workload side of this is not a side issue; it decides whether the policy still exists in March.

    What Does This Look Like From the Student’s Side?

    Clear, and askable in advance. Those are the two things students actually want from a late work policy, and neither is the same as lenient.

    Clear means they can find it. Not buried in a syllabus they signed in August — posted, in nine words, where the due dates are. A student should be able to answer “what happens if I turn this in Monday” without asking you.

    Askable in advance means the policy has a front door. A fifteen-year-old working a closing shift, or watching younger siblings, or without reliable internet at home, usually knows on Tuesday that Friday is not going to happen. Right now most classrooms give that student nothing to do with that knowledge except apologize on Friday. Say out loud, more than once, that asking before a deadline is a different conversation than explaining after one — and then make it true, which means the student who asks on Tuesday gets a straight answer rather than a lecture.

    That is not softness. It is the difference between treating a teenager as someone managing competing obligations, which they are, and treating them as someone who needs catching out. The deadline does not move for the student who never asks. It is just that the student who plans ahead gets something for planning ahead, which is the behavior the whole policy claims to be teaching.

    How Do You Explain This to a Parent Who Thinks It Is Too Soft?

    Lead with what did not change, because something did not.

    The work is still required. The deadline is still real. There is still a consequence, and it is time rather than points. What changed is that the report card now tells you what your child knows instead of telling you a blend of what they know and when they handed it in.

    That sentence survives most objections because it is not a concession, it is a clarification. And it is worth having ready in writing — in the syllabus and in the first message home — rather than improvised on the phone in October. Parents who object to no-zero policies are usually objecting to the version where nothing is required; the fastest way to settle it is to show this is not that version.

    There is a fair version of the objection too, and it should not be waved off. If a student can turn anything in whenever they like, some will discover that and use it, and a policy that pretends otherwise is not being honest. That is precisely why parts 4, 5 and 6 exist: a published window, a real cost in time, and somebody actually watching the list.

    What Does This Mean for a Department or a School?

    Consistency across a hallway matters more than the specific policy chosen.

    A student with six teachers running six different late policies cannot plan, and the student least able to absorb that is the one the policy was supposed to help. If a department can agree on a window and a floor, that is worth more than any individual teacher’s preferred version of either.

    Two cautions for anyone proposing this above the classroom level. A policy that requires teachers to accept unlimited late work without additional marking time is a workload decision disguised as a grading decision, and it will be abandoned by March. And a schoolwide floor applied on top of a 100-point averaging gradebook is, by Guskey, Fisher and Frey’s argument, treating the symptom — worth doing, but not worth calling a reform.

    Two constraints sit above everything on this page, and both of them outrank it.

    Your district may already have a grading policy with the force of board approval. A teacher who unilaterally sets a 50 floor in a district whose policy says otherwise has a problem that has nothing to do with pedagogy. Read the policy before writing yours, and if the two conflict, that is a conversation with an administrator rather than a decision to make quietly in a gradebook.

    And an IEP or 504 plan governs. If a student’s plan includes extended time or modified deadlines, the plan is the policy for that student, full stop — no classroom rule and no research finding on this page overrides it. Build your policy so that honoring a plan looks like the ordinary case rather than a visible exception, which mostly means making the window generous enough that nobody has to be singled out to use it.

    What to Do Next

    Write the policy on one page before the next unit starts. One window. One floor. One sentence saying lateness is reported as conduct, not deducted from the grade. One line about what the make-up session is and when it runs.

    Then put it in the syllabus and in a message home the first week, so that the first time a family hears about it is not after a missed assignment.

    And keep the list. At the end of the first unit, look at who used the window and how often. That list will tell you more about your classroom than the policy itself does.

    Before you go: grab the free The One-Page Late Work Policy and Window Log (2 pages) (PDF) — ElevateTheNorm.com branded, printable, no email required.

    Frequently Asked Questions

    Is it true that the study everyone quotes about deadlines was retracted?

    Yes. Ariely and Wertenbroch’s 2002 paper in Psychological Science on spaced deadlines and procrastination was retracted on 2 September 2026, after analyses found duplicated observations, missing expected correlations and implausible response patterns in Study 2. One of the coauthors stated that “much or all of the data — and therefore the results — are false.” A 2025 replication with 124 participants found no significant effect of deadline condition on any outcome. If a PD session or a department policy still cites that study, it needs a new basis. It does not mean deadlines are useless — it means that one famous laboratory result cannot be used as evidence.

    Is giving a 50 for work that was never done just a gift?

    It is a scale decision, not a generosity decision. On a 100-point scale every passing grade sits 10 points from the next, and the gap from D to F is 60 — so a zero carries about six times the weight of any other failing mark in an average. A floor at 50 makes the F one interval below the D, which is what every other boundary already is. The work is still missing, the student still has not demonstrated the standard, and the grade still shows a failure. What changes is that one missing assignment can no longer outweigh several completed ones.

    Can a teacher set a 50 floor if the district grading policy says otherwise?

    No, and this should be checked before anything on this page is implemented. Many districts have a board-approved grading policy, and a teacher who quietly overrides it in a gradebook has created a problem that is not pedagogical. Read the policy first. If it conflicts with what you believe is right, that is a conversation to have with an administrator, and the argument from grading-scale reliability is a strong one to bring to it — but it is a conversation, not a unilateral change.

    How does a late work policy interact with an IEP or 504 plan?

    The plan governs, without exception. If a student’s plan provides extended time or modified deadlines, that is the policy for that student and no classroom rule overrides it. The practical design point is to build the general policy so that honoring a plan looks ordinary rather than exceptional — a window generous enough that a student using it is not visibly marked out. If you are unsure how a plan applies to a specific assignment, ask the case manager before the deadline rather than after.

    Should practice work and assessments have the same late policy?

    No, and running one rule over both is why many late policies feel wrong in practice. Practice work — problem sets, drafts, reading checks — exists to tell you what to reteach, so when it arrives late the instructional cost is already paid and scoring it down recovers nothing. Collect it, use it, record the lateness as conduct. An assessment is different: the deadline is the point at which you claim to know what a student can do. Keep a window there too, but a narrow one, and after it closes have the student demonstrate the standard another way rather than submitting the same artifact months later.

    Won’t accepting late work bury me in grading?

    It can, and a policy that ignores that will not survive to March. Two things keep it manageable. Cap what comes back: late work gets a score and a one-line comment rather than the full written feedback a punctual draft earns, and say so in advance so it reads as a stated rule and not as neglect. And schedule the make-up session mid-unit rather than at the window’s close, so work trickles in instead of landing as a stack the night before the unit assessment.

    Does removing late penalties actually hurt students?

    There is real evidence that it costs something, and it should not be waved away. In one high school chemistry class, homework completion fell by more than a third when late penalties were removed. Separately, students assigned to tougher-grading teachers scored higher in math — in that class and in later courses, across every subgroup studied. None of this proves zeros are correct, and none of it is a randomized trial of a specific late policy. What it does say is that “no deadline, no consequence” is a position with measured costs, which is why the policy described here keeps a real cost and moves it from points to time.

    What should a student do if they know in advance they cannot meet a deadline?

    Ask before it, not explain after it — and the teacher’s job is to make that worth doing. A student working a closing shift or caring for siblings usually knows on Tuesday that Friday will not happen. Most classrooms give them nothing to do with that information. Say out loud, more than once, that a request made before a deadline gets a different conversation than an apology made after one, then honor it: a straight answer rather than a lecture. The deadline does not move for the student who never asks. Planning ahead is the behavior the policy claims to be teaching, so it should get something.

    Sources

    1. Retraction notice: Ariely, D., & Wertenbroch, K. (2002), “Procrastination, Deadlines, and Performance: Self-Control by Precommitment,” Psychological Science. Retracted 2 September 2026. The notice cites a replication study and Data Colada analyses that “raised questions about the underlying data” and “called into question the veracity of the overall findings.” Coauthor Wertenbroch is quoted: “much or all of the data — and therefore the results — are false.” https://retractionwatch.com/?p=135929
    2. Data Colada, post 138, on Study 2 of Ariely & Wertenbroch (2002). Eighteen of twenty participants in the Last Day Deadline condition had exact duplicates across all three proofreading tasks, with ID numbers ten positions apart; expected correlations were absent (original task-performance correlations +.03 to +.27 against +.74 to +.90 in replication); self-reported times showed 11.7% rounding against 85% in the replication. Conclusion: the data “were severely tampered with or fabricated.” https://datacolada.org/138
    3. Hyndman, K., & Bisin, A. (2025). Replication of Ariely & Wertenbroch (2002). 124 participants, three randomly assigned deadline conditions (none, evenly spaced, self-imposed), three proofreading tasks over three weeks. No statistically significant effect of deadline condition on errors found (F = 0.181), days late (F = 0.353) or payment (F = 0.215), all p > 0.1. https://bpb-us-e1.wpmucdn.com/wp.nyu.edu/dist/c/16384/files/2025/09/Ariely_Replication-1.pdf
    4. Korpusik, M., Freitas, J., & Dionisio, J. D. N. (2022). “Impact of Late Policies on Submission Behavior and Grades.” ASEE Annual Conference. Loyola Marymount University, introductory programming lab, 248 submissions, 31 students consenting to analysis, mostly first-years, taught online during the pandemic. Average submission timing: no policy +2.43 days, early incentive +4.71, late penalty +0.44, combined −1.45 days (early). Grades 94.2% / 96.6% / 97.1% / 99.5% respectively. Undergraduates, not grades 6–12 — the mechanism may transfer, the numbers do not. https://people.csail.mit.edu/korpusik/asee22.pdf
    5. Guskey, T. R., Fisher, D., & Frey, N. “The Unwinnable Battle Over Minimum Grades.” Educational Leadership (ASCD). Argues minimum-grade floors treat a symptom: “The true problem is not the zero; it’s the use of the 100-point percentage grading scale and the practice of averaging scores.” Cites Starch and Elliott (1913) on percentage-scale problems and Lozano et al. (2008) and Preston and Colman (2000) on four-to-seven-level scales producing optimal discrimination, validity and reliability. https://www.ascd.org/el/articles/the-unwinnable-battle-over-minimum-grades
    6. Reeves, D. B. (2004). “The Case Against the Zero.” Phi Delta Kappan, 86(4). The arithmetic argument: on a 100-point scale the interval between passing grades is 10 points while “the interval between the D and F is not 10 points but 60 points,” making the mathematically consistent value of an F 50 rather than 0. https://www.researchgate.net/publication/285846142_The_Case_against_the_Zero
    7. Thomas B. Fordham Institute. “Think Again: Does ‘equitable’ grading benefit students?” Cited as a review, not as the primary studies. This is where the grading-strictness findings above come from: Gershenson (2020) on high school math students with tougher-grading teachers scoring higher in that class and in later courses across all subgroups; Figlio and Lucas (2004) on elementary test-score growth; and the high school chemistry case in which removing late penalties cut homework completion “by more than one-third.” The review’s own position is that there is no hard evidence that more lenient grading benefits students long term — a contested claim, and presented here as the strongest version of the case against loosening a late work policy. https://fordhaminstitute.org/national/research/think-again-does-equitable-grading-benefit-students

    About Clay Shumate

    Clay Shumate is a certified secondary Social Studies teacher in the public schools of West Alabama, with seven years of classroom experience, a B.A. in History, and an M.Ed. in Secondary Education. He writes about project-based learning, student responsibility, respect, and practical ways to hold young people to a higher standard while giving them room to learn from mistakes. He is a member of the Society of Professional Journalists and writes to its Code of Ethics; this site’s editorial standards and corrections policy are published in full. More about Clay.

  • Gallery Walk Activity: How to Run One So the Feedback Is Worth Reading

    Gallery Walk Activity: How to Run One So the Feedback Is Worth Reading

    By Clay Shumate

    A gallery walk activity posts student work around the room and sends classmates around to read it and leave written feedback. The walking is not what makes it work. The peer assessment underneath it is the part with research behind it, and that research says it only pays off when students are told exactly what they are looking for before they stand up.

    What follows is what the evidence actually supports, the one study at the right grade level and why it is weaker than it looks, and a six-step version that produces feedback worth reading instead of thirty sticky notes that say “good job.”

    Key Takeaways

    • Peer assessment has real evidence. The gallery walk format does not, separately. A meta-analysis of 54 control-group studies put peer assessment at g = 0.31 on achievement, and at secondary level specifically, g = 0.44.
    • Peer assessment beat teacher assessment in that analysis (0.31 versus 0.28) and tied with self-assessment. It is not a second-best substitute for your own marking.
    • Attaching a grade to peer feedback helped university students and did not help school students. Keep the walk ungraded in grades 6–12.
    • Feedback is not automatically good. Across 607 effect sizes, feedback raised performance on average but made it worse in over a third of cases — mostly when it pointed at the person instead of the work.
    • The single highest-leverage change is naming one focus before students circulate. Open-ended walks produce praise, not information.
    • If nobody revises anything afterward, you ran a walking tour. The revision block is the lesson, not the extra.

    Free Download · PDF

    The Gallery Walk Planner (2 pages)

    Page 1 plans the walk: the four decisions, the three sentence stems, the access check and the two rules that keep it fair. Page 2 runs it: the six steps in order, a student revision slip, and the four failure modes with their fixes.

    Download the free PDF

    Free. No email address required. Designed for grades 6–12. Browse every printable in Your Free Library.

    What Is a Gallery Walk Activity?

    It is a critique protocol: student work goes up on the walls or tables, students circulate in small groups, and each group leaves written feedback on what it sees. Then the authors read their feedback and change something.

    That last clause is the one teachers drop, and it is the one that turns the activity into instruction. Everything before it is logistics.

    The format is flexible in the ways that do not matter much and rigid in the one way that does. It works with drafts, lab write-ups, solved problems, design sketches, annotated sources, project prototypes. It works on paper taped to a wall or on a shared digital board. What it does not work without is a stated thing students are supposed to judge.

    Does a Gallery Walk Activity Actually Improve Learning?

    The peer assessment inside it does. The format itself has almost no rigorous evidence, and that is worth saying out loud because most articles about gallery walks imply otherwise.

    Double, McGrane and Hopfenbeck published a meta-analysis of peer assessment in Educational Psychology Review covering 54 experimental and quasi-experimental control-group studies. The overall effect on academic performance was g = 0.31 — small to medium, and statistically significant. Peer assessment outperformed no assessment and outperformed teacher assessment (g = 0.28). It showed no advantage over self-assessment.

    Two details in that analysis matter more for a grades 6–12 classroom than the headline number.

    First, the effect at secondary level was higher than the average: g = 0.44 across 13 studies. That runs against the usual pattern on this site, where secondary tends to be the weakest band in cooperative-learning research. Second, the effect held up across implementation choices — online or in person, anonymous or named, frequent or occasional, trained or untrained. None of those moderators came out significant. That is good news for a teacher deciding whether to buy clipboards: the fiddly choices are not where the result lives.

    There was one moderator that did split, and it splits against school students. Peer feedback that carried a grade significantly helped university students (g = 0.55). The same effect could not be shown for primary or secondary students. Do not grade the sticky notes.

    Three-part evidence summary comparing well-evidenced peer assessment at g equals 0.31 overall and 0.44 at secondary level, thin evidence for the gallery walk format itself from one Grade 8 study with no control group, and the finding that feedback made performance worse in over a third of cases
    Two different claims get mixed together. Only one of them is well supported.

    What About Research on Gallery Walks Specifically?

    Thin, and the one study at the right grade level found less than its abstract suggests.

    The closest match is a 2023 study of 198 Grade 8 students at a public high school in the Philippines, measuring knowledge, interest and attitude across three social studies lessons taught through gallery walk activities. It is a genuine secondary-level sample, which almost nothing else in this literature is.

    It is also a one-group pre-test/post-test design with no control group. Students gained on the researcher-made test — mean gained scores of 7.88, 8.15 and 8.01 across the three lessons — but with no comparison class, there is no way to separate the gallery walk from three weeks of teaching. More pointed: when the researchers correlated the specific features of how the walk was implemented against outcomes, none of the correlations with cognitive skills were significant, and none of the correlations with interest were significant either. Only attitude moved reliably.

    So the honest summary is: students liked it, and this study cannot tell you whether it taught them anything. Most of the remaining gallery-walk literature is small single-classroom work outside the United States, often in language instruction, and frequently without a control group either.

    The best-known practitioner guide, from PBLWorks, is also worth reading accurately. It describes a protocol and reports that giving participants a specific focus and criteria “helps generate higher-quality feedback,” while open-ended walks produced superficial comments like “good DQ!” That is a credible observation from people who run these constantly. It is not a study, and the article cites none. It should be quoted as what it is.

    None of this means skip the activity. It means the reason to run it is the peer assessment evidence, and the way to run it should be built to make that peer assessment real.

    Why Does Feedback Sometimes Make Students Worse?

    Because a lot of feedback is about the student instead of the work, and that redirects attention away from the task.

    Kluger and DeNisi’s review of feedback interventions remains the uncomfortable finding in this whole area. Across 607 effect sizes and 23,663 observations, feedback raised performance on average, d = 0.41. But in over a third of cases it lowered performance. Their explanation is that when feedback draws attention to the self rather than the task, the recipient spends their effort on defending themselves rather than improving the thing.

    Anybody who has watched a fifteen-year-old read a comment on their essay knows what that looks like. “This is confusing” is a verdict on a person. “I couldn’t find your claim in the second paragraph” is information about a page. The second one gets acted on; the first one gets argued with.

    That is also why the sentence stems matter more than they sound like they should. “I notice…” and “I wonder…” are not politeness training. They are a grammatical trick that forces the comment to describe the work. The EL Education framing that runs through a lot of critique practice — feedback should be kind, specific and helpful — is making the same move from a different direction, and the people who use it are explicit that it depends on an existing culture. As Ron Berger puts it in that work, this is not a strategy you drop into a classroom without a respectful one already in place.

    That is a real precondition, not a throat-clearing caveat. A gallery walk in a room where students are not already being treated decently by each other and by you produces insults on sticky notes, and you will spend the period on discipline instead of drafts.

    How Do You Run a Gallery Walk That Produces Useful Feedback?

    Six steps. Five of them cost nothing; the sixth costs ten minutes of class time and is the one that makes the other five worth doing.

    Six numbered steps for running a gallery walk activity: name the one thing students look for, hand out criteria before they walk, require written feedback, give descriptive sentence stems, put a clock on each station, and build in revision time
    None of these adds a planning period. The last one is the one that gets cut.

    0. Model it once, on one piece of work, before anybody walks

    Put a single piece of work up on the projector — ideally one of yours, or an anonymous sample from a previous year — and have the whole class write one note about it together. Then read three of their notes aloud and say plainly which one is useful and why. That takes eight minutes and it is the difference between a protocol students understand and a protocol they are performing. Skipping it is the most common reason a first gallery walk falls flat, and it is also the thing a coach watching your room will ask about first.

    1. Name one thing they are looking for

    Not “give feedback.” One focus: content accuracy, or evidence quality, or whether the claim is actually answerable. If you name three, you get one sentence about the easiest of the three. This single decision is what separates a walk that generates information from a walk that generates compliments.

    2. Hand over the criteria before they walk, not after

    Students should be holding the same rubric you will grade against while they circulate. Giving it to them afterward turns peer feedback into a guessing game about what you wanted. If you do not have a rubric for this task yet, three success criteria written on the board will do.

    3. Require it in writing

    Spoken feedback evaporates at the bell. Sticky notes work. So does a feedback slip per station, or a shared document with a row per project. The requirement is that the author can read it later, because step six depends on that.

    4. Give stems that describe rather than judge

    Post three and require them: I notice… / I wonder… / One thing that would strengthen this is… Teenagers will write “nice” if you let them, and they will write something sharper than you expect if you make the sentence start with a verb that forces specificity.

    5. Put a clock on each station

    Two or three minutes, then rotate on a signal. Without a timer the quick groups finish in forty seconds and the room drifts, which is a transition problem dressed up as a behavior problem. A posted rotation order prevents the traffic jam at station one. My Station Rotation Toolkit on TPT has eight reusable station frames, signs, and recording sheets if you would rather not build them.

    6. Build in the revision

    Ten minutes at the end: read your notes, pick one change, make it. Not “consider the feedback.” Pick one, make it, and be ready to say what you changed and why. This is the step that gets cut when the period runs long, and cutting it is what turns a critique into a field trip around your own classroom.

    One more thing belongs in that ten minutes, and it is the part students care about most: they do not have to take the advice. Some peer feedback is confidently wrong. A student who reads “your thesis is unclear” from someone who skimmed two sentences is entitled to decide that note is not useful. The requirement is that they can say which note they acted on and why, or which note they rejected and why. Both are evidence of judgment, which is the actual skill being taught. A protocol that forces a student to obey bad advice is teaching the opposite of what peer assessment is for.

    Whose Work Goes on the Wall?

    This is the question a parent asks first, and most guides to this activity never raise it.

    Putting a student’s work in front of thirty classmates is not a neutral act. For the student who knows their draft is the weakest in the room, a gallery walk can be the worst twenty minutes of their week, and no amount of “I wonder…” stems fixes that by itself.

    Three things keep it fair. First, everything goes up, every time — a walk where only the strong work is displayed is a showcase, and students read the selection as the verdict. Second, do not use personal writing. Narrative and reflective pieces where a student has written about their own life do not belong on a wall; use the analytical task, the lab, the problem set, the project artifact. Third, let a student put work up unnamed if they ask. Peer assessment effects in the meta-analysis held up whether feedback was anonymous or not, so you are giving away nothing that the research says you need.

    If a family asks why their child’s work was displayed, the answer should be a sentence you already have: everyone’s work goes up, nobody’s name has to, and nothing personal is ever used. Worth putting in a back-to-school message the first time you run it, rather than after a phone call.

    What Goes Wrong, and How Do You Tell It Is Your Structure?

    Four failure modes cover almost all of it, and all four are things you set up rather than things students did.

    Four numbered failure modes of a gallery walk activity: no focus so no substance, feedback aimed at the person rather than the work, no revision after the walk, and running critique before the classroom culture can support it
    Every one of these is a structure problem, not a student problem.

    The first is no focus, which produces “good job” and a smiley face. Students are not being lazy. They have not been told what to judge, so they default to the safest comment available.

    The second is feedback aimed at the person. See above. The fix is mechanical — stems, and a rule that every note names a specific part of the work.

    The third is no revision, which is the most common and the most expensive. If the notes go into a backpack, the walk taught judgment to nobody and cost you a period.

    The fourth is running it too early. Critique is a high-trust activity. In a room where that trust is not there yet, start with something lower stakes — structured peer response on a single paragraph at their desks, with you reading over shoulders — and build toward the full walk over a few weeks.

    Two practical notes, because the guides tend to skip both. Prep is roughly ten minutes — deciding the focus, writing three criteria, and finding the sticky notes. There is no packet to build, which is a large part of why this protocol survives in real classrooms. And the student who has nothing to post is an ordinary Tuesday, not a crisis. They post what exists, even if it is a title and two sentences, and they do the walk and give feedback like everybody else. Giving feedback is most of the cognitive work in this activity anyway. Exempting them from the one part they can still do teaches them that the room has stopped expecting anything from them.

    Where Does This Fit in a Unit?

    Mid-draft, not at the end. A gallery walk on finished work is a showcase, which is a fine thing but a different thing. The activity earns its period when the work is still changeable.

    In a project, the natural slot is the day the first full draft exists and before any of it is graded. The critique and revision tools in a PBL toolkit are built around exactly that moment. In a writing unit, it is after the first full draft and before the revision conference. In a problem-based math or science lesson, it is after groups have committed to an approach and before they have invested two days in it.

    One per unit is plenty. Run it weekly and it becomes the thing students perform rather than the thing they use, which is the same failure mode that eventually catches every student-centered routine that gets over-used.

    Does This Work in a Class of Thirty-Five?

    Yes, and it is one of the few protocols that gets easier as the class gets bigger, because it runs in parallel.

    Eight or nine stations, groups of four, three minutes each, and the whole room is working at once. The constraint is wall space and traffic flow, not headcount. If the room is tight, put work flat on desks and rotate groups between desk clusters instead of around the perimeter — same protocol, less collision.

    Where class size does bite is the revision block. Thirty-five students each wanting to ask you about one piece of feedback does not fit in ten minutes. The answer is that they do not ask you. They pick one change and make it. You circulate. The ones who are genuinely stuck will find you.

    Access is worth planning for rather than improvising. A student who reads well below grade level cannot absorb six peers’ drafts in three minutes, and a student newer to English may be able to judge the work and not able to write the note quickly. Both are solved the same way: let feedback be spoken to a partner who writes it, or give a sentence frame with the technical words already in it. Neither reduces the demand — the judgment is still theirs — and both stop the activity quietly sorting the room by reading speed.

    What to Do Next

    Pick a task you already have, where the work is half-finished and you were going to collect it anyway. Decide the one thing students will look for. Write three success criteria on the board. Give them sticky notes, three sentence stems and three minutes a station, and reserve the last ten minutes of the period for one change each.

    Do not grade it. The research says the grade does nothing for students this age, and the moment it is graded you are back to students writing what they think you want to read.

    Then look at the revisions rather than the sticky notes. The sticky notes tell you how well you set up the protocol. The revisions tell you whether anybody learned anything, which is the only question that matters.

    Before you go: grab the free The Gallery Walk Planner (2 pages) (PDF) — ElevateTheNorm.com branded, printable, no email required.

    Frequently Asked Questions

    Is there actual research behind the gallery walk activity, or just blog posts?

    Both, and they are not the same strength. The peer assessment that happens inside a gallery walk is well evidenced: a meta-analysis of 54 control-group studies found g = 0.31 on academic performance, rising to g = 0.44 at secondary level. The gallery walk format is a different claim, and the evidence there is thin. The closest study at the right grade level followed 198 Grade 8 students but had no control group, and found no significant relationship between how the walk was run and students’ knowledge gains or interest. Run the activity for the peer assessment, and build it so the peer assessment is real.

    How do you keep a gallery walk from humiliating the student whose work is weakest?

    Three rules handle most of it. Everyone’s work goes up every time — a wall of selected work tells the room exactly who was selected. Never use personal or narrative writing; use the analytical task, the lab, the problem set or the project artifact. And let a student display work without their name if they ask for that. Anonymity was not a significant moderator in the peer assessment research, so you lose nothing measurable by allowing it. If a student still refuses, take it privately rather than in front of the room.

    Should peer feedback on a gallery walk be anonymous or signed?

    Either works, and you can decide it on classroom grounds rather than research grounds. In the Double, McGrane and Hopfenbeck meta-analysis, anonymity was one of several implementation choices that showed no significant difference in effect. Signed notes tend to be more careful and let the author follow up with a question; anonymous notes tend to be more honest early in the year. A reasonable default is signed, with the caveat that you will read them.

    Should you grade the feedback students give?

    No, not in grades 6–12. The one place the research splits by age is exactly here: peer feedback carrying a grade significantly improved university students’ performance, and that effect could not be shown for primary or secondary students. Grading it also changes what students write — they start producing what they think you want rather than what they noticed. Hold them accountable for completing it, not for a score on it.

    What if a student gets feedback that is simply wrong?

    They are allowed to reject it, and saying so out loud is part of the lesson. Require that every student can name one note they acted on and why, or one note they decided not to act on and why. Both answers show judgment, which is the skill peer assessment is supposed to build. A protocol that makes a student obey bad advice from a classmate is teaching compliance, not critique.

    How long does a gallery walk take, and how much preparation?

    One class period, and about ten minutes of prep. The prep is deciding the single focus, writing three success criteria, and finding sticky notes — there is no packet to build. In the period, allow eight minutes to model the protocol the first time, two to three minutes per station, and a protected ten minutes at the end for revision. If the period is short, cut the number of stations, never the revision block.

    What do you do when a student writes something unkind on a note?

    Collect it, handle it privately, and do not re-run the whole protocol as a punishment for the class. Then look at what made it possible: unkind notes are far more common when the focus was vague, because “say something about this” invites personal commentary while “find the claim and say whether the evidence supports it” does not. Critique also depends on an existing classroom culture — if the room is not there yet, scale back to partner feedback at desks and build up to the full walk.

    How do you know whether the gallery walk actually taught anything?

    Look at the revisions, not the sticky notes. The notes tell you how well you set up the protocol; the changes students made tell you whether the feedback was understood and used. A quick version: collect the one-sentence statement of what each student changed and why. If most of them name a surface change — spelling, formatting, length — the focus you set was too broad and the next walk needs a narrower one.

    Sources

    1. Double, K. S., McGrane, J. A., & Hopfenbeck, T. N. (2019). “The Impact of Peer Assessment on Academic Performance: A Meta-analysis of Control Group Studies.” Educational Psychology Review, 32. Meta-analysis of 54 experimental and quasi-experimental control-group studies; overall g = 0.31 (p < .001) on academic performance; peer assessment outperformed no assessment and teacher assessment (0.28) and was comparable to self-assessment; effects robust across delivery mode, frequency and educational level. https://ora.ox.ac.uk/objects/uuid:0a09975c-e7e6-416f-b888-977230b29ba4
    2. Clearinghouse Unterricht (TUM), Short Review 28 on Double et al. (2020). Cited as a summary, not as the primary study. This is where the secondary-level figure used above comes from — g = 0.44 across 13 studies — together with the moderator finding that peer feedback carrying a grade significantly helped university students (g = 0.55) but could not be shown to help primary or secondary students. https://www.clearinghouse.edu.tum.de/wp-content/uploads/2023/10/CHU-KR-28_ENG_Double_2020.pdf
    3. “Gallery Walk Activities in Teaching Social Studies: Inputs in Enhancing Knowledge, Interest, and Attitude of Grade 8 Students” (2023). International Journal of Research Publications. 198 Grade 8 students, Philippines. One-group pre-test/post-test and correlational design with no control group. Mean gained scores 7.88 / 8.15 / 8.01 across three lessons; correlations between implementation features and cognitive skills were not significant, and correlations with interest were “not significant at 0.05 level”; only attitude correlations reached significance. https://ijrp.sfo3.cdn.digitaloceanspaces.com/pubjournal/5094/1001281720235215.pdf
    4. PBLWorks / Buck Institute for Education. “Using Gallery Walks for Critique & Revision in PBL.” Practitioner protocol. The claim that a specific focus and criteria produce higher-quality feedback is reported by the authors as their own experience — “We’ve found” — and the article cites no studies. Quoted here as practice knowledge, not as research. https://www.pblworks.org/blog/using-gallery-walks-critique-revision-pbl
    5. Kluger, A. N., & DeNisi, A. (1996). “The Effects of Feedback Interventions on Performance: A Historical Review, a Meta-analysis, and a Preliminary Feedback Intervention Theory.” Psychological Bulletin, 119(2). 607 effect sizes across 23,663 observations; average d = 0.41; feedback interventions reduced performance in over a third of cases. The primary article was not reachable from this session; the figures above are taken from a secondary summary of it and are labelled as such. https://explore.psychsafety.com/n/kluger-denisi-1996/
    6. Varlas, L. (2017). “Peer Feedback Without the Sting.” Educational Leadership (ASCD), May 2017. Source of the “kind, specific, helpful” framing attributed to Ron Berger of EL Education, and of the point that peer critique depends on existing classroom culture rather than on the protocol alone. https://www.ascd.org/el/articles/peer-feedback-without-the-sting

    About Clay Shumate

    Clay Shumate is a certified secondary Social Studies teacher in the public schools of West Alabama, with seven years of classroom experience, a B.A. in History, and an M.Ed. in Secondary Education. He writes about project-based learning, student responsibility, respect, and practical ways to hold young people to a higher standard while giving them room to learn from mistakes. He is a member of the Society of Professional Journalists and writes to its Code of Ethics; this site’s editorial standards and corrections policy are published in full. More about Clay.

Teacher Emergency Toolkit — practical resources, real classroom support. Shop on TPT.Teacher Emergency Toolkit — practical resources, real classroom support. Shop on TPT.