The Elevate Blog banner: Real Classrooms. Practical Ideas. Higher Expectations. Three students climb a rocky ridge at sunrise, each pulling the next one up, toward a teacher reaching down to help.

Tag: blended learning

  • Station Rotation in Grades 6–12: What the Evidence Shows, and How to Build One That Works

    Station Rotation in Grades 6–12: What the Evidence Shows, and How to Build One That Works

    By Clay Shumate

    Station rotation splits one class into groups that cycle on a timer through stations inside the same room, at least one of them online. It is a scheduling structure, not an intervention. The one study that looked for research on it found none, and the evidence that exists belongs to a single station: the teacher-led small group.

    Key Takeaways

    • The people who named the model declined to claim it works. Heather Staker and Michael Horn’s taxonomy says plainly that “the definitions in this taxonomy leave out such appraisals” of quality, and that blended learning “can be both good and bad.”
    • Somebody did go looking, and came back empty. A 2020 study by the American Institutes for Research reports that its literature search “did not yield any empirical research articles on station rotation” — then found the model “was not associated with significantly higher student achievement on standardized assessments.”
    • The evidence lives in one station. Teacher-led small-group instruction has real, replicated effects. It also discounts with age: the Education Endowment Foundation puts small group tuition at +4 months in primary and +2 months in secondary.
    • Group size is the number that matters most. The EEF’s rule of thumb is that “the smaller the group the better,” and that “once group size increases above six or seven there is a noticeable reduction in effectiveness.” A thirty-student class in three stations puts ten at the teacher table.
    • The costs land harder in high school than in elementary. Lost instructional time rises with grade level, and 17 percent of US teens told Pew they are at least sometimes unable to finish homework because they lack reliable internet or a computer.

    What is station rotation?

    Station rotation is a blended-learning model in which students in one course rotate on a fixed schedule, or at the teacher’s discretion, among learning stations inside the classroom — and at least one of those stations is online. Every student passes through every station.

    That definition is not a paraphrase. Staker and Horn’s 2012 taxonomy defines the Station-Rotation model as “a Rotation-model implementation in which within a given course or subject (e.g., math), students rotate on a fixed schedule or at the teacher’s discretion among classroom-based learning modalities,” where “the rotation includes at least one station for online learning.” What separates it from the other rotation models is that “students rotate through all of the stations.”
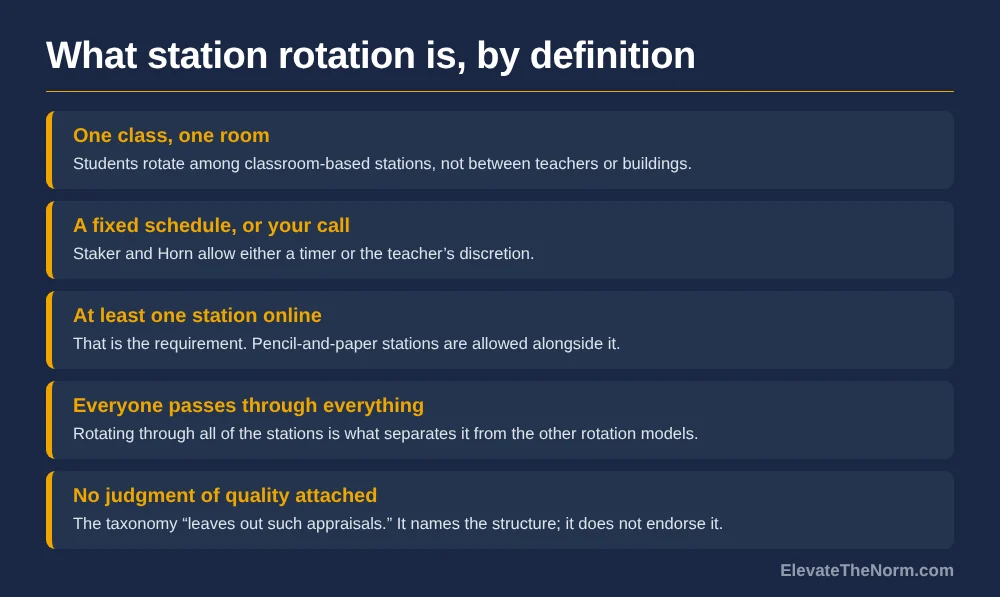
    Five stacked panels setting out the defining features of station rotation: one class in one room, a fixed schedule or teacher discretion, at least one online station, every student rotating through all stations, and no judgment of quality in the taxonomy.
    The taxonomy names the structure. It does not endorse it.

    Two things in that document deserve more attention than they get. The first is the authors’ stated purpose: definitions that “create a shared language that enables people to talk about the new phenomena.” A classification, in other words. The second is their refusal to grade it. The taxonomy “leaves out such appraisals,” and the paper says blended learning “can be both good and bad.”

    Worth noticing where the canonical example comes from. The illustration Staker and Horn use for station rotation is a kindergarten classroom, with fifteen computers, rotating among online learning, small-group instruction and individual assignments. The model’s defining picture is five-year-olds. That is not a reason to dismiss it in grades 6–12, but it is a reason to stop treating it as a secondary practice with a secondary track record.

    Does station rotation actually work?

    Nobody knows. The American Institutes for Research looked for empirical research on station rotation in 2020 and reports that its search “did not yield any empirical research articles on station rotation.” It describes the wider personalized-learning research base as “thin.”

    That is the whole answer to the question most teachers are asking, and it is worth sitting with: the one serious attempt to find evidence for this model came back empty-handed before it had even started looking at students.

    So AIR ran its own descriptive study across five sites, and found that “station rotation was not associated with significantly higher student achievement on standardized assessments.” Attendance showed no significant difference either. Students did generally report positive views of their learning — self-reported, affective, and not the same thing as learning more.

    Read that result with the authors’ own limits attached. Their design “does not allow for strong causal inference”: it is a convenience sample, reporting associations rather than effects. A null association is not proof the model fails. It is the absence of the evidence most people assume is already there.

    And even that study is not about your students. Its surveys went to all grade 4–8 teachers, and it reports station rotation was “more common in elementary grades than in middle grades.” There is no grades 9–12 study of this model at all.

    Why do people think station rotation has evidence behind it?

    Because one federal number gets borrowed constantly. The US Department of Education’s meta-analysis of online learning reported that “the mean effect size in studies comparing blended with face-to-face instruction was +0.35, p < .001.” That figure is real, and it is not about secondary students.

    The report’s authors say so themselves, twice. “The great majority of estimated effect sizes in the meta-analysis are for undergraduate and older students,” and “caution is required in generalizing to the K–12 population.” Then the sentence that undoes the marketing version entirely: “the positive effects associated with blended learning should not be attributed to the media, per se” — because the blended conditions usually added learning time and extra instructional elements on top.

    Purely online against face-to-face, in the same analysis, produced an average effect of +0.05 and was not statistically significant. The blended advantage came from adding things, not from moving things online.

    How thin is the K–12 base underneath all this? A federal regional lab review puts a number on it: of the prior meta-analytic literature, “only 5 of 176 studies that met the authors’ eligibility criteria focused on K–12 schooling.” Of its own 17 studies, “only 7 used a rigorous group research design,” and it concludes that its findings “do not allow for conclusions to be drawn about the effectiveness of these programs as a whole.”

    What does the one secondary study show?

    It contradicts itself, which is more useful than it sounds. Minaz Fazal and Melanie Bryant compared station-rotation blended learning against face-to-face instruction with 413 sixth graders in middle school math, and got opposite answers from two different tests.

    On the MAP growth measure, the blended group came out ahead: t(411) = 3.02, p = .003, d = 0.30. On the STAAR state achievement test, the face-to-face group came out ahead, d = −0.28, p = .005. Same students, same study, two outcome measures, two signs.

    The design limits it further. Students were not randomly assigned; the authors call the work non-experimental, with four teachers and intact classes. Take one number from that study and you can prove whatever you came to prove, which is roughly what has happened to this model in general.

    Where is the real evidence in this model?

    In the teacher station. Small-group instruction from a teacher is one of the better-evidenced things in education, and in a station rotation it is the only part of the structure carrying a track record.

    Andre Nickow, Philip Oreopoulos and Vincent Quan’s meta-analysis of experimental tutoring studies reports “an overall pooled effect size estimate of 0.37 SD” across PreK–12. Two qualifications travel with it. Effects “tend to be strongest among the earlier grades,” a decline the authors attribute entirely to literacy programs — in mathematics they report a reverse trend, which is good news if you teach secondary math. And effects are “stronger, on average, for teacher and paraprofessional tutoring programs” than for volunteers or parents, though that teacher advantage is driven largely by first-grade Reading Recovery studies. The authors call these moderator findings descriptive, not causal.
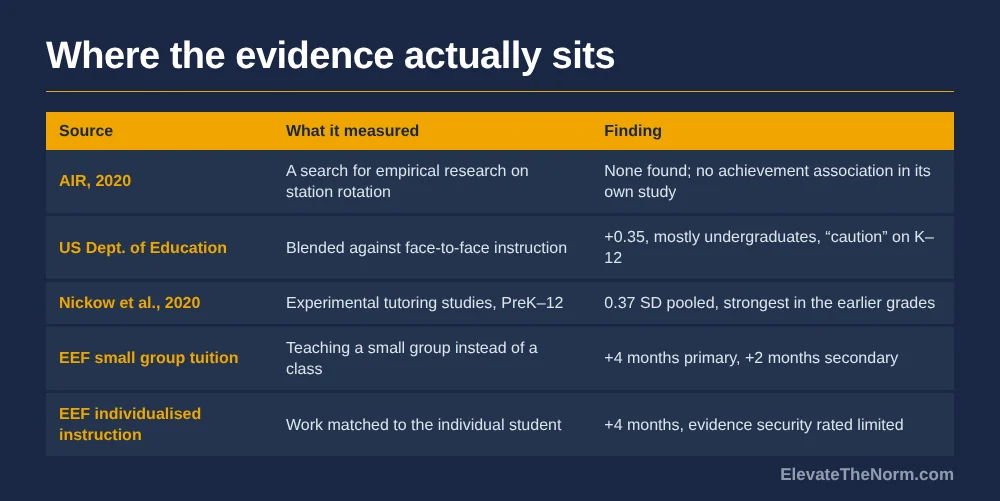
    Table of five sources with what each measured and what it found, including the search that found no empirical research on station rotation and the small-group figures of plus four months in primary and plus two in secondary.
    The rotation itself has no evidence behind it. The teacher station does.

    The EEF’s toolkit entry gives the same shape in school-friendly units: small group tuition averages “four months’ additional progress over the course of a year,” but “impact tends to be greater in primary schools (+4 months) than secondary schools, which has fewer studies overall and a lower impact (+2 months).” Evidence security is rated moderate, and it “lost an additional padlock because a large percentage of the studies were not independently evaluated.”

    The actionable number is group size. “As a rule of thumb, the smaller the group the better,” and “once group size increases above six or seven there is a noticeable reduction in effectiveness.” That single sentence should decide your station design before anything else does. Three stations in a class of thirty puts ten students at the teacher table, which is past the point where the evidence says the thing stops working.

    Does the online practice station do anything?

    Modestly, on limited evidence, and not because it is digital. The EEF rates individualised instruction at “+4 months” of additional progress for very low cost — with evidence security rated “limited.”

    Two findings on that page cut against the usual pitch. Secondary does better than primary here, +4 months against +3 — the opposite of the small-group pattern. And on the technology itself: “approaches using digital technology to individualise instruction show that they are as effective as those without technology.” The software is not the ingredient.

    There is a detail buried in that entry that describes station rotation without naming it. The EEF notes that many technology studies pair the software with small group tuition, “where teachers provide targeted instruction to the pupils that are not engaging with the technology.” That is the model, and the EEF attributes the result to the pairing rather than to the program. Its blunt guidance: individualised instruction “may be better used as a supplement to usual class teaching, rather than a replacement.”

    If you want named programs with rigorous K–12 findings behind them, the federal review above identifies four: Cognitive Tutor Algebra I, LeapTrack, READ 180 and Time To Know. The underlying studies were not read for this article, so no effect sizes are quoted for any of them. That list is also notable for how short it is.

    What does station rotation cost you in time?

    Three transitions in a period you did not previously spend, against a time budget that is already tighter in high school than in elementary school. That trade is the main practical argument against the model, and it gets stronger as students get older.

    Matthew Kraft and Sarah Novicoff’s analysis of one district’s instructional time found that “the average elementary school student in PPSD loses 16 percent of instructional time,” while “the typical middle school student loses 21 percent” and “high school students lose a total of 25 percent.”

    The same paper is the source of a figure that gets misquoted everywhere, so here it is in full: “estimates of off-task behavior, transitions, and wait-time suggest these activities occupy between 17 and 29 percent of instructional time.” That is a range assembled from four other studies, and it bundles off-task behaviour, transitions and wait time together. It is not a measurement of transitions, and anyone telling you transitions eat a quarter of your class has not read the sentence.

    What the figures do support is this: the move costs real minutes, and a 45- or 50-minute secondary period cannot absorb five stations. Keep the count low and the transitions boring.

    How many stations should you have, and how long should they be?

    Two or three stations, sixteen to thirty minutes each, is what teachers running the model actually do. That is prevailing practice reported by AIR, not an outcome study, and it should be read as what works logistically rather than what produces learning.

    AIR found teachers most often used two or three stations rather than four or five, that “about 55% of station rotation teachers reported 16 to 30 minutes at each station, and about 32% reported 10 to 15 minutes,” that most grouped students by similar learning needs, and that about a third regrouped weekly.

    Catlin Tucker, who has written more practical material on this model than anyone, recommends designing three or four distinct stations and running mirrored copies so each half of the room meets the same tasks, at roughly six students per station, with a rotation allowed to run across several days rather than cramming into one period. That is practitioner advice rather than evidence — but six per station is the same number the EEF arrives at from the research, which is a convergence worth taking seriously.

    StationWhat happens thereWhat the evidence saysThe number that governs it
    Teacher-led small groupDirect teaching to a handful of studentsThe only component of the model with a replicated track recordSix or seven students, maximum
    Independent or online practicePractice on content already taughtModest, on limited evidence, and digital is no better than paper+4 months, evidence security rated limited
    Collaborative taskStudents work a task together without youDepends on the task and the roles, not on the rotationNo station-rotation evidence exists
    The rotation itselfMoving students between stations on a timerA search for empirical research on it returned nothingThree transitions you did not previously spend
    What each part of a station rotation is actually buying you, and the number that should decide its design.

    How do you build a station rotation in a 50-minute period?

    Work backwards from the teacher table. Decide how many minutes you need with how many students, and let that decide everything else — the station count, the timing, and whether the rotation finishes today at all.

    1. Name the one thing you need to teach a small group. If you cannot say what you will do at that table that you cannot do from the front, you do not need stations. You need a better lesson.
    2. Divide the class so the teacher table holds six or seven, not ten. In a class of thirty that means four groups, which means the rotation runs over two days. Let it. A group of ten at the teacher table is past the size where the evidence says small-group teaching works.
    3. Build two stations, not four. One teacher-led, one that runs without you. A third only if it genuinely runs without you too. Every station you add is a transition you pay for and a set of instructions you have to write.
    4. Make the independent station practice, not new instruction. The EEF is explicit that individualised instruction works better as a supplement than a replacement, and students teaching themselves new content on a screen while you are busy is the version of this model that fails quietly.
    5. Write the stuck procedure before the lesson. Students at the independent station will get stuck while you are unavailable, and “ask three before me” reads to a teenager as “do not ask.” Give them a written answer key, a worked example, or a named classmate — something that is not a closed door.
    6. Time the transition and make it dull. Same signal, same route, same thirty seconds. The only interesting thing in the room should be the work.
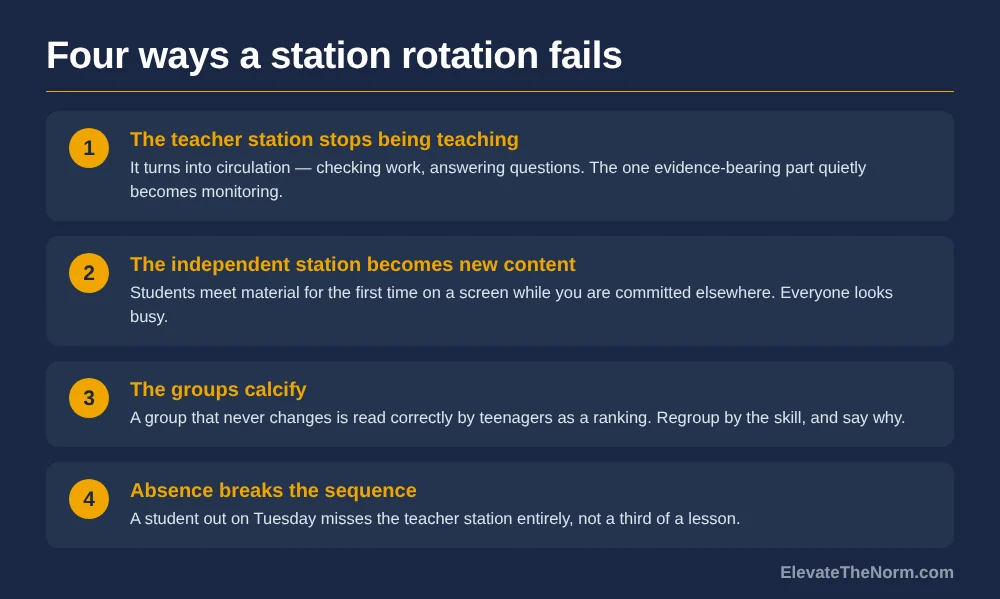
    Four numbered cards naming the teacher station turning into circulation, the independent station becoming new content, groups that never change, and absence removing the teacher station entirely.
    Three of the four are a teacher dropping a step rather than the model failing.

    A note on grouping, because it is the part students notice first. AIR found most teachers group by similar learning needs and only about a third regroup weekly. A group that never changes is read correctly by teenagers as a ranking, and a student who has been in the same group since September has been told something about themselves every week since. Group by the specific skill you are teaching that week, regroup when the skill changes, and say out loud why the groups look different today. Flexible grouping that actually changes is the version of this that does not become tracking inside one classroom.

    What about students without reliable internet or devices?

    Keep the online station inside the room and inside the period. A rotation that works in class and then sends unfinished digital work home turns a device gap into a grade gap, and the gap is well documented.

    In a 2018 Pew Research Center survey of 743 US teens aged 13 to 17, 17 percent said they are often or sometimes unable to complete homework assignments because they do not have reliable internet or a computer. Among teens in households earning under $30,000 a year it was 24 percent, against 9 percent in households above $75,000. A quarter of Black teens said they were at least sometimes unable to finish homework for that reason. Those figures are from 2018 and should be read as dated rather than current.

    The design implication is small and non-negotiable. Whatever happens at the online station finishes at the online station, there is a paper version for the day the network is down, and nothing at that station is the only route to the content. Staker and Horn’s own definition allows pencil-and-paper stations alongside the online one; the model does not require a device per child.

    What goes wrong with station rotation?

    Four things, and three of them are a teacher dropping a step rather than the model failing. The fourth is a question nobody has a good answer to.

    The teacher station stops being teaching. It becomes circulation — checking work, answering questions, putting out fires. The only evidence-bearing component of the structure quietly turns into monitoring, and the rotation keeps running as though nothing changed.

    The independent station becomes unsupervised new content. Students meet material for the first time on a screen while the teacher is committed elsewhere. That is the arrangement the EEF warns against, and it is invisible from the front of the room because everyone looks busy.

    The groups calcify. Covered above, and it is the failure students feel rather than the one that shows up on a test.

    Absence breaks the sequence. A student out on Tuesday misses the teacher station entirely, not a third of the lesson, and no published guidance addresses it. The workable answer is to make the teacher station the one piece you will re-run, in two minutes, one-to-one, rather than the one piece that cannot be repeated. Noise and grading sit in the same category: real problems, no research, and worth deciding before the first rotation rather than during it.

    Clay’s take: the rotation is the furniture, the small group is the instruction

    The structure’s entire job is to buy a teacher twenty minutes with six students. If a design does not deliver that, there is nothing left in it that any evidence supports.

    I am wary of how this model gets sold, because the part being sold is the part with no track record. The pitch leads with the software and the personalization, and the research leads with a teacher at a table with a handful of kids — a practice that predates every piece of technology in the room. A school that buys the platform and leaves the teacher station at ten students has bought the packaging.

    That said, a null result from one descriptive study is not a reason to walk away. Plenty of sensible teaching has less behind it than this, and “no evidence” means nobody has measured it rather than that it has failed. What the thin evidence should change is the claim, not the practice. Run it because you want twenty minutes with six students and cannot get them any other way. Do not run it because a slide said blended learning is worth +0.35, and do not let anyone tell a school board that it is.

    What to do next week

    Try one rotation in one class, with two stations, on content you have already taught. Not new material, not four stations, not a model class period for anyone to watch.

    Put six or seven students at your table and teach them the thing you have never had time to teach a whole class. Give everyone else practice they can genuinely do alone, with a written way out when they get stuck. Then ask yourself one question at the end: was the small group better than what you would have done from the front? That is the whole test, and it has nothing to do with technology.

    If the answer is no, the fix is usually upstream. The flipped classroom buys class time a different way, group work roles cover what happens at the station you are not sitting at, numbered heads together is a smaller structure that needs no rotation at all, and activities for student centered learning covers what to put at a station once you have built one.

    Frequently Asked Questions

    What is the station rotation model?

    Station rotation is a blended-learning model in which students in one class rotate on a fixed schedule, or at the teacher’s discretion, among stations inside the same room, with at least one station online. Staker and Horn’s taxonomy distinguishes it from other rotation models by the fact that students rotate through all of the stations rather than only some.

    Does station rotation improve student achievement?

    There is no evidence that it does. A 2020 American Institutes for Research study reports that its literature search found no empirical research articles on station rotation, and its own descriptive study found the model was not associated with significantly higher achievement on standardized assessments. That is an absence of evidence rather than proof of failure, and the study covered grades 4 to 8.

    How many stations should a station rotation have?

    Two or three, with the teacher-led group kept to six or seven students. AIR found teachers most often run two or three stations, with about 55 percent spending 16 to 30 minutes at each. The limiting number comes from the EEF: above six or seven students in a group there is a noticeable reduction in the effectiveness of small-group teaching.

    What is the difference between station rotation and a flipped classroom?

    A flipped classroom moves first-exposure instruction out of the period, usually to video at home, so class time can be spent on practice. Station rotation keeps everything inside the period and moves the students instead, cycling them between a teacher-led group and work they do without you. One changes when instruction happens; the other changes where students are standing.

    Can you do station rotation in a 45-minute class period?

    Yes, with two stations rather than four, and often by letting one rotation run across two days. Three transitions cost real minutes in a period that is already losing time, and secondary students lose more instructional time than elementary students do. Keep the station count low, keep transitions dull and identical, and do not try to finish everything in one sitting.

    Does station rotation require a device for every student?

    No. The model’s own definition requires at least one online station, not one device per child, and it explicitly allows pencil-and-paper stations alongside it. Keeping the online work inside the room and inside the period also avoids pushing it home, which matters because 17 percent of US teens told Pew in 2018 they sometimes cannot finish homework for lack of reliable internet or a computer.

    Is my child only getting a third of the teacher’s attention?

    Less teacher time overall, but more of it directed at them. In a whole-class lesson a student may not be spoken to at all; at a teacher-led station of six, being spoken to is unavoidable. The trade only pays if the small group is genuine teaching rather than the teacher circulating and checking work, which is the most common way this model goes wrong.

    What happens when a student is absent during a station rotation?

    They miss the teacher station entirely, not a third of a lesson, and no published guidance addresses this. The practical fix is to treat the teacher-led portion as the piece you will re-run in two minutes one-to-one, rather than the piece that cannot be repeated. Decide that before the first rotation, not after a student has missed one.

    Sources

    • Staker, H., & Horn, M. B. Classifying K–12 Blended Learning. Innosight Institute (now the Clayton Christensen Institute), May 2012. Full text. Source of the Station-Rotation definition quoted here, the rotation-through-all-stations distinction, the stated purpose of creating a shared language, the statement that the taxonomy leaves out appraisals of quality, and the kindergarten illustration of the model.
    • Fulbeck, E., Atchison, D., Giffin, J., Seidel, D., & Eccleston, M. Personalizing Student Learning With Station Rotation: A Descriptive Study. American Institutes for Research, commissioned by the Overdeck Family Foundation, July 2020. Full text. Source of the finding that the literature search yielded no empirical research articles on station rotation, the thin description of the research base, the null achievement and attendance associations, the authors’ statement that the design does not allow strong causal inference, the two-to-three station and 16-to-30-minute practice figures, the grouping and regrouping findings, and the grade 4–8 scope.
    • Means, B., Toyama, Y., Murphy, R., Bakia, M., & Jones, K. Evaluation of Evidence-Based Practices in Online Learning: A Meta-Analysis and Review of Online Learning Studies. U.S. Department of Education, Office of Planning, Evaluation and Policy Development, revised September 2010. Full text. Source of the +0.35 blended-versus-face-to-face effect, the +0.05 purely-online result, the authors’ statement that most effect sizes are for undergraduate and older students, the caution about generalizing to K–12, and the warning that the effects should not be attributed to the media per se. The copy read for this article was the Boston University mirror.
    • Brodersen, R. M., & Melluzzo, D. Summary of research on online and blended learning programs that offer differentiated learning options (REL 2017–228). Institute of Education Sciences, National Center for Education Evaluation, REL Central, February 2017. Full text. Source of the five-of-176 figure, the seven-of-17 rigorous-design count, the statement that no conclusions can be drawn about effectiveness as a whole, and the four named programs with rigorous positive findings.
    • Fazal, M., & Bryant, M. “Blended Learning in Middle School Math: The Question of Effectiveness.” Journal of Online Learning Research, 5(1), 49–64 (2019). Full text. Source of the 413 sixth-grade sample, the station-rotation framing, the MAP result (d = 0.30) and the opposing STAAR result (d = −0.28), and the authors’ statement that students were not randomly assigned. The study’s reported means were not reproduced here because the published tables and narrative disagree.
    • Nickow, A., Oreopoulos, P., & Quan, V. The Impressive Effects of Tutoring on PreK-12 Learning: A Systematic Review and Meta-Analysis of the Experimental Evidence. NBER Working Paper No. 27476, July 2020. Full text. Source of the 0.37 SD pooled effect, the finding that effects are strongest in earlier grades with a reverse trend in mathematics, the comparison of teacher and paraprofessional tutors against volunteers and parents, and the authors’ description of their moderator analyses as descriptive rather than causal.
    • Education Endowment Foundation. Small group tuition, Teaching and Learning Toolkit, accessed November 2026. Toolkit entry. Source of the four-months average, the primary (+4) against secondary (+2) split, the smaller-the-group rule of thumb, the six-or-seven threshold, the moderate evidence rating, and the note that a padlock was lost because many studies were not independently evaluated.
    • Education Endowment Foundation. Individualised instruction, Teaching and Learning Toolkit, accessed November 2026. Toolkit entry. Source of the +4 months figure and limited evidence security, the secondary (+4) against primary (+3) comparison, the finding that digital approaches are as effective as those without technology, the description of pairing software with small group tuition, and the supplement-rather-than-replacement guidance.
    • Kraft, M. A., & Novicoff, S. Time in School: A Conceptual Framework, Synthesis of the Causal Research, and Empirical Exploration. Annenberg EdWorkingPaper No. 22-653, February 2024. Full text. Source of the Providence figures of 16, 21 and 25 percent of instructional time lost by level, and of the 17-to-29 percent range, which is synthesised from four prior studies and covers off-task behaviour, transitions and wait time together rather than transitions alone.
    • Anderson, M., & Perrin, A. “Nearly one-in-five teens can’t always finish their homework because of the digital divide.” Pew Research Center, 26 October 2018. Report. Source of the 17 percent overall figure, the 24 percent and 9 percent income comparison, the figure for Black teens, and the sample of 743 teens aged 13 to 17 surveyed in spring 2018.
    • Tucker, C. “FAQ: Station Rotation Model” and “Addressing Station Rotation Challenges.” catlintucker.com, December 2022 and April 2018. FAQ post. Source of the mirrored-station design, the three-to-four station recommendation, roughly six students per station, and rotations running across several days. This is practitioner advice from a teacher and author, not research, and is labelled as such in the text.
    About Clay Shumate

    Clay Shumate is a certified secondary Social Studies teacher in the public schools of West Alabama, with seven years of classroom experience, a B.A. in History, and an M.Ed. in Secondary Education. He writes about project-based learning, student responsibility, respect, and practical ways to hold young people to a higher standard while giving them room to learn from mistakes. He is a member of the Society of Professional Journalists and writes to its Code of Ethics; this site’s editorial standards and corrections policy are published in full. More about Clay.

  • The Flipped Classroom in Grades 6–12: What the Evidence Shows, and How to Flip One Lesson

    The Flipped Classroom in Grades 6–12: What the Evidence Shows, and How to Flip One Lesson

    By Clay Shumate

    A flipped classroom moves direct instruction out of class time, usually to a short video, so class is spent on practice the teacher can watch. Meta-analyses find a small positive effect on achievement, around 0.35 of a standard deviation, but roughly nine out of ten of those studies were run on college students rather than teenagers.

    Key Takeaways

    • The effect is real and small. van Alten, Phielix, Janssen and Kester (2019) pooled 114 studies and found g = 0.36 on assessed learning, with a 95 percent confidence interval of 0.28 to 0.44. Student satisfaction did not move at all.
    • The evidence is about undergraduates. In Låg and Sæle (2019), 239 of 272 learning comparisons came from higher education and 20 from secondary schools. Kapur, Hattie, Grossman and Sinha (2022) reports that 90 percent of the students in its 173 studies were university-based.
    • Two moderators are worth more than the headline number. Flipped classes that cut face-to-face time did worse. Flipped classes that added a quiz on the preparation did better. Both come from the same meta-analysis.
    • Do not cite one number. A review of 46 flipped-learning meta-analyses found overall effects ranging from 0.19 to 2.29. Whichever figure is on the in-service slide was chosen from a very wide menu.
    • The homework-access problem is smaller than it was and still real. Federal data put 5 percent of students in homes with no internet, 7 percent in rural areas, and 12 percent among students below the poverty threshold against 2 percent in high-income families.

    What is a flipped classroom?

    A flipped classroom is an arrangement where first exposure to new material happens before class, usually through a short video or reading, so class time can be used for the work students would otherwise have done alone. The lecture becomes the homework and the homework becomes the lesson.

    The formal definition comes from The Flipped Learning Network, which published its four-pillar version in March 2014: flipped learning is an approach “in which direct instruction moves from the group learning space to the individual learning space.” The same organization draws a line that most people skip. “These terms are not interchangeable,” it says. “Flipping a class can, but does not necessarily, lead to Flipped Learning.”

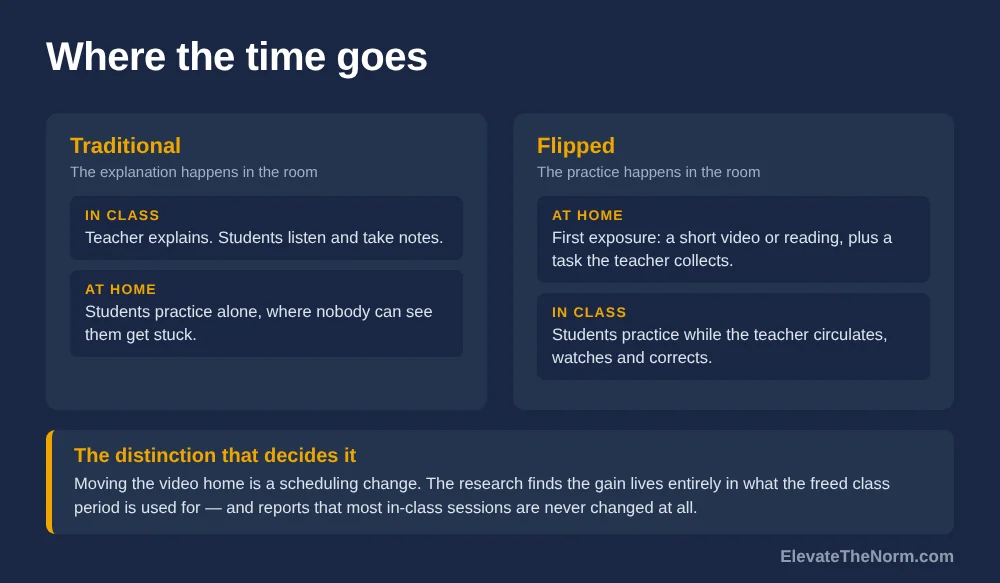
    That distinction is the whole argument in one sentence. Recording your lecture and assigning it is a change in scheduling. Whether anything improves depends entirely on what you do with the fifty minutes you just freed up, and the research below says most teachers do not change that part at all. One concrete answer to that question is splitting the period into stations students move through.

    Diagram contrasting a traditional lesson, where class time is spent on the lecture and practice happens alone at home, with a flipped lesson, where first exposure happens at home and class time is spent on practice the teacher can watch and correct.

    Who invented the flipped classroom?

    Nobody cleanly. The term is usually credited to Jonathan Bergmann and Aaron Sams, two high school chemistry teachers who began recording lectures around 2007, but the practice predates the name by at least a decade.

    a 2020 review of the research traces an earlier line: Lage, Platt and Treglia (2000), three economics professors, described an “inverted classroom” in a peer-reviewed journal in 2000, and Eric Mazur’s peer instruction at Harvard in the 1990s is described as “one of the earliest instances of flipped learning.” That same review calls Bergmann and Sams only “believed to be first,” which is the honest level of confidence. Both of those earlier efforts were with university students.

    It matters less than it sounds, but it explains something. A practice named by classroom teachers and evidenced by university professors is going to have a research base that does not match the people using it, and that is exactly what happened.

    Does the flipped classroom actually work?

    Modestly, on average, in the settings where it has been tested most. The best-powered estimates land around a fifth to a third of a standard deviation on achievement, and shrink further when you correct for the studies that never got published.

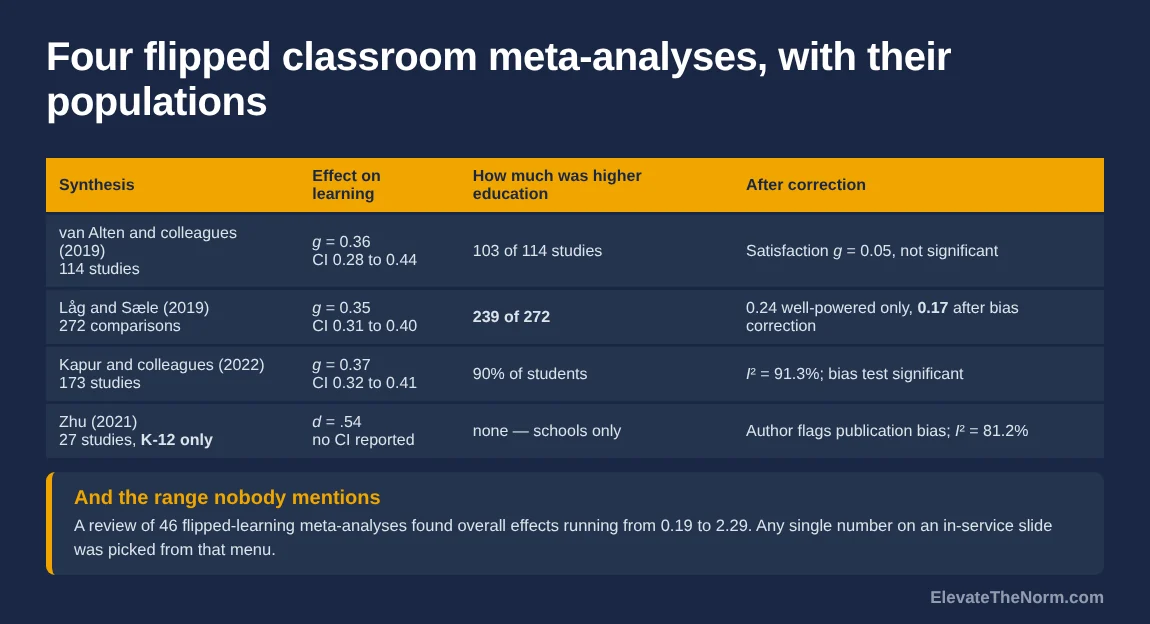
    Table of four flipped classroom meta-analyses showing the effect size each reported, how much of its evidence came from higher education rather than schools, and what happened to the number after correcting for publication bias.

    van Alten, Phielix, Janssen and Kester (2019) is the most quoted. Across 114 studies it found g = 0.36 on assessed learning outcomes, 95 percent confidence interval 0.28 to 0.44. Two things in it get left off the slide. Perceived learning was not significant, and student satisfaction came in at g = 0.05 with a confidence interval spanning zero — students did not enjoy it more. The authors call flipping “a promising pedagogical approach when appropriately designed,” which is a careful sentence doing careful work.

    Låg and Sæle (2019) is the one to read if you want the number after the air comes out. The headline is g = 0.35 across 272 comparisons. Restrict it to adequately powered studies and it falls to 0.24. Adjust for publication bias and the estimate lands at g = 0.17. Satisfaction ran the same way: a small positive 0.16 that became −0.03 after the same correction. The authors are careful to note that the correction gives “approximate indications,” not a precise number, but the direction is unambiguous.

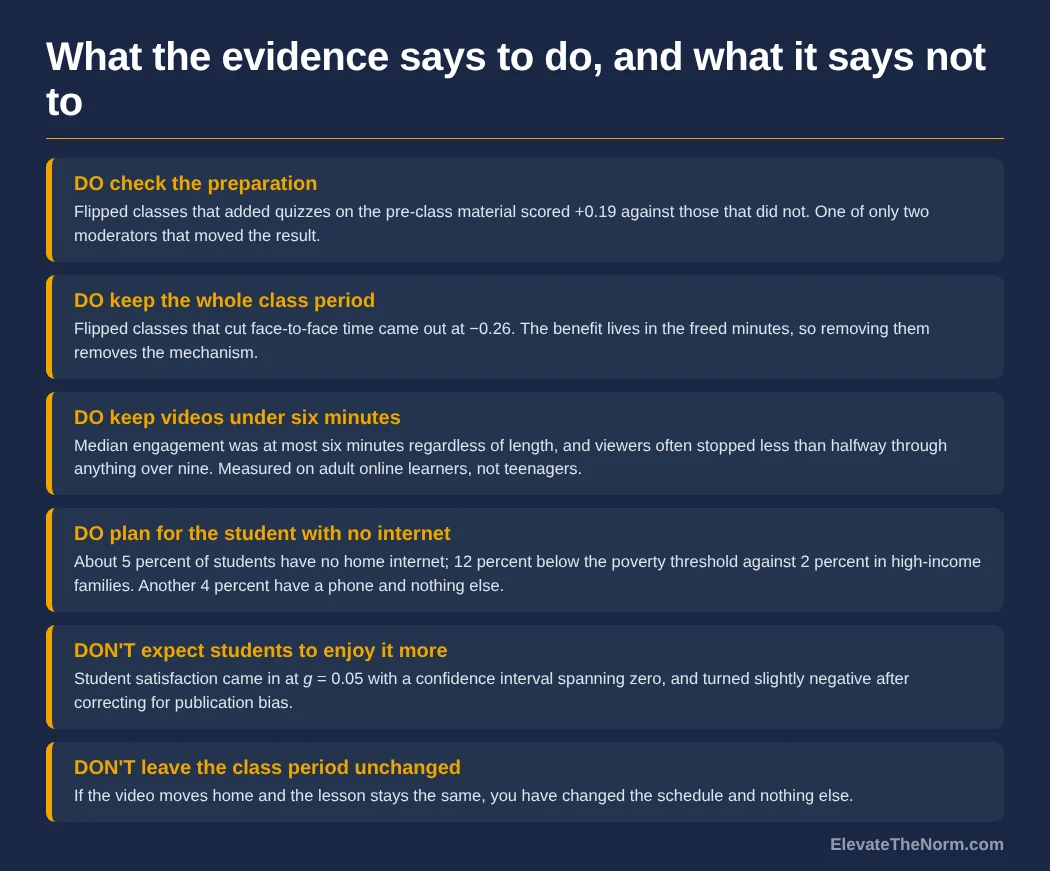
    Two findings in van Alten, Phielix, Janssen and Kester (2019) are worth more to a working teacher than any of those effect sizes. Flipped classes where face-to-face time was reduced performed significantly worse, at −0.26. Flipped classes that added quizzes on the pre-class material performed better, at +0.19. In plain terms: if the plan is to flip so the class can meet less often, the evidence says do not. If you flip, check the preparation.

    How much of the flipped classroom research is about teenagers?

    Very little, and this is the single most important thing to know before quoting any of it in a secondary school. Three independent syntheses put the higher-education share at roughly 85 to 90 percent.

    The numbers are specific. In Låg and Sæle (2019), the learning outcomes break down as 239 higher education, 20 secondary, 12 primary and one further education — and the pass-rate analysis, with 45 comparisons, contains zero school studies at all. In van Alten, Phielix, Janssen and Kester (2019), 11 of 114 studies were secondary. Kapur, Hattie, Grossman and Sinha (2022) states that “the majority of students were university-based (90%),” while reporting its effect sizes as 3 percent primary, 42 percent secondary and 55 percent higher education. Those two figures count different things, students versus effect sizes, and the paper gives both.

    There is one meta-analysis built only on schools. Zhu (2021) pooled 53 effect sizes from 27 studies of K-12 students and reported a weighted average of d = .54 — larger than any of the higher-education estimates. Before anyone puts that on a slide, the author’s own analysis flags publication bias by funnel plot, trim-and-fill and Egger’s test, and heterogeneity sits at I² = 81.2 percent. Twenty-seven studies with an acknowledged bias problem is better than nothing and is not a settled answer.

    One scale distinction belongs with those numbers. Nearly all of this research tests one teacher flipping one course, and almost none of it tests a school flipping everything. A building-wide flip is a different proposition: it multiplies the home-preparation load across every subject a student takes on the same evening, and no student’s evening was studied that way. A district deciding this at scale is making a decision the evidence base does not cover.

    Lo and Hew’s review of K-12 flipped classrooms is the other school-specific piece, covering 15 published K-12 studies. Achievement results were neutral or positive against traditional classrooms, and student attitudes were mixed. That is a fair summary of where this sits for grades 6 through 12: probably not harmful, possibly helpful, not proven at the size the enthusiasm implies.

    Why do the effect sizes disagree so much?

    Because “flipped classroom” describes a schedule rather than a method, and because the syntheses pooling those studies have real methodological problems. The range across the literature is roughly twelvefold.

    Kapur, Hattie, Grossman and Sinha (2022) reviewed 46 flipped-learning meta-analyses and reports: “We found the overall effects from 0.19 to 2.29.” Their own meta-analysis of 173 studies landed at g = 0.37, confidence interval 0.32 to 0.41, with I² = 91.27 percent and a statistically significant test for publication bias. An I² above 90 means the studies are not estimating one common effect, and pooling them produces an average of things that are not alike.

    Hew, Bai, Dawson and Lo (2021) examined 19 of those meta-analyses, covering more than 495 primary studies, and found six elements “inadequately conducted or reported” across them: searching grey literature, assessing risk of bias, handling non-independent effect sizes, controlling for students’ initial differences, controlling for instructor equivalence, and assessing publication bias. Their conclusion is that positive evidence exists but there is “reason to question how this evidence has been synthesized.” Controlling for prior achievement and for who taught the class are not fine points. They are the two most obvious ways a flipped section could look better without the flipping doing anything.

    There is also a content problem underneath the statistics. Kapur, Hattie, Grossman and Sinha (2022) observes that “most in-class sessions are not modified based on the flipped implementation.” If the video moves home and the class period stays the same, the study is measuring a scheduling change. That is roughly what one chemistry teacher told Education Week asked teachers who had tried it more than a decade ago, calling flipping “a time-shifting tool that is grounded in the same didactic, lecture-based philosophy.”

    What happens when students don’t watch the video?

    You teach the lesson twice, badly, to a split room. This is the failure mode every teacher who has tried it names first, and the evidence points at one specific fix: make the preparation produce something you collect.

    The quiz moderator in van Alten, Phielix, Janssen and Kester (2019) is that fix with a number attached: +0.19 for flipped classes that added quizzes on the pre-class material, across 36 of 114 studies. It is the difference between assigning a video and assigning a task. Three or four questions that take two minutes and that you can see before the bell is enough, which is also the difference between a check and a grade in practice.

    Checklist of six findings from the flipped classroom research: check the preparation with a quiz, keep the whole class period, keep videos under six minutes, plan for students without home internet, do not expect higher student satisfaction, and do not leave the class period unchanged.

    The honest reports from practitioners are blunter. In Education Week asked teachers who had tried it, an instructional coach described students who “may have been in class, but they weren’t engaged,” and said that for some, “self-paced became no pace,” so teachers had to put deadlines back. Another teacher put it plainly: “Just because you flipped your classroom doesn’t mean your students will watch the videos.”

    Tell families what you are doing before they work it out from their kitchen table. From outside, “my child watches videos for homework and does worksheets in class” sounds exactly like a teacher who stopped teaching. Two sentences in a syllabus or an email — the explanation moved home so the practice could happen where I can help — prevents a conversation that is otherwise very hard to have in March.

    Two practical consequences follow. Plan the first ten minutes so the room works whether or not everyone prepared — a short recap station, a partner summary, something like earning the first five minutes of the period — rather than opening with a task that assumes compliance. And decide in advance what happens to the student who did not watch it, because that is a policy question, not a mood. If the answer is a zero, you are back to a late work policy you can actually defend and all its problems.

    What about students without reliable internet at home?

    It is a smaller problem than it was and it is not solved, and the answer depends on which students you teach. Federal data put about 5 percent of students in homes with no internet access at all, rising to 12 percent for students below the poverty threshold.

    the federal figures on rural students and the internet give the most useful breakdown for school-age students: roughly 2.4 million students, about 5 percent, lived in homes without internet access. Seven percent of students in rural areas and 11 percent in remote rural areas were without it. Fixed broadband at home reached 82 percent of students overall, 76 percent in rural areas. The poverty gap is the number that should decide your planning: 12 percent of students below the poverty threshold had no home internet against 2 percent of students in high-income families, and among rural students fixed broadband ran 57 percent for low-income families against 82 percent for high-income ones.

    A caution about any single figure here. the federal data on children’s home internet access reports 97 percent of 3- to 18-year-olds with home internet in 2021 and 3 percent without — but notes on the same page that a different federal survey put the no-access figure at 12 percent, because the two surveys define internet access differently. Report both or neither. And note that 4 percent had access only through a smartphone, which is access in the survey and not access for watching a ten-minute video and taking notes, something worth holding alongside what the research says about phones in class.

    a Pew Research Center survey of teenagers found that 17 percent of teens were at least sometimes unable to finish homework because they lacked reliable computer or internet access, and 35 percent sometimes did homework on a cellphone, rising to 45 percent in households under $30,000. Those figures are from 2018 and pre-date the pandemic push on connectivity, so treat them as the shape of the problem rather than its current size. The practical move is cheap either way: ask the class, on paper, how they would watch something tonight, and build the fallback before you need it.

    How long should a flipped classroom video be?

    Short. Under six minutes if you can, and never longer than about nine. The most-cited evidence for this comes from online adult learners rather than teenagers, which is worth knowing before you treat it as a law.

    Guo, Kim and Rubin (2014) analyzed 862 videos and nearly 6.9 million viewing sessions and found that “video length was by far the most significant indicator of engagement.” Median engagement time was “at most 6 minutes, regardless of total video length,” and students “often make it less than halfway through videos longer than 9 minutes.” The rate at which viewers went on to attempt the associated problems fell steadily with length: 56 percent for the shortest videos, then 48, 43, 41 and 31 percent for the longest. The recommendation is explicit: segment into chunks “ideally less than 6 minutes.”

    Prep time is the honest cost, and the one figure available is a 2013 survey of 309 college faculty, in which 75 percent said preparing a flipped class takes more time than a traditional one. That sample was self-selected, from 2013, and made up of college instructors rather than school teachers, so treat it as a direction rather than a measurement. The thing that makes the cost bearable is the one nobody mentions: a six-minute explanation of how to balance an equation does not expire. You pay the recording cost once and spend it every year, which is why flipping your most-repeated lesson is better economics than flipping your most interesting one.

    The population caveat is not a technicality. Those were edX learners — self-selected adults with no attendance obligation and nothing at stake if they close the tab — and the measure was voluntary watch time, not learning. Your students have different incentives in both directions. Take the six-minute figure as a sensible default, not a finding about teenagers.

    Two other findings from the same study survive translation. Videos made for the purpose beat chopped-up recordings of live lectures, 55 percent against 41 percent on problem attempts, so recording your actual class period is the weakest version of this. And informal, close-up delivery beat studio production, which is good news for anyone recording at a kitchen table. On design, Richard Mayer’s own summary of the multimedia research reports segmenting a lesson into shorter learner-paced parts at a median d of 0.67 across its tests, while two of the moves teachers reach for first come out near zero: putting your on-screen text alongside your own narration sits at 0.10, and showing your face on screen at 0.20. Mayer notes himself that “most of our research has not targeted special populations” and calls for more work in real classrooms.

    How do you flip one lesson?

    Pick the lesson where you spend the most time talking and the least time watching students work. Flip that one, keep everything else, and judge it on what you could see during the period rather than on whether it felt modern.

    1. Choose a lesson that is mostly explanation. A procedure, a vocabulary set, a background-knowledge lecture. Do not flip the lesson that depends on discussion — you would be moving the good part home.
    2. Make the video under six minutes, or find one. Khan Academy says its library is “always free,” and your own three-minute recording beats a polished twelve-minute one. Record for the purpose rather than filming your class period.
    3. Attach a task that produces something you collect — and subtract the old homework. Three questions, a one-sentence summary, one thing they did not follow. This is the moderator with evidence behind it. But say the swap out loud, because from a desk this reads as an addition: students who used to watch nothing and do problems at home now watch a video, answer questions, and do the problems. If the old assignment does not actually come off the list, you have not flipped anything, you have added a second homework. Edpuzzle’s free plan caps the free plan at 20 saved activities and will embed questions in a video; a paper half-sheet does the same job for nothing.
    4. Decide the no-access and no-watch plan before you assign it. A transcript on paper, a lunch viewing, or a five-minute recap station at the start. Not every student has watchable internet at home and some are on a phone. Keep the consequence off the gradebook: a student whose wifi failed is not a student who refused, and the two are indistinguishable from the front of the room. Grading that difference means grading household income.
    5. Read the collected task before the bell and group the room with it. The quiz is only worth the moderator it earned if it changes the next fifty minutes. Three piles — got it, shaky, did not prepare — take two minutes to sort and tell you exactly who to start with. Collecting data you do not act on is the most common way this step gets hollowed out.
    6. Plan the class period as practice you can see. This is the step that decides whether anything improves. Work in pairs you circulate through, problems you watch them attempt, and real time spent letting students wrestle with something before you rescue them. If the period is still a lecture, you have moved a video and changed nothing.
    7. Do not shorten the class. The one moderator that came out negative was cutting face-to-face time. The freed minutes belong to practice, not to the calendar.
    8. Judge it on one question. Did you see more of their thinking than you usually do? If yes, flip the next lesson of that type. If no, the problem is the class period, not the video.

    Can you flip a classroom without videos or technology?

    Yes, and for many classes it is the better version. Nothing in the definition requires video. It requires that first exposure happen before class, which a reading, a one-page primer or a short problem set does equally well.

    The Flipped Learning Network’s own wording is about where direct instruction happens, not what format carries it. A two-page excerpt with four margin questions is a flipped lesson. So is a diagram students annotate before they arrive. Paper also removes the access problem in one move, which is why it is often the right call in a building where home connectivity is uneven.

    One thing has changed since most of this research was done, and it argues for paper rather than against preparation. students are already using AI on work you send home, and a take-home task whose output is a paragraph is now a task a chatbot can finish in seconds. A preparation task that asks for a question the student still has, or a prediction they will test in class, is both harder to outsource and more useful to you when the period starts.

    Clay’s take

    The flipped classroom is a decent idea carrying a reputation it did not earn, and the part worth keeping is not the video.

    The genuinely good argument for flipping has nothing to do with technology. It is that watching students practice is the most useful thing a teacher does with a class period, and most schedules spend that period on the thing a recording could do instead. If flipping one lesson gets you from talking for thirty minutes to circulating for thirty, that is a real improvement whether the effect size is 0.17 or 0.54.

    What does not hold up is the version sold in an in-service, where a single large number appears on a slide with no mention that nine of ten studies behind it were run on college students who chose to be there. Teenagers at eight in the morning are a different population with different incentives, and a model that depends on unsupervised preparation is a model that depends hardest on the students with the least support at home. That is worth saying out loud before a department commits to it.

    So flip selectively and keep the class time. The evidence’s clearest instruction is the one nobody repeats: do not use this to meet less. Everything good about the approach lives in the period you freed up, and if you spend that period the way you spent it before, you have given your students homework and yourself a recording project. The same restraint belongs in the homework policy itself, which holds up better when it sets how often you assign rather than how many minutes it should take.

    What to do next

    Flip one lesson this month. Not a unit and not a semester — one lesson, the one where you talk the most.

    Keep the video under six minutes, attach three questions you actually collect, and write down beforehand what happens for the student with no internet and the student who simply didn’t watch it. Then spend the whole period watching them work, and judge the experiment on whether you saw more of their thinking than usual. That is the only measure that matters here, and it is one you can read the same day.

    Frequently Asked Questions

    What is the flipped classroom model?

    It is an arrangement where first exposure to new material happens before class, usually through a short video or reading, so class time can be spent on practice the teacher can observe. The Flipped Learning Network defines it as direct instruction moving from the group learning space to the individual learning space. Flipping a class does not automatically produce flipped learning.

    Does the flipped classroom improve test scores?

    On average, a little. The largest meta-analyses report effects around 0.35 of a standard deviation, falling to roughly 0.17 to 0.24 once underpowered studies and publication bias are accounted for. One meta-analysis built only on K-12 students reported a larger average of 0.54, but its own author flags publication bias in that set.

    Is the flipped classroom research based on high school students?

    Mostly not. Across the major syntheses, roughly 85 to 90 percent of the evidence comes from higher education. One review found 239 of 272 learning comparisons were university-based against 20 from secondary schools, and its pass-rate analysis contained no school studies at all. Quote those numbers with the population attached.

    What do you do when students don’t watch the video?

    Attach a short task to the preparation that you collect, and plan an opening that works for a split room. Adding quizzes on the pre-class material was one of only two moderators that significantly improved outcomes in a 114-study meta-analysis. Decide in advance what happens for the student who did not prepare, rather than improvising it.

    How long should a flipped lesson video be?

    Under six minutes where possible, and under nine at most. In an analysis of 862 videos and almost 6.9 million viewing sessions, median engagement was at most six minutes regardless of video length, and viewers often stopped less than halfway through videos over nine minutes. That study measured adult online learners, not teenagers.

    Can you flip a classroom without technology?

    Yes. The definition concerns where direct instruction happens, not what carries it. A two-page reading with margin questions, an annotated diagram or a short primer all move first exposure before class. Paper also removes the home-internet problem entirely, which matters most in schools where connectivity is uneven.

    What are the main drawbacks of a flipped classroom?

    Students not preparing, unequal access to devices and internet at home, and the preparation time it costs the teacher. In a survey of 309 college faculty, 75 percent said preparing a flipped class takes more time than a traditional one. The deeper risk is flipping the video but leaving the class period unchanged.

    Does flipping let a school reduce class time?

    The evidence says the opposite. In a meta-analysis of 114 studies, flipped classes that reduced face-to-face time performed significantly worse than their comparison groups, at an estimate of negative 0.26. The benefit of the model lives in what the freed class time is used for, so removing that time removes the mechanism.

    Sources

    • Flipped Learning Network (2014). Definition of Flipped Learning. Page. Source of the March 2014 release, the four pillars, and the statement that flipping a class does not necessarily lead to flipped learning. The full definition sentence was read on a separately hosted copy of the network’s handout.
    • Hutton, A. (2020). The Efficacy of the Flipped Classroom Technique in Undergraduate Math Education: A Review of the Research. arXiv:2010.11393. Full text. Source of the origin history, including Mazur’s peer instruction and the hedged attribution to Bergmann and Sams. Used as a review describing those earlier works, not as a primary account of them.
    • Lage, M. J., Platt, G. J., and Treglia, M. (2000). Inverting the Classroom: A Gateway to Creating an Inclusive Learning Environment. The Journal of Economic Education, 31(1), 30–43. Bibliographic record. Citation verified on a bibliographic record only; the paper itself was not reachable, so no claim about its contents is made here beyond what the review above reports.
    • van Alten, D. C. D., Phielix, C., Janssen, J., and Kester, L. (2019). Effects of flipping the classroom on learning outcomes and satisfaction: A meta-analysis. Educational Research Review, 28, 100281. Full text. Source of g = 0.36, the null satisfaction result, the negative class-time moderator and the positive quiz moderator. 114 studies, of which 11 were secondary education.
    • Låg, T., and Sæle, R. G. (2019). Does the Flipped Classroom Improve Student Learning and Satisfaction? A Systematic Review and Meta-Analysis. AERA Open, 5(3). Full text. Source of the 0.35, 0.24 and 0.17 progression, the satisfaction reversal, and the education-level table showing 239 of 272 learning comparisons in higher education. The authors describe their bias correction as approximate.
    • Zhu, G. (2021). Is flipping effective? A meta-analysis of the effect of flipped instruction on K-12 students’ academic achievement. Educational Technology Research and Development, 69(2), 733–761. Institutional record. The only K-12-only meta-analysis found. Source of d = .54 from 53 effect sizes across 27 studies, the publication-bias flags and I² = 81.2 percent. Read on the author’s university record because the publisher’s page was not reachable; no confidence interval is quoted because none appears there.
    • Kapur, M., Hattie, J., Grossman, I., and Sinha, T. (2022). Fail, flip, fix, and feed: Rethinking flipped learning. Frontiers in Education, 7, 956416. Full text. Source of the 0.19 to 2.29 range across 46 meta-analyses, the authors’ own g = 0.37, I² = 91.27 percent, the publication-bias test, the 90 percent university figure and the observation that most in-class sessions are not modified. The paper’s separate comparison of in-class active learning contains an internal inconsistency and is not used here.
    • Hew, K. F., Bai, S., Dawson, P., and Lo, C. K. (2021). Meta-analyses of flipped classroom studies: A review of methodology. Educational Research Review, 33, 100393. Institutional record. Source of the 19 meta-analyses, the 495-plus primary studies, the 0.19 to 1.13 cognitive range and the six inadequately handled methodological elements. Read on institutional records; the full text was not reachable.
    • Lo, C. K., and Hew, K. F. (2017). A critical review of flipped classroom challenges in K-12 education. Research and Practice in Technology Enhanced Learning, 12. Record. Source of the 15 K-12 publications, the neutral-or-positive achievement finding and the mixed attitudes. Abstract only; the full text was not reachable, so no specific challenge figures are attributed to it.
    • National Center for Education Statistics. Rural Students’ Access to the Internet. Indicator. 2019 American Community Survey data on 5- to 17-year-old students. Source of the 5 percent, 7 percent rural, 11 percent remote rural, 82 and 76 percent broadband, and the 12-versus-2 percent poverty gap.
    • National Center for Education Statistics. Children’s Internet Access at Home. Indicator. 2021 data on 3- to 18-year-olds. Source of the 97 percent, the 4 percent smartphone-only figure, and the page’s own note that a second federal survey put no-access at 12 percent rather than 3 percent because the surveys define access differently.
    • Pew Research Center (2018). Nearly one-in-five teens can’t always finish their homework because of the digital divide. Report. Survey of 743 U.S. teens aged 13 to 17, fielded spring 2018. Source of the 17 percent, 35 percent and 45 percent figures. Pre-pandemic data; no more recent Pew survey on this question was found.
    • Ash, K. (2012). Educators Evaluate ‘Flipped Classrooms’. Education Week. Article. Source of the practitioner quotations on students not watching, “self-paced became no pace,” and flipping as a time-shifting tool. Journalism rather than research, and quoted as such.
    • Reich, J. (2013). Flipping the New York Times. Education Week opinion. Article. Read for its caveats on the widely circulated schoolwide-flip turnaround story, including that the reported gains were internal markers and that enrollment shifted substantially over the same period. No failure-rate figure from that story is repeated here, because no peer-reviewed evaluation of it was found.
    • Faculty Focus (2013). Survey Confirms Growth of the Flipped Classroom. Report. Source of the 75 percent preparation-time figure. 309 higher education faculty, a self-selected 2013 sample whose publisher states the results cannot be projected to the whole population. It is the only quantified preparation-time figure found, and it is not about school teachers.
    • Guo, P. J., Kim, J., and Rubin, R. (2014). How Video Production Affects Student Engagement: An Empirical Study of MOOC Videos. Proceedings of Learning at Scale 2014. Full text. Source of the six-minute median, the nine-minute drop-off, the problem-attempt percentages and the purpose-made-versus-recorded comparison. Population: 127,839 edX learners across 862 videos — self-selected adult online learners, and the outcome is voluntary watch time, not learning.
    • Mayer, R. E. The Future of Multimedia Learning. Journal of Applied Instructional Design, 11(4). Full text. Source of the median effect sizes by principle, including segmenting at 0.67, redundancy at 0.10 and image at 0.20, and of Mayer’s own statement that most of the research has not targeted special populations. The page gives no publication year and reports one principle’s median differently in two places.
    • Edpuzzle. What does Edpuzzle cost? Help center. Source of the free plan’s 20-activity limit. No price is quoted for any paid tier because none appears on the vendor pages that could be read.
    • Khan Academy. Does it cost money to use Khan Academy? Help center. Source of the statement that learning at Khan Academy is always free.
    • Google. Education editions FAQ. Admin knowledge site. Source of the statement that Education Fundamentals is available at no cost for qualifying institutions. The page does not define qualifying institutions and lists no prices for the paid editions.

    About Clay Shumate

    Clay Shumate is a certified secondary Social Studies teacher in the public schools of West Alabama, with seven years of classroom experience, a B.A. in History, and an M.Ed. in Secondary Education. He writes about project-based learning, student responsibility, respect, and practical ways to hold young people to a higher standard while giving them room to learn from mistakes. He is a member of the Society of Professional Journalists and writes to its Code of Ethics; this site’s editorial standards and corrections policy are published in full. More about Clay.

Teacher Emergency Toolkit — practical resources, real classroom support. Shop on TPT.Teacher Emergency Toolkit — practical resources, real classroom support. Shop on TPT.