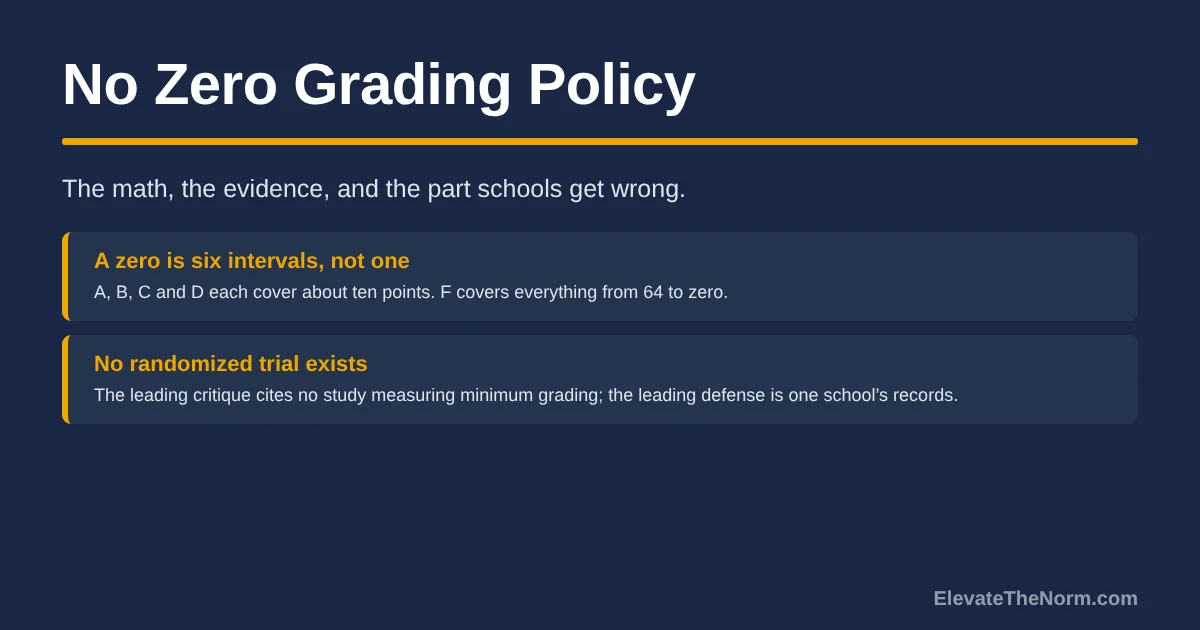
The Elevate Blog banner: Real Classrooms. Practical Ideas. Higher Expectations. Three students climb a rocky ridge at sunrise, each pulling the next one up, toward a teacher reaching down to help.

Tag: standards based grading

  • No Zero Grading Policy: The Math, the Evidence, and the Part Schools Get Wrong

    No Zero Grading Policy: The Math, the Evidence, and the Part Schools Get Wrong

    By Clay Shumate

    A no zero grading policy replaces a score of zero for missing or failed work with a floor, usually 50 on a 100-point scale. It exists because a zero costs a student roughly six letter-grade intervals while every passing grade costs one. The floor fixes that arithmetic. It does not, on its own, get the work done.

    Key Takeaways

    • The argument for a grading floor is arithmetic, not sympathy. On a 100-point scale where 65 passes, the failing band is about two-thirds of the scale while each passing letter grade gets roughly ten points, so a single zero carries a penalty no passing grade can match.
    • The largest study of minimum grading in practice looked at 343,425 sets of grades given to 10,958 students over seven years in one urban high school with a 50 floor, and found no grade inflation. Only 0.3 percent of grade sets started with a minimum grade and ended in a pass.
    • The strongest evidence on the other side is about grading standards, not grading floors. Across 342,098 North Carolina Algebra I students, the strictest-grading quarter of teachers raised same-year test scores by 16.9 percent of a standard deviation over the most lenient quarter.
    • Nobody has run a controlled trial of a no zero grading policy. The leading critique of equitable grading concedes it cites no study measuring the effects of minimum grading itself, and the leading defense comes from one school’s retrospective records. Anyone who tells you the question is settled is selling something.
    • A floor without a required redo is the version that earns the criticism. The policy that holds up pairs the 50 with a recorded reason, a deadline for the real work, and a grade that still says the student has not shown the learning yet.

    Every school argument about zeros collapses into the same two sentences. One side says a zero is the only honest score for work that does not exist. The other says a zero is a punishment dressed up as a measurement. Both sides are partly right, and both sides usually skip the part that decides it, which is what the number does to the average afterward.

    So, in order: what the policy is, the arithmetic that started the fight, what the research on both sides actually found, and the five conditions that separate a defensible floor from a free pass.

    What is a no zero grading policy?

    A no zero grading policy is a grading rule that sets a minimum score for any assignment, so that missing or failed work is entered as that minimum rather than as a zero. On a 100-point scale the floor is almost always 50. The work is still unfinished and the grade is still an F. Only the size of the hole changes.

    Three versions get called by the same name, and they are not the same policy. The first is a bare floor: nothing is entered below 50, and that is the end of it. The second is a floor plus a required redo, where the 50 is a placeholder until the student submits the work. The third replaces the number entirely with an incomplete or a not-yet code until the assignment arrives.

    When a teacher tells you a no zero policy ruined their class, they almost always mean the first version. When an administrator tells you it transformed their school, they almost always mean the second. The two groups are arguing about different rules.

    Why does one zero do so much damage on a 100-point scale?

    A zero is the only score on a 100-point scale that can outweigh a semester of work, because the scale is not evenly divided. A, B, C and D each occupy about ten points. F occupies everything from 64 down to nothing. A zero is not one grade worse than a D; it is about six intervals worse.

    Carifio and Carey put the point plainly in the Mid-Western Educational Researcher: a disproportionate two-thirds of the 100-point scale represents a failing grade, which concentrates every bit of teacher-to-teacher variation at the bottom end of the scale, where it does the most damage. Their summary of the underlying problem is the best sentence written on the subject: “The core and unavoidable problem is the effects of intermittent catastrophic failures.”

    Run the arithmetic on an ordinary grades 6–12 student. Four assignments at 88, 92, 85 and 90 is an average of 88.75, a solid B+. Add one missing fifth assignment and watch what the two choices do.

    Entry for the missing workNew averageLetterPerfect scores needed to climb back to an 80
    Zero71.0C3
    50 floor81.0B0 — already there
    Dropped from the average88.75B+0
    Four scores of 88, 92, 85 and 90, plus one missing assignment. Plain arithmetic, not a finding.

    One missing assignment out of five takes a B+ student to a C, and climbing back to a B takes three more perfect scores that most grading periods do not contain. That is the whole case for the floor, and it is a case about mathematics rather than effort or character. It is also why a four-level scale changes the shape of the problem — though Carifio and Carey note a 0.0–4.0 scale only solves the asymmetry if its minimum is 1.0 rather than zero. The spacing is what matters, not the scale.
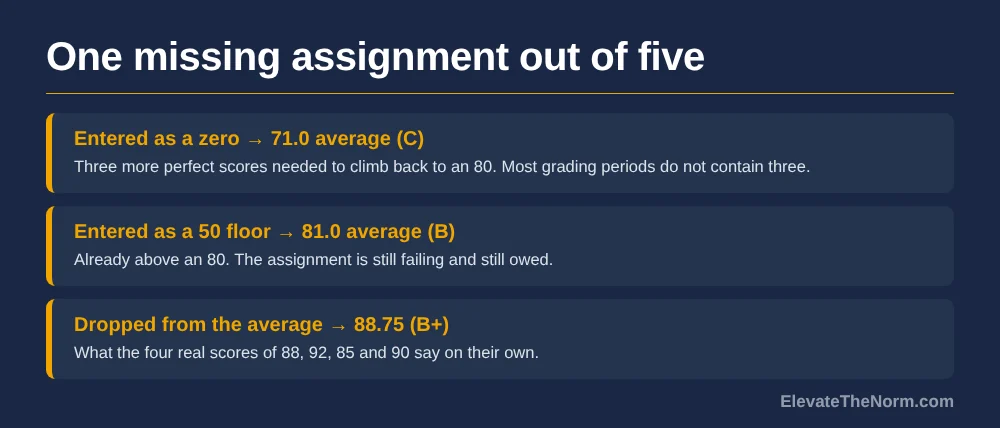
    Comparison graphic showing four assignment scores of 88, 92, 85 and 90 and what happens when a fifth is missing: a zero produces a 71 average requiring three perfect scores to recover, a 50 floor produces an 81, and dropping the score leaves an 88.75.
    Same student, same missing assignment, three different entries.

    What does the research on minimum grading actually show?

    The only large-scale study of a school-wide minimum grade found no grade inflation and almost no social promotion. Carifio and Carey analyzed seven years of grading records from one large urban high school with a 50 floor: 343,425 sets of grades across 10,958 students. They report finding no evidence of grade inflation or social promotion.

    The specific numbers matter more than the headline. Only 1,159 grade sets, about 0.3 percent, began with a minimum grade and ended with a passing grade, which is the exact outcome critics predict and it barely happened. 925 students, 8.4 percent of the school, passed at least one course after receiving a minimum grade somewhere along the way, roughly 142 students a year. The authors also report that after adjusting for GPA, students who received minimum grades outperformed peers who never received one on Massachusetts state exams.

    Now the honest caveats, because this is the study everybody quotes and nobody qualifies. Carifio and Carey are advocates for minimum grading, and the article I read is their own point-counterpoint defense of it. It is one school, retrospective records, and no control condition. The design can tell you what happened in a building that adopted the floor. It cannot tell you that the floor caused it.

    What does the evidence against lenient grading show?

    The strongest evidence against lenient grading is about how hard teachers grade, not about whether zeros are allowed. Seth Gershenson tracked 342,098 eighth and ninth grade Algebra I students across about 8,000 North Carolina teachers over ten years and found that students of the strictest-grading quarter of teachers scored 16.9 percent of a standard deviation higher on the end-of-course exam than students of the most lenient quarter.

    The effect carried forward. Those students scored 7.3 percent of a standard deviation higher in Geometry a year later and 8.6 percent higher in Algebra II two years later. It held across subgroups at roughly the same size: 8.2 percent for Black students, 10.3 percent for white students, 10.4 percent for Hispanic students, with the subgroup differences not statistically significant. The effect was slightly larger in less-affluent schools than in more-affluent ones.

    That is a serious result and I am not going to soften it. But read what the study says about its own reach. Gershenson states that “the mechanism that leads from higher standards to higher performance is not clear,” and the report does not study no-zero or grade-floor policies at all. Its only mention of them sits in the implications section as a policy argument, not a tested finding. Grading harder on the work students do hand in is a different variable from what you enter when they hand in nothing.

    The fullest critique of the wider equitable-grading movement comes from Meredith Coffey and Adam Tyner at the Thomas B. Fordham Institute, and it is worth reading because it is specific. They assemble real evidence that grades have drifted from achievement: an average ACT-tested GPA of 3.4 in 2021, the highest on record, against composite scores at their lowest since 2010, and TNTP’s finding that students earned the same grade or better in 2022 as in 2019 despite losing about five months of learning. They also cite Figlio and Lucas on stricter-grading teachers producing greater test-score growth, and Babcock’s finding that college students expecting a C studied about 50 percent more than those expecting an A.

    And then they concede the thing the headlines left out. The brief cites no study measuring the effects of minimum grading itself, acknowledges that “it is difficult to quantify the impact of these specific grading reforms on national grading standards,” and allows that “some grading reforms may benefit students.” Its strongest line against the reforms, that there is “not an iota of hard evidence” they help long term, is a claim about missing evidence rather than a finding of harm.

    So the state of the field is this. Nobody has randomized a no zero grading policy. One side has a large retrospective study from an advocate. The other side has strong evidence about a related but different variable and an openly stated absence of evidence about this one. That is not a tie, and it is not a victory. It means the decision has to be made on design and on values, with the evidence informing it rather than deciding it.
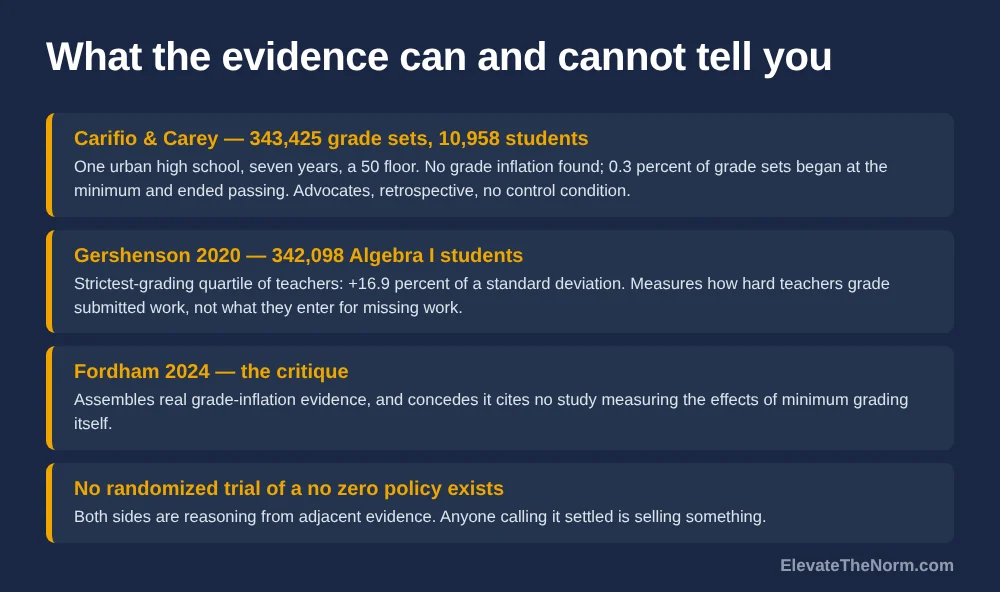
    Four rows summarising the no zero grading evidence and naming each sample: Carifio and Carey's 343,425 grade sets in one urban high school, Gershenson's 342,098 North Carolina Algebra I students at 16.9 percent of a standard deviation, the Fordham brief's concession that no study measures minimum grading, and the absence of any randomized trial of the policy.
    Every sample named, including what each one cannot tell you.

    Does a no zero grading policy mean students stop being accountable?

    A floor removes one consequence, and if nothing replaces it, accountability does drop. That is the legitimate complaint and it should not be waved away. Teachers at Leominster Public Schools in Massachusetts concluded that “kids just weren’t learning to be responsible” and the district rescinded its policy, and one teacher in the same reporting described students who could “take half of a year off and still pass.”

    Notice what those complaints are about. Not the number 50 — the missing second half of the policy. A 50 that requires nothing is a gift; a 50 that holds a slot open until the work arrives is a deadline with a different shape. There is also a real argument that a zero was never much of a consequence to begin with. Sarah Duncan of the University of Chicago’s Network for College Success noted in the same reporting that students who get an F tend to withdraw, because “they interpret an F as ‘You do not belong in this environment.’” A consequence that makes a student quit is working as an exit, not a consequence.

    What should a no zero grading policy actually require?

    Five conditions separate a defensible floor from a free pass, and all five are about what happens after the 50 goes in the book. A policy with the floor and none of the rest is the version that gets rescinded two years later. The same test decides whether bonus work belongs in a grade at all: points that measure something other than the standard move the number without moving the learning it reports.

    1. Code every 50 so it says something. A 50 with no explanation tells a student and a parent nothing. Gradebook codes do the work: not mastered, absent, not handed in, did not attempt. One teacher in the Edutopia reporting uses exactly those four so families can see which problem they are looking at. A 50 for a genuine attempt and a 50 for a blank page are different situations wearing the same number.
    2. Keep the floor an F. A 50 on a scale where 65 passes is still failing. If the policy is being sold as protecting students from failure, it is being sold wrong. It protects them from a specific arithmetic distortion, which is a smaller and more defensible claim.
    3. Attach a real deadline to the real work. The floor should hold a place, not close a case. Publish one window, say what happens at the end of it, and hold the line you published. The deadline question deserves its own policy, and the two rules have to agree with each other or students will find the gap in about a week.
    4. Separate the grade from the behavior. If the concern is responsibility, record responsibility somewhere a grade cannot swallow it. Mixing a measure of learning with a measure of compliance produces a number that answers neither question, which is the same problem standards-based grading is built to solve.
    5. Name who keeps using it, and watch the pattern by group. Track which students take the floor repeatedly. Three 50s in a semester is a student who needs something other than a grading rule, and the floor is doing its job only if it buys time for somebody to notice. Run the same count by student group, because a floor applied far more often to one group is either catching a real inequity or hiding one, and you cannot tell which without looking.

    One thing a grading floor genuinely costs you, and the reason the reason codes in condition one are not optional: a 50 is not a measurement. It is a placeholder entered where no evidence exists. A gradebook with nine real scores and one 50 still tells you what the student can do. A gradebook with four real scores and six 50s has stopped being a record of learning, and no amount of averaging will tell you which standard the student missed. That is the strongest objection to the policy and it has nothing to do with accountability. It is why the incomplete or not-yet version is cleaner on the measurement question, and why a floor without reason codes destroys information a teacher needs.

    And one logistical fact that decides whether any of this survives contact with a building: most gradebooks cannot enforce a floor automatically. If the rule depends on every teacher remembering to type 50 instead of 0, the policy will be applied unevenly within the same hallway by November. Check what the software can actually do before the policy is announced, not after.
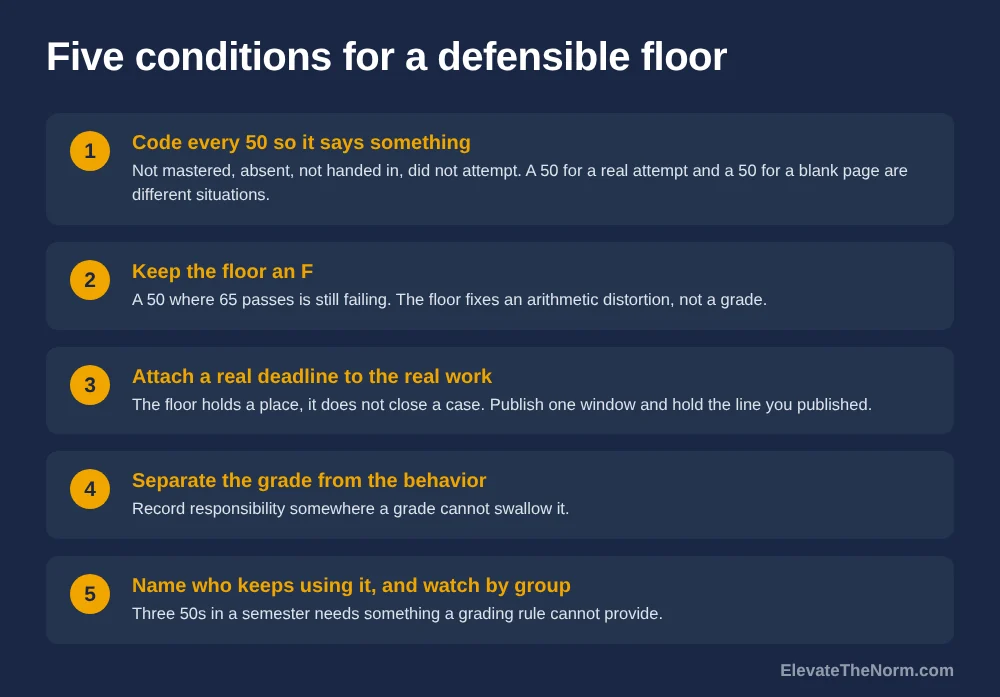
    Numbered graphic of five conditions for a defensible no zero grading policy: code every 50, keep the floor an F, attach a real deadline to the real work, separate the grade from the behavior, and name who keeps using it.
    Five conditions. The floor on its own is none of them.

    How do you explain a no zero grading policy to a parent who thinks it is soft?

    Lead with the arithmetic and never with the compassion. A parent who hears “we did not want him to feel bad” has every reason to object. A parent who hears “one missing assignment was costing him three perfect scores to recover from, and he is still failing that assignment” is being told something checkable.

    Then say the part most schools skip. The 50 is not the grade for the work; it is the grade for the absence of the work, and it is still an F. The assignment is still due. If the policy does not include that second sentence, the parent is right to push, and the way the message is written decides how the conversation goes more than the policy does.

    The harder parent to answer is the one whose child does every assignment on time. That parent is not asking about arithmetic; they are asking why the gap between their child and a classmate who turned in nothing just got smaller. The honest answer is that it did, by ten points on one assignment, and that their child’s grade is unchanged while the classmate is still failing that assignment and still owes the work. If the policy has no redo requirement, there is no good answer to give that parent, which is another reason the second half of the rule is not optional.

    What does this look like from the student’s side?

    Students read a grading floor as information about whether recovery is possible. That is the honest reason it changes behavior when it changes behavior at all. A student at 71 with three assignments left can do the math and see a path; a student who did the same math and found no path has already decided what the rest of the semester is worth. They also read it as information about whether the adults are consistent, and a floor announced in August and quietly ignored in October is worse than no floor at all.

    And the students who do all the work have a fairness complaint of their own, which deserves a straight answer rather than a lecture about empathy. They notice when a classmate gets fifty points for a blank page. The answer is that the classmate is still failing that assignment, still owes it, and gets no credit until it arrives — and that the student asking is owed the same consistency everyone else is getting. A policy you cannot defend to a sixteen-year-old who did the work is not ready.

    What should a school decide before mandating this?

    A district adopting a floor is making three decisions at once, and most adopt the first and skip the other two. The number, what it obligates the student to do next, and what it obligates the school to do next — which is where the staffing and the money live.

    Carifio and Carey estimate the school they studied saved roughly $1 million over seven years in avoided course repeats, summer school and credit recovery. Treat that figure carefully: it is one school, it is the authors’ own estimate, and savings assume the students who passed had actually learned enough to move on. But it does mean the cost conversation runs in both directions, which is not how the policy usually gets presented to a board.

    Two decisions usually get made by default instead of on purpose. The first is whether teachers keep any discretion. A mandate that strips judgment from every teacher in the building will be worked around, and a rule everyone quietly works around is worse than either option honestly chosen. The second is who chases the redo. The required-work half of the policy is real labor — tracking, reminding, re-collecting, re-grading — and if the answer is “the classroom teacher, on top of everything else,” say so out loud when the policy is announced rather than letting people discover it in week three.

    One compliance item to check before adopting, not after: how the floor interacts with transcripts, GPA calculation and anything your state reports. A grading rule that changes course averages changes the number colleges see, and a district that cannot explain the relationship between its floor and its transcripts has created a problem for its own counselors.

    Clay’s take

    My position starts somewhere slightly different than the research. If a student can fail that badly in my room, the first question is what the planning looked like, and the second is what I was doing for the three weeks it took to get there. A zero that accumulated quietly over a grading period is usually a record of adult inattention as much as student choice.

    So the floor is not the interesting part of this policy. The redo requirement is, and a school that adopts the 50 without it has bought the criticism and none of the benefit. Give a teenager a path back and most of them take it; give them arithmetic saying the semester is already over and some of them believe you. And the honest answer to “what does the research say” is that the research has not been done — which teachers deserve to hear instead of a confident number from whichever side asked first.

    The redo requirement is easier to honor when a second version of the assessment already exists. For the big one at the end of the semester, Mid-Terms.org publishes 200 free printable midterms with answer keys for grades 6–12, and every course comes as a Form A and a Form B, so the student who takes the floor in December has a different paper waiting when the work comes due.

    What to do next

    Pull your own gradebook and find one student whose average is held down by a single zero. Run the arithmetic above on that student and see how many perfect scores recovery would take. If the answer is more assignments than the grading period contains, you have found the problem the floor is built for.

    Then decide the second half before you decide the number. What does the student owe, by when, and what happens when the work arrives? If you cannot answer those three questions, the floor is not ready to adopt. Next, read the late work policy that has to agree with it and the objections to standards-based grading taken seriously, because every real version of this fight ends up in one of those two places. Everything on this site is free and nothing asks for your email address.

    Frequently Asked Questions

    What is a no zero grading policy?

    A no zero grading policy sets a minimum score for any assignment, usually 50 on a 100-point scale, so missing or failed work is entered as that minimum instead of a zero. The grade is still an F and the assignment is still owed. The rule changes only how far a single missing assignment can drag an average down.

    Does a no zero grading policy cause grade inflation?

    The largest study available says no. Carifio and Carey examined 343,425 sets of grades for 10,958 students across seven years in one urban high school with a 50 floor and reported no evidence of grade inflation or social promotion, with only 0.3 percent of grade sets starting at the minimum and ending in a pass. It is one school, retrospective, and written by advocates.

    Why is a zero considered mathematically unfair?

    Because the 100-point scale is not evenly spaced. A, B, C and D each cover about ten points while F covers everything from 64 to zero. That makes a zero roughly six letter-grade intervals below a D rather than one, so a single zero can outweigh several strong scores in a way no passing grade ever can.

    Is there research proving no zero policies help students?

    No. There is no randomized trial of a no zero grading policy. The Fordham Institute’s critique of equitable grading concedes it cites no study measuring the effects of minimum grading itself, and the main study in favor is retrospective records from a single school. Both sides are reasoning from adjacent evidence.

    Does strict grading produce better results than a grading floor?

    Strict grading standards do have strong evidence behind them, but on a different question. Gershenson found that across 342,098 North Carolina Algebra I students, the strictest-grading quarter of teachers raised end-of-course scores by 16.9 percent of a standard deviation. That study measures how hard teachers grade submitted work, not what they enter for missing work.

    What should replace a zero if you do not use a 50?

    An incomplete or not-yet code with a required submission date is the cleanest alternative, because it withholds a number rather than inventing one. Some teachers record the true score on the paper and a 50 in the gradebook with a reason code attached. The common requirement in every workable version is that the real work is still owed.

    How many 50s should one student be allowed?

    Set a count and watch it rather than leaving it open. A student taking the floor three times in a semester needs something a grading rule cannot provide, and the point of the floor is to buy time for an adult to notice. A policy with no counting mechanism cannot tell the difference between a bad week and a pattern.

    Sources

    • Carifio, J., & Carey, T. (2013). The arguments and data in favor of minimum grading. Mid-Western Educational Researcher, 25(4), 19–30. Seven years of grading data from one large urban high school with a 50 minimum: 343,425 sets of grades, 10,958 students; 0.3 percent of grade sets began at the minimum and ended passing; 925 students (8.4 percent) passed at least one course after a minimum grade; estimated savings of roughly $1 million over seven years. The authors advocate for minimum grading, the design is retrospective with no control condition, and it is a single school. Reports the figures of their own 2012 Educational Researcher study, 41(6), 201–208.
    • Gershenson, S. (2020). Great Expectations: The Impact of Rigorous Grading Practices on Student Achievement. Thomas B. Fordham Institute. 342,098 eighth and ninth grade Algebra I students, about 8,000 teachers, North Carolina, 2006–2016. Top grading-standards quartile versus the lowest: +16.9 percent of a standard deviation same-year, +7.3 percent in Geometry, +8.6 percent in Algebra II. Subgroup effects 8.2–10.4 percent, differences not significant. No effect on graduation. The study does not examine no-zero or grade-floor policies; its mention of them is a policy argument in the implications section. Author states the mechanism is unclear.
    • Coffey, M., & Tyner, A. (2024). Think Again: Does “equitable” grading benefit students? Thomas B. Fordham Institute. Assembles the grade-inflation evidence (ACT 2023: average GPA 3.4 against composite scores at a post-2010 low; TNTP False Signals; CALDER and Brookings grade-versus-test gaps) and cites Figlio and Lucas (2004), Gershenson (2020) and Babcock (2010) for stricter standards. Concedes it cites no study measuring the effects of minimum grading itself, that quantifying the reforms’ impact is difficult, and that “some grading reforms may benefit students.”
    • Minero, E. (2018). Do no-zero policies help or hurt students? Edutopia. Cited as practitioner reporting, not a study. Source of the Leominster Public Schools rescission, the gradebook reason-code practice, and Sarah Duncan’s observation that students read an F as not belonging. Describes the 50-percent floor as implemented in districts including Fairfax County and Philadelphia.
    • Minimum grade / grading scale (book excerpt, “Equitable Grading Practices,” p. 84). Corwin. Read as an excerpt; the excerpt does not name its author and ends mid-argument. Sets out the two alternatives — raise the minimum or change the scale — and carries Guskey’s (2004) explanation that secondary teachers keep the zero partly so students feel a consequence. Also cites Reeves (2004).
    • Arithmetic in the table and the recovery counts is my own calculation from the four stated scores, not a finding from any source above.
    About Clay Shumate

    Clay Shumate is a certified secondary Social Studies teacher in the public schools of West Alabama, with seven years of classroom experience, a B.A. in History, and an M.Ed. in Secondary Education. He writes about project-based learning, student responsibility, respect, and practical ways to hold young people to a higher standard while giving them room to learn from mistakes. He is a member of the Society of Professional Journalists and writes to its Code of Ethics; this site’s editorial standards and corrections policy are published in full. More about Clay.

  • Standards Based Report Card: How to Read One in Grades 6–12

    Standards Based Report Card: How to Read One in Grades 6–12

    By Clay Shumate

    A standards based report card reports a separate mark for each learning standard in a course instead of one averaged grade for the whole class, and it reports work habits like effort and homework completion on their own scale. The point is to show what a student can actually do, and to stop behavior from hiding inside an academic grade.

    That is the whole idea in two sentences. Everything else — the four-point scale, the proficiency labels, the column of standards running down the page — is machinery built to deliver it. This page covers what the marks mean, what the research supports and what it does not, what colleges do with one, and how to read a card in about five minutes without a meeting.

    Key Takeaways

    • A standards based report card separates two things a traditional grade blends together. Academic achievement goes in one place, work habits and behavior go in another, and neither one is allowed to quietly move the other.
    • Parents who have actually received one tend to prefer it. Swan, Guskey and Jung surveyed 115 parents in a district that sent home both forms for two marking periods, and reported that parents overwhelmingly preferred the standards based form. The 383 teachers they surveyed were positive but significantly less so.
    • 🔴 Traditional grades really are carrying things that are not learning. In one high school math study of 795 students, 43.2 percent of semester grades moved by 5 percent or more once homework and employability points were included, and 12.6 percent moved by a full letter grade.
    • Most middle and high schools have not switched. Plenty of districts run a standards based report card in elementary school and go straight back to letter grades in grades 6 through 12.
    • 🔴 The format does not fix itself. Guskey has reported that many parents simply read standards based labels as letter grades — a 4 becomes an A, a 2 becomes a D — which puts the card right back where it started.

    Free Download · PDF

    Standards Based Report Card Reading Sheet

    A two-page printable: a worksheet for your district’s scale key, the five-minute read, a tracker for the two lowest standards, and an eight-item teacher checklist for the first card.

    Download the free PDF

    Free. No email address required. Designed for grades 6–12. Browse every printable in Your Free Library.

    What is a standards based report card?

    A standards based report card is a report card that lists the individual learning standards in a course and gives each one its own mark, rather than averaging everything into a single grade per subject. Work habits — effort, participation, homework completion, meeting deadlines — are reported on a separate scale so they never move the academic mark.

    One practical limit comes with it: a course can have forty standards, and a report card that lists forty marks is unreadable. A workable card reports a short list of priority standards — the ones the course is actually built on — and leaves the rest to the gradebook. If a card is unreadable, it has failed at the one job it has.

    A traditional card tells you a student earned an 84 in science. A standards based card tells you the student is proficient at analyzing data, proficient at designing an investigation, and not yet proficient at explaining a model in writing. Those are three different problems, and the 84 hides all three of them. If you want the longer version of the grading philosophy underneath this, that is covered in the guide to standards based grading.

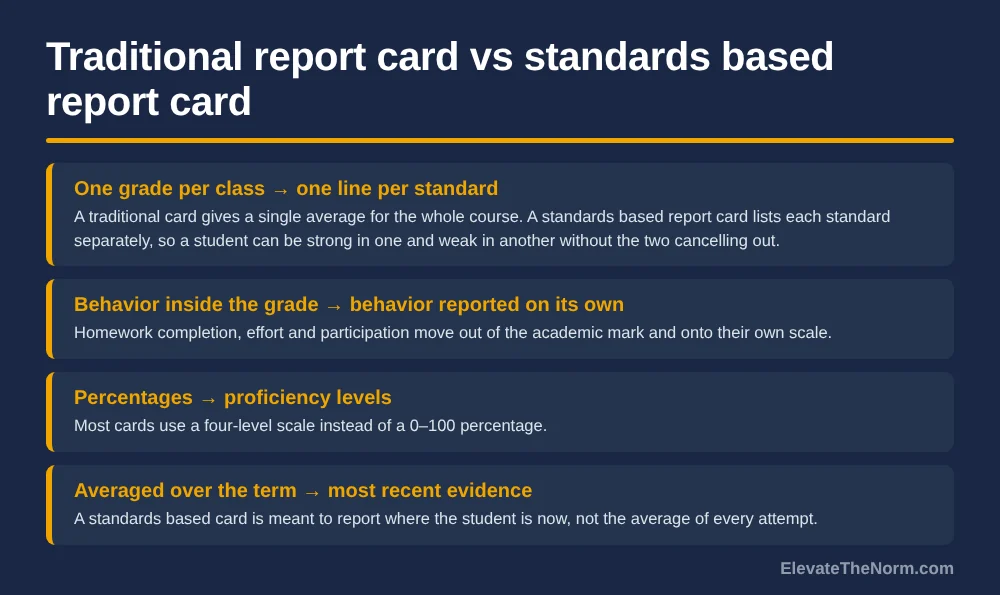
    Four rows comparing a traditional report card with a standards based report card: one grade per class versus one line per standard, behavior inside the grade versus reported separately, percentages versus proficiency levels, and term averages versus most recent evidence
    Four changes. The second one is the one families notice first.

    How is a standards based report card different from a traditional one?

    Four things change: one grade per class becomes one mark per standard, behavior moves out of the academic grade and onto its own line, percentages become proficiency levels, and the mark is meant to describe where the student is now rather than the average of every attempt across the term.

    That last one is the quiet change, and it is the one that causes the most arguments. On a traditional card, a bad September follows a student through December because it sits in the average. On a standards based card it is not supposed to, because the question is whether the student can do the thing now. Whether a given district actually implements it that way is a different matter, and worth asking about directly.

    What you are looking atTraditional report cardStandards based report card
    Unit of reportingOne grade per courseOne mark per standard within the course
    ScaleA–F, usually from a 0–100 percentageUsually four levels, described in words
    Homework and effortFolded into the academic grade as pointsReported separately, on their own scale
    How evidence is combinedAveraged across the termWeighted toward the most recent evidence
    What a parent can act on“Bring the 74 up”“Two standards are at a 2 — here they are”
    What it costs the teacherLess time, less informationMore time entering and defending marks

    What do the marks on a standards based report card mean?

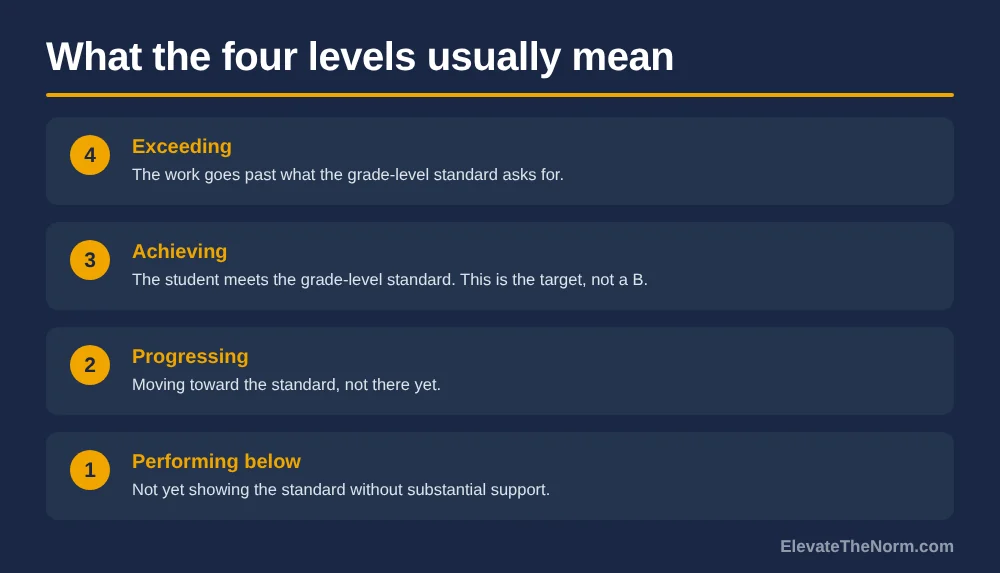
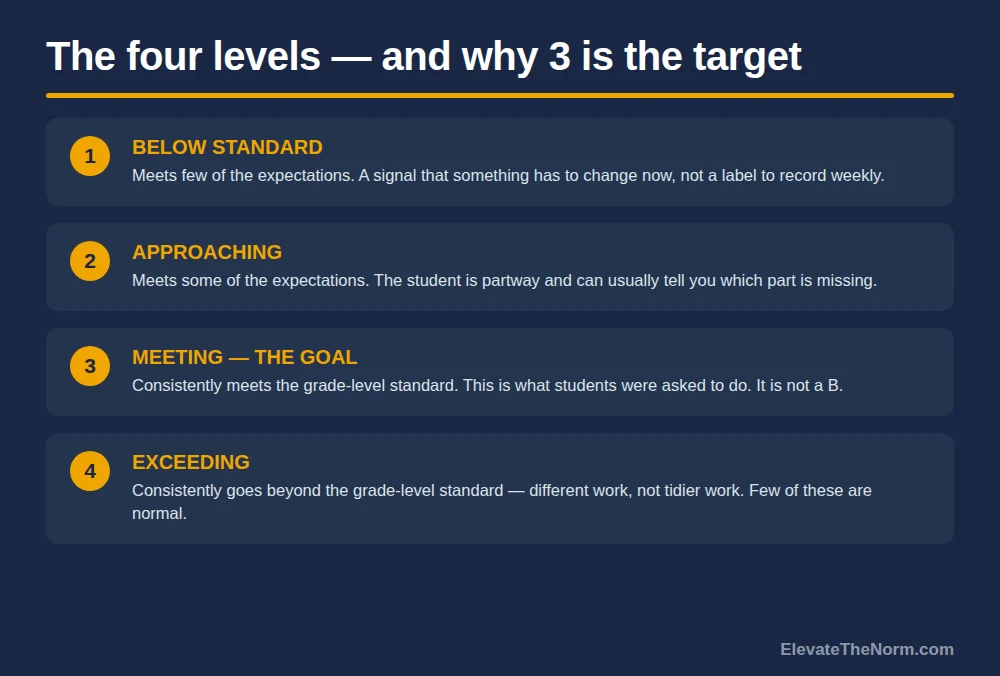
    Most standards based report cards use a four-level scale where the top level means the work goes beyond the grade-level standard, the second level means the student meets it, and the bottom two mean the student is approaching it or not yet showing it. The second level is the target. It is not a B.

    The exact words change from district to district, which is why the scale key is the first thing to read. One Massachusetts district’s parent guide for its sixth-grade card uses “Exceeding,” “Achieving,” “Progressing” and “Performing Below” for academics, and a separate frequency scale — “Consistently,” “Often,” “Sometimes,” “Infrequently” — for a section called Growth as a Learner (Lincoln Public Schools). Another district five miles away will use four different words for the same four ideas.

    Four numbered cards defining the levels on a standards based report card: 4 exceeding, 3 achieving, 2 progressing, 1 performing below
    The 3 is the target. Treating it as a B is the most common misread there is.

    Here is the part worth saying plainly to a student: a 3 is not a consolation prize. The standard is the thing the course exists to teach, and meeting it is the job. A 4 usually requires work that goes past what the standard asks, and on a well-built card there is not a 4 available on every single line. If your district converts those levels back to percentages for a transcript, the mechanics of that are covered in the guide to the 1–4 grading scale.

    Why do most middle and high schools still use letter grades?

    Because the transcript, the GPA, class rank, athletic eligibility, scholarship formulas and the course catalog are all built on letter grades, and a single school changing its report card does not change any of those. The further a student gets from kindergarten, the more systems a new reporting format has to survive contact with.

    You can see the split inside individual districts. Park Hill School District in Missouri, for example, states plainly that all of its elementary schools use a standards based report card on a four-point scale, while its middle and high schools use traditional letter grades. The Massachusetts guide above does something similar: a four-level academic scale in sixth grade, then letter grades in seventh and eighth with effort and participation scored separately.

    There is a cost side to it too. Changing a report card is not a form change — it is a student information system reconfiguration, a training cycle for every teacher in the building, a rewrite of the family-facing key, and a new school profile for colleges. Districts that have done it describe it as multi-year work, and the teachers surveyed below said it took more of their time once it landed.

    That pattern is not hypocrisy. It is a reasonable response to the fact that a sixth-grade report card has to satisfy one audience and an eleventh-grade transcript has to satisfy a dozen. It does mean that if you teach grades 6 through 12 and your school is talking about this, the conversation you are actually having is about the transcript, not the report card.

    Does a standards based report card actually tell you more?

    On the evidence available, yes about communication and separation of behavior from achievement, and much less clearly about achievement itself. The strongest claim the research will support is that a traditional grade is a mixture of several things, and that a standards based card at least shows you the pieces.

    The mixture is well documented. The review “A Century of Grading Research” in the Review of Educational Research reports that grades correlate with standardized achievement tests at about .5 — meaning roughly a quarter of the variation in grades is shared with the tested skill and about three quarters comes from somewhere else. The review calls what teachers actually do “hodgepodge” grading: achievement mixed with effort, improvement, behavior and attitude, weighted differently by every teacher in the building.

    The sharpest single number comes from a high school study. Griffin and Townsley analyzed semester math grades for 795 students at one urban high school and compared each final grade against the student’s summative assessment score. Including homework and employability points moved 43.2 percent of grades by 5 percent or more, and 12.6 percent by 10 percent or more — a full letter grade. That is one school and one subject, so do not treat it as a national rate. It is still a hard number on a claim that usually gets argued with anecdotes.

    On preference, Swan, Guskey and Jung ran the cleanest test available: a district sent parents both a traditional and a standards based report card for two marking periods, then asked which they preferred. Parents overwhelmingly chose the standards based form. The 383 teachers surveyed in two neighboring districts were positive but significantly less enthusiastic, and said it took more time. Worth noting honestly: the published abstract and the ERIC record do not specify the grade levels of those students, so I would not claim this as a secondary-school result.

    What does a standards based report card get wrong?

    Three things, consistently: parents translate the levels back into letter grades anyway, teachers keep slipping effort into the academic mark, and the marks themselves only line up moderately with independent measures of the same learning.

    The translation problem is the one nobody plans for. The same century-of-grading review notes Guskey’s finding that many parents interpreted standards based labels as letter grades — a 4 read as an A, a 2 read as a D. If that happens, the card has added a decoding step and changed nothing. The fix is not a better scale. It is the key, the first conference, and saying the words “a 3 means your kid met the standard” out loud more times than feels necessary.

    The implementation problem is worse. The same review reports that teachers using standards based systems often continue mixing effort and improvement into achievement marks, and that implementation varies widely from classroom to classroom. And on alignment, eight studies comparing standards based grades with standards-based test scores found only moderate relationships, stronger in writing and math than in reading. A separate mark per standard is not automatically a more accurate mark per standard. The honest critiques of the whole model are worth reading before you argue for it; there is a full page on why standards based grading does not work for people who want the other side.

    My read, as a grades 6–12 teacher: the reporting format is not the reform. Separating behavior from achievement is the reform, and you can do most of it on a traditional report card by refusing to put homework completion points inside the academic grade. The card is a way to make that honest. It is not a substitute for making it honest.

    Will a standards based report card hurt a student’s college chances?

    There is no evidence that it does, as long as the school sends a clear profile explaining its scale. The Great Schools Partnership collected statements from 85 public and private colleges and universities across New England saying that students with proficiency-based grades and transcripts will not be disadvantaged in any way in admissions.

    Two caveats belong with that number. Those statements come from one region, gathered during a period when several New England states were moving to proficiency-based graduation, so they are not a national guarantee. And every one of them is conditional on the school explaining itself — the statements assume the program and policies are accurately presented and clearly described, which in practice means a school profile document that an admissions reader can interpret in under a minute. The exemplar transcript the same organization publishes still carries a cumulative GPA alongside the proficiency information, which tells you what the market actually required.

    If you are a parent, the question to ask the counselor is not “will this hurt him.” It is “what does our school profile say, and can I see it.”

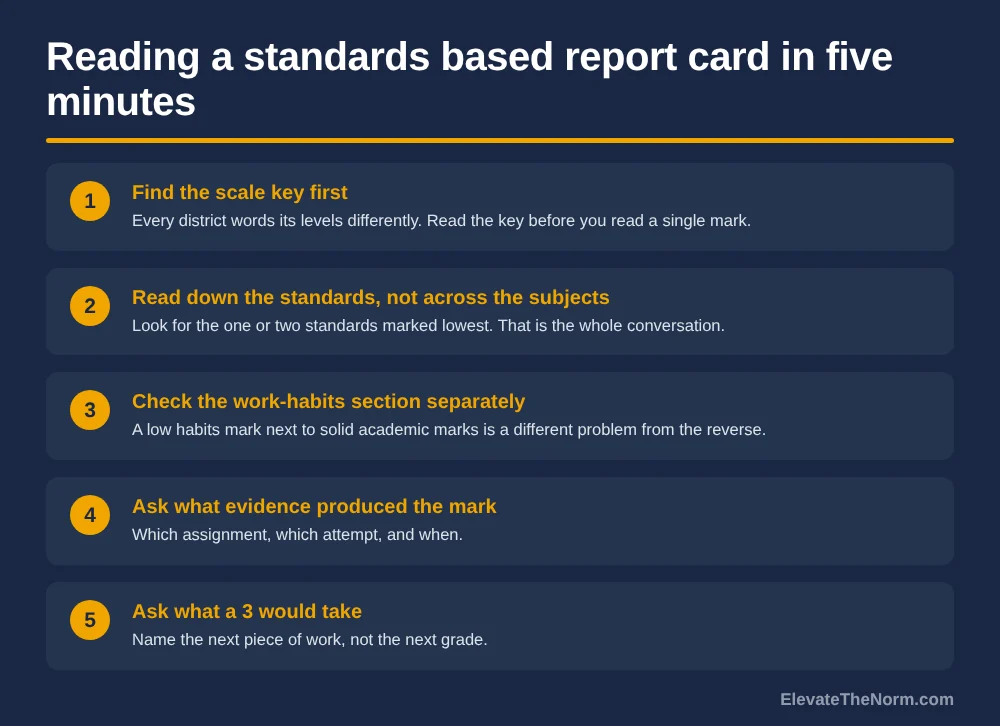
    Five numbered steps for reading a standards based report card: find the scale key, read down the standards, check work habits separately, ask what evidence produced the mark, and ask what a 3 would take
    Five minutes, in this order. Step three is where most of the real information is.

    How do you read a standards based report card in five minutes?

    Find the scale key, read down the list of standards instead of across the subjects, check the work-habits section on its own, then ask the teacher two questions: what evidence produced the lowest mark, and what it would take to move it. That is the entire process.

    1. Find the scale key first. It is usually on the back or the bottom. Every district words its levels differently and the words matter more than the numbers. Do not read a single mark until you have read the key.
    2. Read down the standards, not across the subjects. You are not looking for an overall impression. You are looking for the one or two lines marked lowest. Those are the conversation.
    3. Read the work-habits section separately, and treat it as separate. Strong academic marks beside weak habits marks is a student who knows the content and is not turning things in — a completely different problem from the reverse, and it needs a completely different response. A habits mark is still a written judgment about a teenager, so it should rest on something countable like work submitted on time, not on whether the student seemed engaged.
    4. Ask what evidence produced the mark. Which assignment, which attempt, how recent. A mark based on one quiz in September is not the same claim as a mark based on three pieces of work in November.
    5. Ask what a 3 would take. Make the teacher name a specific next piece of work rather than a target number. If the answer is “study more,” the mark is not yet attached to anything the student can act on.

    Teachers: those same five questions are the ones you should be able to answer before the card goes out. If you cannot say which evidence produced a mark, the mark is not defensible, and the first parent who asks will find that out.

    What should a teacher do before the first standards based report card goes home?

    Six things, and none of them are about software. The card fails on communication far more often than it fails on mechanics.

    • Read your district’s grading policy before you change anything. Some of what follows is a local policy decision, not a classroom one, and finding that out after the card goes home is the hard way.
    • Write the scale key in your own words and send it before the card, not with it. A key that arrives attached to a grade gets read as an excuse, and it should go out in the languages your families actually read.
    • Say the sentence “a 3 means your student met the standard” in writing, early, and more than once. This is the Guskey translation problem and it is predictable, so pre-empt it.
    • Check that nothing in your academic marks is behavior. Late penalties, participation, completion points. If they are in there, pull them out and put them in the habits section where parents can see them honestly.
    • Be able to name the evidence behind every mark. Two or three pieces per standard, recent, and recorded somewhere you can find in ten seconds. The standards based gradebook guide covers how to set that up without doubling your workload.
    • Decide in advance what a reassessment costs and say it out loud. “You can show me again” is only credible if the conditions are fixed before anyone needs them.
    • Tell families how to reach you and what you will answer. A new report card generates questions, and a predictable reply beats a fast one. There is a full guide to parent communication if you want a system rather than an inbox.

    What to do next

    If you are a parent holding one of these for the first time: find the key, find the lowest two standards, and email the teacher one question — what evidence produced that mark and what would move it. That email is worth more than a conference you schedule three weeks from now.

    If you are a teacher: before you argue for a new report card, look at how much of your academic grade is behavior. Check your district’s grading policy first — in some places the weighting is yours and in some places it is not — and then pull out what you are allowed to pull out. That is the part that actually changes what a grade means, and if you are not willing to do it on your current card you will not do it on a new one either. The 795-student study above is what the alternative looks like in numbers.

    If you are the student holding the card: read it yourself before anyone reads it to you. This is the one format that tells you something you can actually use — not a number to feel bad about, but a short list of things you cannot do yet, with your name on it. Pick the lowest line, go ask the teacher what evidence put it there and what would move it, and ask it in person. You will get a better answer than your parents will get by email, and it is your transcript.

    And if your school is in the middle of the switch, ask to see the school profile that will go to colleges. If nobody has written it yet, that is the job that is actually late.

    Want this as a printable? The scale-key worksheet, the five-minute read, the two-standards tracker and the teacher checklist, on two printable pages. Download the free PDF — no email address required.

    Frequently Asked Questions

    What is a standards based report card?

    It is a report card that gives a separate mark for each learning standard in a course instead of one averaged grade per subject, and reports work habits such as effort, participation and homework completion on their own scale. Instead of an 84 in science, a family sees which specific skills the student has met and which ones are not there yet.

    What do the numbers 1, 2, 3 and 4 mean on a standards based report card?

    Most four-level scales run from not yet showing the standard up to exceeding it, with the third level meaning the student meets the grade-level standard. The exact wording changes by district — one Massachusetts guide uses Exceeding, Achieving, Progressing and Performing Below. Read your district’s scale key before reading a single mark, because the words carry the meaning, not the numbers.

    Is a 3 on a standards based report card the same as a B?

    No, and treating it as one is the most common misread there is. On most cards the third level means the student met the grade-level standard, which is the target the course was built around. The top level usually requires work that goes beyond what the standard asks, and on a well-built card it is not available on every line.

    Do standards based report cards hurt college admissions?

    There is no evidence that they do when the school explains its scale. The Great Schools Partnership collected statements from 85 New England colleges and universities saying proficiency-based transcripts will not disadvantage applicants, conditional on the school presenting its program clearly. Those statements come from one region, so the practical step is to ask your counselor to show you the school profile that goes to colleges.

    Why do middle and high schools still use letter grades if standards based report cards are better?

    Because the transcript, GPA, class rank, athletic eligibility and scholarship formulas are all built on letter grades, and one school changing its report card does not change any of those. Many districts run standards based cards in elementary school and switch back to letter grades in grades 6 through 12 for exactly that reason. The real conversation in secondary school is about the transcript.

    How do I tell how my child compares to the rest of the class?

    You usually cannot, and that is deliberate. A standards based report card measures a student against the grade-level standard rather than against classmates, so there is no curve and no rank built into it. If you want a comparison, ask the teacher how many students are at each level on the standard you are worried about rather than asking where your child sits.

    Do parents actually prefer standards based report cards?

    The parents who have received one generally do. Swan, Guskey and Jung surveyed 115 parents in a district that sent home both a traditional and a standards based card for two marking periods and reported that parents overwhelmingly preferred the standards based form. The 383 teachers they surveyed were positive but significantly less so, and said it took more time.

    Sources

    1. Swan, G. M., Guskey, T. R., & Jung, L. A. (2014). “Parents’ and teachers’ perceptions of standards-based and traditional report cards.” Educational Assessment, Evaluation and Accountability, 26(3), 289–299. 115 parents, 383 teachers; grade levels not specified in the published abstract or ERIC record. link.springer.com
    2. Brookhart, S. M., Guskey, T. R., Bowers, A. J., McMillan, J. H., Smith, J. K., Smith, L. F., Stevens, M. T., & Welsh, M. E. (2016). “A Century of Grading Research: Meaning and Value in the Most Common Educational Measure.” Review of Educational Research, 86(4). Source for the .5 correlation with achievement tests, “hodgepodge” grading, the moderate standards-based grade to test relationship, and Guskey’s finding that parents read standards-based labels as letter grades. tguskey.com
    3. Griffin, R., & Townsley, M. (2021). “Points, points, and more points: High school grade inflation and deflation when homework and employability scores are incorporated.” Journal of School Administration Research and Development, 6(1), 1–11. 795 students, semester math grades, one urban high school. ojed.org
    4. Great Schools Partnership. “College Admissions” and the collegiate statements page. Source for the 85 New England institutions and the “will not be disadvantaged in any way” language, and for the exemplar proficiency-based high school transcript carrying a cumulative GPA. greatschoolspartnership.org
    5. Lincoln Public Schools (MA). Middle school standards-based report card parent overview. Source for the “Exceeding / Achieving / Progressing / Performing Below” scale, the separate “Growth as a Learner” frequency scale, and the grade 7–8 return to letter grades. lincnet.org
    6. Park Hill School District (MO). “Standards-Based Report Cards.” Source for elementary-only use of the four-point standards-based card with traditional letter grades in middle and high school. parkhill.k12.mo.us

    About Clay Shumate

    Clay Shumate is a certified secondary Social Studies teacher in the public schools of West Alabama, with seven years of classroom experience, a B.A. in History, and an M.Ed. in Secondary Education. He writes about project-based learning, student responsibility, respect, and practical ways to hold young people to a higher standard while giving them room to learn from mistakes. He is a member of the Society of Professional Journalists and writes to its Code of Ethics; this site’s editorial standards and corrections policy are published in full. More about Clay.

  • 10 Point Grading Scale: The Chart, the Cutoffs, and What It Actually Changes

    10 Point Grading Scale: The Chart, the Cutoffs, and What It Actually Changes

    By Clay Shumate · Updated October 24, 2026

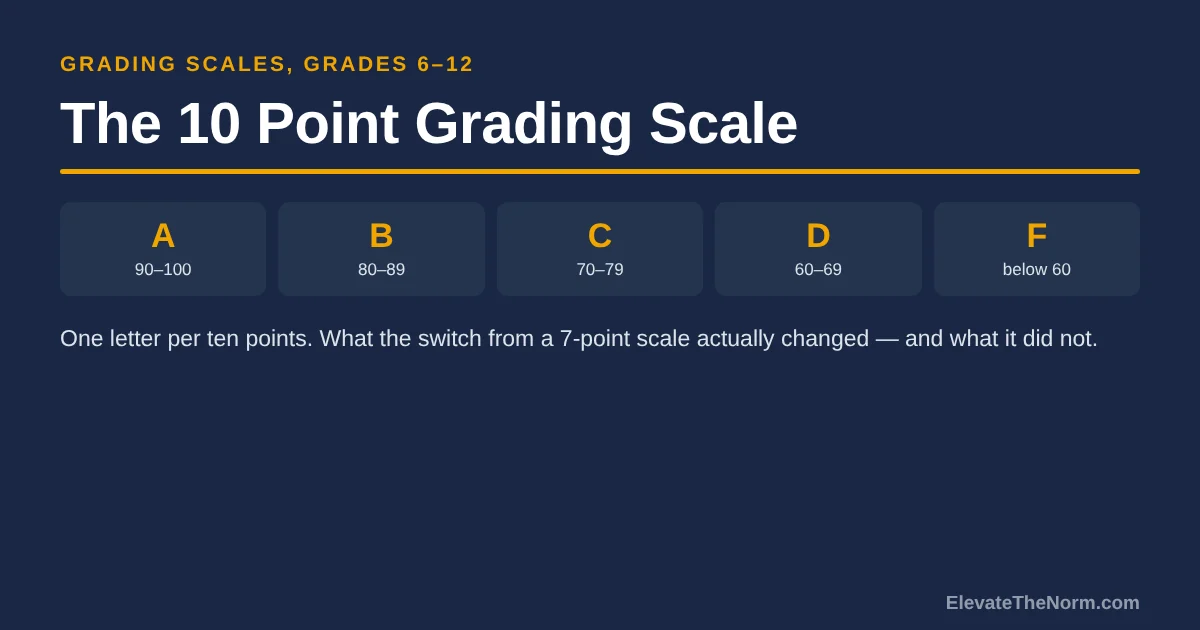
    A 10 point grading scale gives each letter grade a ten-point band: 90–100 is an A, 80–89 a B, 70–79 a C, 60–69 a D, and anything under 60 is an F. It replaced the older seven-point scale, where an A started at 93. Same work, wider bands, different letter on the transcript.

    That is the whole mechanical answer, and it is the part people come looking for. The part worth staying for is what the switch actually did, because it was never sold as a teaching improvement and it never was one. It moved lines on a page. Whether that helps a student depends entirely on what you do inside the bands.

    Key Takeaways

    • One letter per ten points. A 90–100, B 80–89, C 70–79, D 60–69, F below 60. North Carolina’s state policy writes the bottom band as “below 59,” which leaves 59 unassigned — a small drafting gap that has been sitting in an adopted statewide policy for years.
    • The seven-point scale it replaced started an A at 93 and a B at 85. A student with an 86 average was a B on both scales. A student with a 91 was an A on one and a B on the other.
    • States switched for transcript comparability, not learning. North Carolina’s board voted on 2 October 2014; South Carolina’s approved unanimously on 13 April 2016. Both rationales were about college admissions, scholarships and transferring families.
    • No study shows that widening a band teaches anybody anything. What it changes is which side of a line a student lands on, and how many students sit near a line at all.
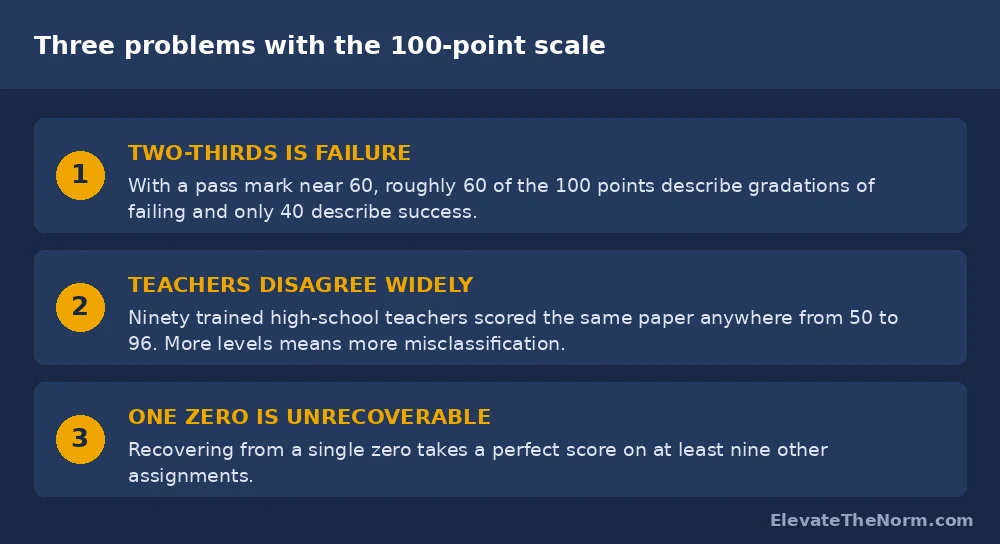
    • The research on scale length is not kind to percentages. Simulation work puts the useful number of categories at four to seven. A percentage scale has 101. Asked to grade one paper, 73 teachers trained in writing assessment produced scores from 50 to 96.

    What Is a 10 Point Grading Scale?

    It is a percentage grading scale where every letter covers exactly ten points, so the cutoffs land on round numbers: 90, 80, 70, 60. Here is the chart, with the 4.0 quality points most transcripts attach to each letter.

    LetterPercentStandard quality pointsWhat it is usually called
    A90–1004.0Exceeds or fully meets
    B80–893.0Meets
    C70–792.0Partially meets
    D60–691.0Credit, barely
    Fbelow 600.0No credit
    The 10 point grading scale, with the unweighted quality points North Carolina’s policy assigns each letter.

    Weighting sits on top of that and is where a lot of transcript confusion actually lives. Under North Carolina’s policy, honors courses add 0.5 quality points and AP, IB, Cambridge and eligible dual-enrollment courses add 1.0 — so an A in an AP course is a 5.0, and a student can finish with a weighted GPA above 4.0 while every single grade was earned on the same ten-point bands. Students get both an unweighted and a weighted GPA, and official class rank comes off the weighted one.

    One more thing the chart hides: the scale is a reporting rule, not a grading method. It tells you what band a number falls in. It says nothing about how the number was produced, which is the only part you control.

    How Is a 7 Point Grading Scale Different?

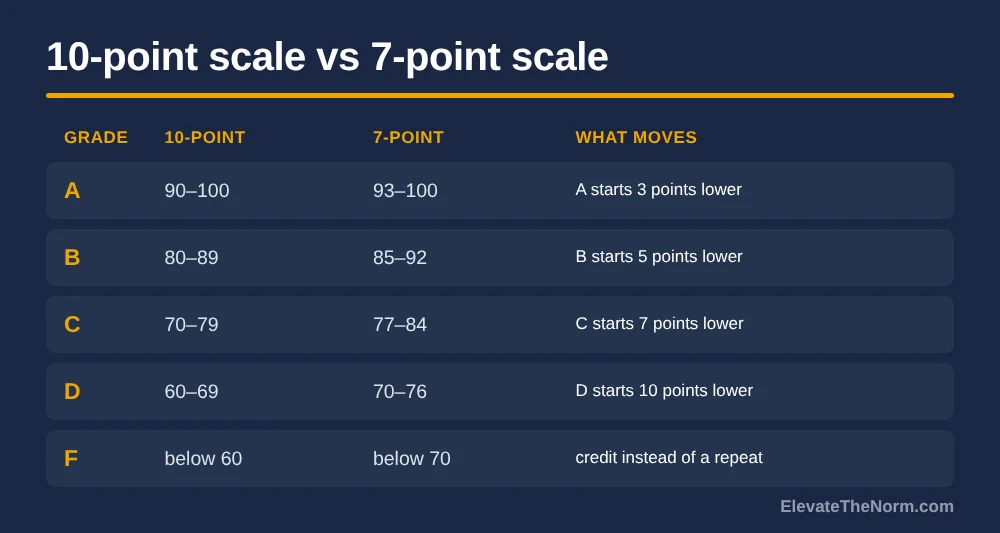
    The seven-point scale sets an A at 93–100, a B at 85–92, a C at 77–84 and a D at 70–76, with failure starting at 69. Every cutoff is higher, and the F band is much smaller.

    Side-by-side comparison of the percentage ranges for each letter grade on a 10 point grading scale and a 7 point grading scale, showing the five-point gap at the A cutoff and the ten-point difference at the failing line
    The same five letters, two sets of lines. The gap is widest where it matters least and narrowest where it matters most.

    Run a few numbers through both and the pattern shows up fast. A 91 is an A on the ten-point scale and a B on the seven-point. An 86 is a B either way. A 76 is a C on one and a D on the other. A 69 is a D on the ten-point scale and an F on the seven-point — that is the real one, because it is the difference between credit and a repeated course.

    When North Carolina made the change, a local report put the problem in one sentence: a student with a 91 in every class had a 4.0 in Atlanta and a 3.0 at home. That is not a rigor argument. It is a paperwork argument, and it was a fair one.

    Notice what the comparison does not show. It does not show that students on one scale learn more. Both scales are percentage scales. Both carry every problem a percentage scale has. One of them just puts the walls in different places.

    Why Did States Switch to a 10 Point Grading Scale?

    Because transcripts were not comparable across state lines, and students were losing scholarships to arithmetic.

    North Carolina’s State Board of Education approved the ten-point range on 2 October 2014, beginning with freshmen in 2015–16. Elementary and middle schools kept the right to use a locally approved system, though the state recommends the same 90–100 scale, and any high school course taken in middle school has to use the high school scale.

    South Carolina’s State Board approved a uniform ten-point scale unanimously on 13 April 2016, effective 2016–17. The reasons the department gave were specific: students from military and other transferring families were being penalized, in-state students were at a disadvantage against neighbors applying to the same colleges, and dual-credit students were being graded on two scales at once. The department also said it would re-examine its Hope, Life and Palmetto Fellows scholarship requirements “to ensure fairness and rigor” afterward — which is the quiet admission that moving cutoffs moves who qualifies for money.

    That is the honest case for the switch, and it is strong. It is also narrow. Nobody in either state claimed a wider B band would improve a single lesson, and nobody should quote them as if they had.

    If you are the one who has to implement a change like that, the hard part is not the new chart. South Carolina’s department named the real work in its own announcement: deciding the timing, merging grade calculations for students already enrolled, and preparing for the knock-on effect on lottery-funded scholarships. For a year or two you have students in the same building whose transcripts were built on two different rules, and every one of those families deserves a plain-language explanation before they ask for one.

    Does a 10 Point Grading Scale Make Grades Easier?

    It lowers four cutoffs, so on identical work more students clear each line. That is not the same thing as grade inflation, and the two get confused constantly.

    Grade inflation is real and it is measurable. An ACT study of one southern state’s ACT-tested public high school graduates found mean self-reported GPA rose from 3.17 in the 2017 class to 3.38 in 2022 — about 0.21 grade points after adjusting for test scores, with school-level estimates running from roughly −0.3 to 0.7. It also found inflation weakened what a GPA predicts: for two students with a 2.5, the one from a school with 0.5 of inflation was projected to finish first-year college 0.37 GPA points lower.

    Read that carefully before you use it. That study is one state, a sample the authors describe as predominantly White and female, and it measured inflation across a five-year window that included the pandemic. It does not attribute any of the rise to scale changes, and it does not test scale changes at all. Anyone telling you the ten-point scale caused grade inflation is borrowing a real number to support a claim nobody has tested.

    One finding in it does deserve attention from anyone thinking about equity: the inflation the study estimated was more pronounced at schools whose average GPAs were lower to begin with. If a GPA means less coming out of the schools whose students can least afford a discounted signal, that is a problem worth naming — and it is a problem about grading practice, not about where the A cutoff sits.

    What the scale change genuinely does is a one-time shift in the distribution. Every student near a cutoff moves up a letter once, and then the system settles. If grades keep climbing after that, the cause is somewhere else — in retake policies, in how late work gets scored, in extra credit, in what gets averaged into the gradebook at all.

    How Many Levels Should a Grading Scale Have?

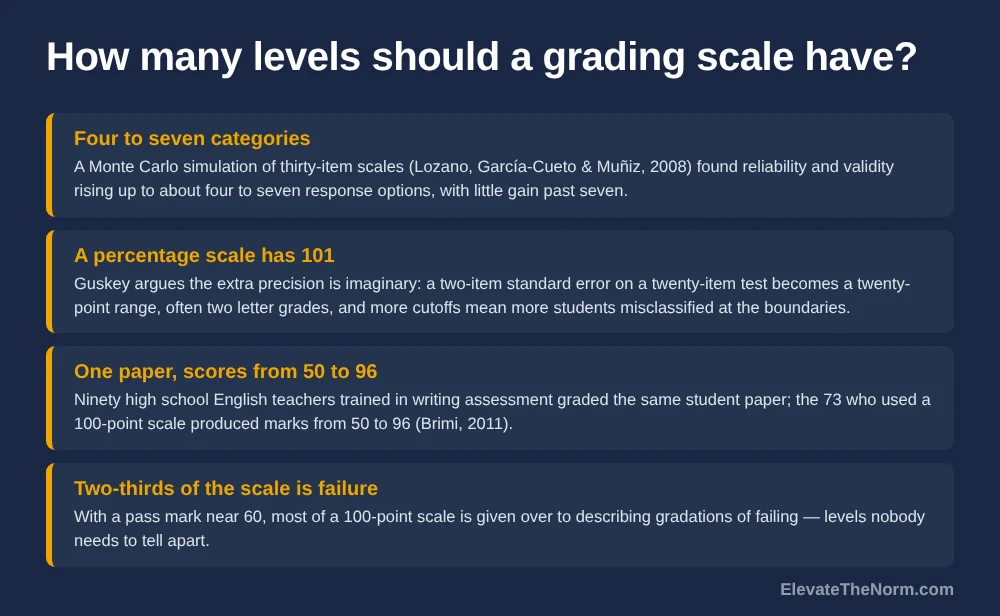
    Fewer than a hundred. The simulation research lands on four to seven categories, and a percentage scale has 101.

    Three research findings about grading scale length: the optimum number of rating categories is four to seven, a percentage scale offers 101 levels, and 73 trained teachers scoring the same paper produced marks from 50 to 96
    Three findings that every percentage scale has to answer for, whatever the width of its bands.

    Lozano, García-Cueto and Muñiz simulated thirty-item scales across sample sizes from 50 to 500 and response options from two to nine. Reliability and validity improved as options increased, but the gains flattened out: their conclusion was that the optimum sits between four and seven, that fewer than four costs you real precision, and that past seven the improvement is small. That is a psychometric simulation, not a classroom study, and it is about rating scales generally rather than report cards — but 101 is not within shouting distance of seven.

    Thomas Guskey has made the applied version of this argument for years. His case against percentage grades is that the precision is imaginary: a standard error of two items on a twenty-item test becomes a twenty-point range on a percentage scale, often spanning two letter grades. More cutoffs mean more students misclassified at boundaries, not fewer. And with a pass mark near 60, roughly two-thirds of the scale is devoted to describing gradations of failure that nobody needs.

    The reliability evidence underneath that is older than most grading debates. In 1912 and 1913, Starch and Elliott had 147 high school English teachers grade two identical papers — scores ran 64 to 98 on one and 50 to 97 on the other — and 128 mathematics teachers grade geometry papers, where one paper drew scores from 28 to 95. A century later Hunter Brimi ran the replication with teachers trained in a writing-assessment framework. Ninety teachers graded one paper; the 73 who used a 100-point scale produced scores from 50 to 96.

    Here is the part that cuts against the easy conclusion. If fewer levels are better, then the ten-point scale is an improvement on the seven-point one, because its bands are wider and its boundaries are fewer in the range where students actually cluster. But it is still a percentage scale with 101 levels underneath the letters, and Guskey’s own recommendation is not a wider percentage band at all — it is a 0–4 integer scale. If you want that argument in full, including why the conversion back to a letter is the hard part, it is in the 1–4 scale and its conversion problem, and the system it belongs to is laid out in what standards-based grading actually fixes.

    What Changes for a Student at 69 Instead of 70?

    On a ten-point scale, nearly nothing: 69 is a D and the student gets credit. On a seven-point scale, 69 is an F and the course gets repeated. Same work, same kid, different year.

    That is the strongest practical argument for the wider bands, and it deserves to be stated plainly rather than buried in a policy rationale. It is also the argument that should make you look hard at your own gradebook, because the scale is not what put the student at 69. Something else did, and a wider band does not fix it. It just stops that particular thing from costing a credit.

    There is a cost on the other side, and it is worth saying before someone else does. A ten-point scale hands out credit at 60 that a seven-point scale withheld until 70. Some of those students walk into the next course without the ground under them, and the transcript says they are fine. The letter is not the problem there — the problem is a student moving up without the skill, and nothing about the band width tells you which students those are. That is what the boundary review in the next section is for.

    The zero is where this gets ugly. On a 100-point scale a single zero is not one bad grade, it is a hole — moving a student from a zero to passing takes six or seven times the gain that moving a B to an A takes. Guskey, Fisher and Frey call minimum-grade policies a Band-Aid for exactly this reason: a 50 percent floor is an attempt to fix the arithmetic of the scale without changing the scale, and teachers using one are still sorting among fifty-one levels of not-passing. Several districts have put floors in and then pulled them back out; Texas legislated against them.

    None of that is an argument for giving a student a number they did not earn. It is an argument for not building a system where one missed assignment is mathematically unrecoverable. If a student can screw up that badly in your class, look at the planning before you look at the student — and give them a real route back, whether that is test corrections that actually teach or a reassessment with the same standard and a new attempt.

    How Do You Run a 10 Point Scale Without Lying to Students?

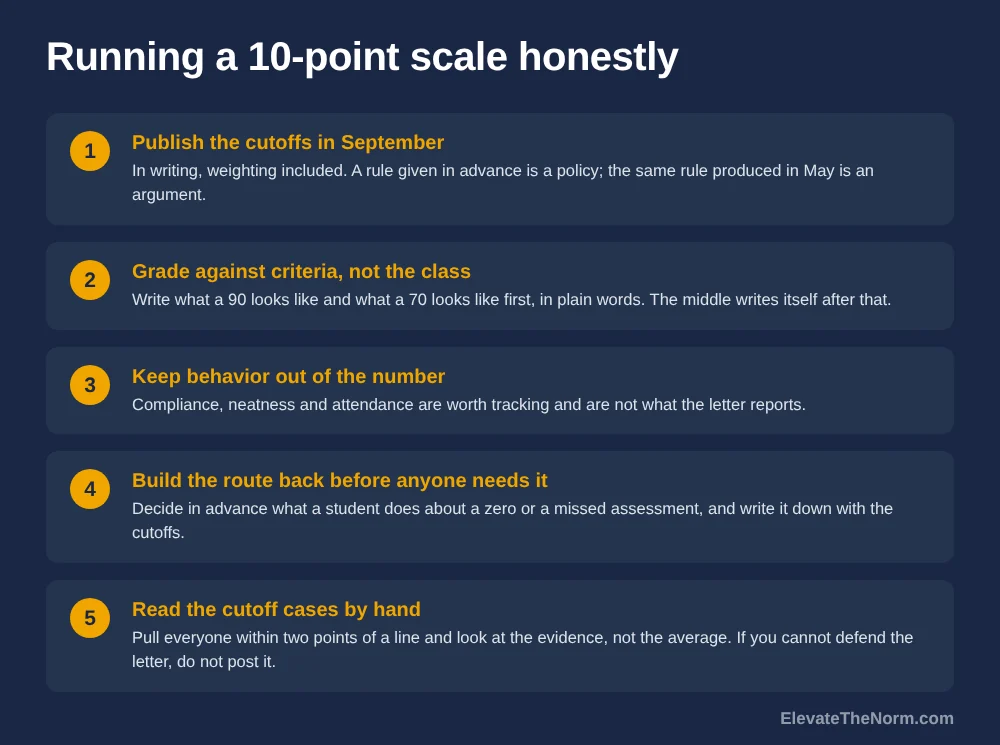
    Treat the scale as the reporting rule it is, and put your effort into what produces the number. Five things, in order.

    Five-step checklist for running a 10 point grading scale: publish the cutoffs in writing, grade against criteria not a curve, keep behavior out of the number, build a route back from a zero, and check the cutoff cases before grades post
    Five steps that decide whether the band is honest. None of them are about the band.
    1. Publish the cutoffs in September, in writing. A rule given in advance is a policy. The same rule produced in May is an argument you will lose. Include the weighting if your school weights, because that is where families get blindsided.
    2. Grade against criteria, not against the class. A ten-point band is only meaningful if 85 means something describable. If it means “a bit above the middle of this particular group,” the band is decoration. A written description of what each level looks like does more for accuracy than any cutoff you pick, and the quickest way in is to write the description of a 90 and the description of a 70 first. Once the top and the pass line are on paper in plain words, the middle writes itself.
    3. Keep behavior out of the number. Compliance, neatness and attendance are real and worth tracking, and they are not what the letter is supposed to report. Starch and Elliott found teachers deducting for neatness and spelling on geometry papers in 1913. That has not gone away on its own.
    4. Build the route back before anyone needs it. Decide in advance what a student does about a zero, a missed assessment, or a standard they have not reached yet — and write it down with the cutoffs. Deciding case by case is how you end up being generous to the students who ask and strict with the ones who do not.
    5. Read the cutoff cases by hand before grades post. Pull everyone within two points of a line and look at the evidence instead of the average. In most sections that is a handful of students, and it is a few minutes of reading rather than a re-grade. The arithmetic put them there; your judgment is what the cutoff was always standing in for. If you cannot defend the letter to the student, do not post it — and if the student thinks you have it wrong, let them bring the evidence and make the case. A sixteen-year-old arguing from their own work is the best outcome on this entire list.

    Then say it out loud to the room. Students handle a hard line fine when it was announced in advance and applied the same way to everybody. What they do not forgive is a cutoff that moved. Doing exactly what you said you would do is the entire mechanism, and it works the same way with families as it does with a seventeen-year-old staring at an 89.

    What to Do Next

    If you are a teacher on a ten-point scale, you do not get to choose it, so spend your effort on the four steps above that are yours: published cutoffs, criteria instead of a curve, behavior out of the number, and a hand-read of the boundary cases. The band is somebody else’s decision. The number inside it is yours.

    If you are the one choosing the system, the honest brief is short. Moving from seven points to ten buys you comparable transcripts, fewer students failing on a technicality, and fewer boundaries to misclassify at — and it buys you nothing instructional. If you want the scale itself to carry meaning, the evidence points past percentages altogether, toward four to seven levels with written descriptors. Start with how the gradebook has to be set up, because that is the part that decides whether a new scale survives its second year.

    And either way, write your rule down before you need it. That single habit prevents more grading arguments than any scale ever has.

    Frequently Asked Questions

    Whatever scale your district uses, the semester exam is where the cutoffs bite hardest, so the test itself should be sound. Mid-Terms.org has 200 free printable midterms with answer keys for grades 6–12 in Social Studies, ELA, Math and Science, with a Form A and Form B for every course.

    What are the letter grades on a 10 point grading scale?

    Each letter covers a ten-point band: 90 to 100 is an A, 80 to 89 is a B, 70 to 79 is a C, 60 to 69 is a D, and anything below 60 is an F. On the older seven-point scale it replaced, an A started at 93, so the same work could earn a different letter on the transcript.

    What letter grade is an 85 on a 10 point scale?

    An 85 is a B on a 10 point grading scale, because the B band runs from 80 to 89. A 75 is a C, a 65 is a D, and a 95 is an A. Anything under 60 is an F. An 85 is also a B on the older seven-point scale, but a 91 is not: it is an A on the ten-point scale and a B on the seven-point, and a 69 is a D on one and an F on the other.

    What is a 10 point grading scale?

    A 10 point grading scale gives each letter grade a ten-point band: 90–100 is an A, 80–89 a B, 70–79 a C, 60–69 a D, and anything below 60 is an F. On a standard 4.0 transcript those letters carry 4, 3, 2, 1 and 0 quality points. North Carolina’s state policy writes the bottom band as “below 59,” which technically leaves a score of exactly 59 unassigned.

    What is the difference between a 10 point and a 7 point grading scale?

    Every cutoff moves. On a seven-point scale an A starts at 93, a B at 85, a C at 77 and a D at 70, so failure begins at 69. On a ten-point scale those lines are 90, 80, 70 and 60. A 91 is an A on the ten-point scale and a B on the seven-point one. A 69 is a D on the ten-point scale and an F on the seven-point — the difference between earning credit and repeating the course.

    Is a 10 point grading scale easier?

    On identical work, more students clear each line, because four cutoffs moved down. That is arithmetic, not generosity, and it happens once when the scale changes rather than year after year. It is not the same thing as grade inflation, and no study has tested whether switching scales causes inflation. If grades keep climbing after the transition year, look at retake rules, late-work scoring and extra credit rather than the chart.

    Why did states switch to a 10 point grading scale?

    For transcript comparability, not for learning. North Carolina’s State Board approved the change on 2 October 2014, starting with 2015–16 freshmen, after reporting that a student with a 91 average could hold a 4.0 in one state and a 3.0 in another. South Carolina’s board approved a uniform ten-point scale unanimously on 13 April 2016, citing transferring military families, college admissions, scholarships and dual-credit students graded on two scales at once.

    Should a teacher round an 89 up to an A?

    Decide the rule before September and then apply it to everyone, which is the only version of this that is fair. A published rule is a policy; the same decision made in May for one student is a favor, and the rest of the class will hear about it. The defensible practice is to review every student within a point or two of a line against the actual evidence rather than the average, and let a student who disagrees bring their work and make the case.

    Is a D a passing grade on a 10 point grading scale?

    A D (60–69) normally earns course credit and one quality point, so it passes. Whether it counts toward a specific requirement is a separate question — many graduation pathways, athletic eligibility rules, NCAA core-course lists and college prerequisites set a higher floor than a D. It is also the band most worth a second look, because a student can clear 60 and still walk into the next course without the ground under them.

    Does a 10 point grading scale hurt college admissions?

    It generally helps, which is why states adopted it. Admissions offices recalculate GPAs, and a student graded on a seven-point scale was arriving with a lower number than an identically performing student from a ten-point state. The scale change removes that penalty. It does not change course rigor, test scores or the weighted GPA mechanics, where honors courses usually add 0.5 quality points and AP, IB or dual-enrollment courses add 1.0.

    How many levels should a grading scale have?

    The research points to far fewer than a hundred. A simulation study by Lozano, García-Cueto and Muñiz across thirty-item scales found reliability and validity improving up to about four to seven response categories, with little gain beyond seven. A percentage scale has 101. Asked to grade one paper, 73 teachers trained in writing assessment produced scores from 50 to 96, and in 1912 Starch and Elliott found English teachers scoring one identical paper from 64 to 98.

    Sources

    1. North Carolina State Board of Education. GRAD-009: High School Grading and Transcript Standards. Adopted 1 June 2017, last revised 7 November 2024. States the required high school scale (A 90–100, B 80–89, C 70–79, D 60–69, F below 59), the 4.0 quality-point values, honors +0.5 and AP/IB/CIE/college +1.0 weighting in force since 2015–16, dual unweighted and weighted GPAs, and the local option for grades K–8. The policy text reads “< 59 = F,” which leaves a score of exactly 59 unassigned; that is reported here as written. GRAD-009 (PDF)
    2. South Carolina Department of Education. 10-Point Uniform Grading Scale Approved by State Board of Education. News release, 13 April 2016. Unanimous approval effective 2016–17; rationale covers transferring military families, parity for college admissions and scholarships, and dual-credit students; notes the implementation work of merging calculations for enrolled students and reviewing the Hope, Life and Palmetto Fellows scholarships. The release does not publish the cutoff percentages, so South Carolina’s specific bands are not stated in this article. ed.sc.gov
    3. WRAL. NC changes high school grading scale. 2 October 2014. Reports the State Board vote, the prior seven-point ranges (A 93–100, B 85–92, failing below 70), the 2015–16 freshman start, and the 91-average example yielding a 4.0 in Atlanta against a 3.0 in North Carolina. News reporting, cited for the vote date and the comparison it states rather than as research. wral.com
    4. Guskey, T. R. (2013). The Case Against Percentage Grades. Educational Leadership, 71(1), 68–72. Argues that a 100-level scale creates false precision (a two-item standard error on a twenty-item test becomes a twenty-point range), that more cutoffs mean more boundary misclassification, that roughly two-thirds of the scale describes failure once the pass mark sits near 60, and that a single zero takes six or seven times the gain of a B-to-A move to recover from. Recommends a 0–4 integer scale instead. Read in the author’s own posted copy; this is an argument article, not an empirical study, and his recommendation is not a wider percentage band. tguskey.com (PDF)
    5. Guskey, T. R., Fisher, D., & Frey, N. (2024). The Unwinnable Battle Over Minimum Grades. Educational Leadership, 82(2). Treats 50 percent floors as a “Band-Aid approach” to the arithmetic of the percentage scale, notes that a teacher using one still distinguishes 51 levels of failing, and records districts amending or rescinding such policies and Texas legislating against them. Cites the four-to-seven-level reliability research. ascd.org
    6. Brimi, H. M. (2011). Reliability of Grading High School Work in English. Practical Assessment, Research & Evaluation, 16(17). Ninety high school English teachers, all trained in a writing-assessment framework, graded one identical student paper; the 73 who used a 100-point scale produced scores from 50 to 96. Cited from the ERIC record, which was read; the hosting journal’s full text was unreachable from this session. One paper, one district. eric.ed.gov
    7. Lozano, L. M., García-Cueto, E., & Muñiz, J. (2008). Effect of the Number of Response Categories on the Reliability and Validity of Rating Scales. Methodology, 4(2), 73–79. Monte Carlo simulation of thirty-item scales, inter-item correlations .2–.9, samples of 50–500, two to nine response options; reliability and validity rise with more categories but the optimum sits between four and seven, with small gains past seven. A psychometric simulation of rating scales in general, not a study of report-card grades, and cited from the published abstract. doi.org/10.1027/1614-2241.4.2.73
    8. Sanchez, E. I. (2025). The Implications of Grade Inflation: Evaluating the Prediction of First-Year College GPA Using High School GPA and ACT Scores. ACT Research Report R2432. Mean self-reported HSGPA rose from 3.17 (2017 class) to 3.38 (2022) in one southern state with statewide ACT testing; 22,717 and 16,199 students, 160 high schools; school-level inflation estimates ran from about −0.3 to 0.7 and were larger at lower-GPA schools; for two students at a 2.5 HSGPA, 0.5 of school inflation predicted a first-year college GPA 0.37 points lower. One state, a sample the report describes as predominantly White and female, and a window that includes the pandemic. The study does not test grading-scale changes and attributes none of the rise to them. act.org (PDF)
    9. Starch, D., & Elliott, E. C. (1912). Reliability of the Grading of High-School Work in English. The School Review, 20(7), 442–457; and the 1913 mathematics companion study. Cited as reported by Guskey (2013) — 147 English teachers scoring two identical papers 64–98 and 50–97, and 128 mathematics teachers scoring one geometry paper 28–95. The 1912 article’s bibliographic record was confirmed, but the full text was not read in this session, so the figures are attributed to Guskey’s account of them. archive.org

    About Clay Shumate

    Clay Shumate is a certified secondary Social Studies teacher in the public schools of West Alabama, with seven years of classroom experience, a B.A. in History, and an M.Ed. in Secondary Education. He writes about project-based learning, student responsibility, respect, and practical ways to hold young people to a higher standard while giving them room to learn from mistakes. He is a member of the Society of Professional Journalists and writes to its Code of Ethics; this site’s editorial standards and corrections policy are published in full. More about Clay.

  • Standards Based Grading Gradebook: How to Build One That Survives a Semester

    Standards Based Grading Gradebook: How to Build One That Survives a Semester

    A standards based grading gradebook stores evidence by learning target instead of by assignment. Each row is a standard. Each entry is a piece of evidence a student produced for that standard. That one structural change is what makes a gradebook readable to a student, a parent, and the teacher who inherits the class next year. It is also what creates every hard decision you will spend the semester making.

    Most of what gets written about standards-based grading is about philosophy. This is not that. This page is about the file — what goes in the columns, what happens when a kid takes a quiz three times, what you do when the office needs a letter grade by Friday, and what the research says happens when you get those choices wrong.

    I will say up front that the evidence here is thinner and more mixed than the professional development usually admits. That is covered honestly below, because a teacher about to rebuild a semester of records deserves to know what they are buying.

    Key Takeaways

    • The structure is the whole idea. Rows are standards, not assignments. If your gradebook still reads as a chronological list of tasks with points attached, you have changed the labels and not the system.
    • One randomized trial found a real gain. A cluster RCT across 29 schools of a proficiency-plus-reassessment program in ninth-grade algebra and geometry reported a 0.33 standard deviation improvement on end-of-course mathematics tests — roughly the 50th to the 63rd percentile.
    • But no grading system improves learning by itself. Guskey and Link put it plainly: grading does not change curriculum or instruction, and there is no evidence that standards-based grading on its own raises achievement. What it reliably does is make the grade mean something specific.
    • Taking practice work out of the grade has a measurable cost. A two-year study of a policy change in secondary mathematics found that when practice stopped counting, completion of practice fell and achievement declined on several standards.
    • Students object on fairness grounds, and their objections are specific. In a survey of 478 high school students, the complaints were not about rigor. They were about inconsistent reassessment rules between teachers and about losing credit for work they had done.
    • The five decisions below are where implementations live or die: how many standards, what scale, how repeated attempts combine, what counts as evidence, and where behavior goes.

    What is a standards based grading gradebook?

    It is a gradebook whose primary axis is the standard rather than the assignment. A traditional gradebook answers “what did this student turn in and what was it worth?” A standards-based gradebook answers “what can this student do, and how do we know?”

    In practice that means a column per learning target instead of a column per task. A single test might feed six different columns, because a single test usually assesses six different things. Three separate assignments over a month might all feed one column, because they were all evidence for the same skill. The assignment does not disappear — it becomes the container for the evidence rather than the thing being measured.

    If you want the underlying rationale and the arguments for and against the approach as a whole, that is covered in the main standards-based grading guide. This page assumes you have already decided, or been told, and now have to build the thing.

    Does a standards based grading gradebook actually improve learning?

    The honest answer: one good randomized trial says a specific version of it helped, a large review says grading systems do not improve learning on their own, and at least one comparison found worse outcomes. Anyone who tells you the evidence is settled has not read it.

    The positive result

    The strongest evidence for this approach comes from a cluster randomized controlled trial of the PARLO program run by Kramer and colleagues and published in the Journal of Research on Educational Effectiveness. Twenty-nine schools were randomized — 14 treatment, 15 control — with the intervention in ninth-grade algebra and geometry classrooms. Students were rated not-yet-proficient, proficient, or high-performance on each learning outcome, and could reassess any outcome for full credit after further study. The program produced a 0.33 standard deviation improvement on end-of-course mathematics tests, moving the average student from roughly the 50th to the 63rd percentile. The effect was strongest among students who were already more motivated.

    Two caveats on that one. First, PARLO is a defined program with mastery definitions and reassessment built in, not a gradebook layout — the trial tested the whole package. Second, the full published article was not accessible to me, so the figures above come from the study summary published by the Society for Research on Educational Effectiveness rather than from the paper itself. I am citing what I actually read.

    The sobering results

    Laura Link and Thomas Guskey, writing in Theory Into Practice, argue that standards-based grading is best understood as a communication tool and not as an achievement intervention. Their sentence is the one worth keeping: no grading system by itself improves student learning, because grading does not alter curriculum or instruction. They note that the practice remains largely unstudied, that emerging research shows it produces a stronger relationship between grades and external measures, and that no evidence indicates it improves achievement.

    Four research summaries on standards-based grading: Kramer 2024 cluster randomized trial, Link and Guskey 2022, Townsley and Varga 2017, and Huey 2022
    Five peer-reviewed sources, and they do not agree with each other.

    Matt Townsley and Matt Varga compared two demographically similar Midwestern high schools of about 450 students each, one using standards-based grading and one traditional, across the graduating classes of 2015 and 2016. They found no significant difference in math, English, or cumulative GPA — and ACT scores roughly 2.2 to 2.7 points higher at the traditional school. That is a quasi-experimental comparison of two schools with all the confounding that implies, and the authors flag the rural, low-diversity sample themselves. It is not proof that the gradebook caused it. It is also not a result anyone should skip past.

    The broadest context comes from A Century of Grading Research in the Review of Educational Research, an eight-author review of the whole field. Two findings from it matter for anyone building a gradebook. Teachers mix achievement with work habits whether or not their system says they should — even teachers who report supporting standards-based reform report using practices that blend effort and improvement into academic marks. And grades, messy as they are, consistently predict educational persistence and completion better than standardized tests do. The multidimensionality that standards-based grading tries to strip out may be part of what makes a grade useful.

    The five decisions every standards-based gradebook has to make

    Make these five on purpose, write them down, and do not change them midyear. Every failed implementation I have read about failed at one of these, usually by leaving it to be decided case by case.

    DecisionThe optionsWhat to weigh
    1. GranularityEvery state standard, or 8–15 bundled targets per courseToo many rows and nobody reads the gradebook. Too few and the grade stops being diagnostic. Most workable secondary courses land between eight and fifteen per semester.
    2. Scale4-point, 3-level proficiency, or letter equivalentsGuskey argues for a limited number of performance categories rather than percentage scales, to cut down on false precision. The 1–4 scale and its conversion problems are worth reading before you commit.
    3. How attempts combineMean, most recent, highest, or professional judgmentThis is the one students notice. Averaging punishes early struggle. “Most recent” can drop a student for one bad day. Write the rule down and publish it.
    4. What counts as evidenceAssessments only, or assessments plus observed performanceNarrow it too far and you are grading test-taking. Widen it without criteria and you are back to impressions.
    5. Where behavior goesA separate reported strand, or nowhereSeparating academic marks from work habits is one of the three criteria Guskey names. It only works if the second strand is actually reported, not deleted.

    On decision three specifically: students in one large survey complained that a reassessment score replaced a higher earlier score even when it was worse. That is a defensible rule and an indefensible surprise. The rule is not the problem; discovering it after the fact is.

    Five numbered gradebook design decisions: granularity, scale, how attempts combine, what counts as evidence, and where behavior is reported
    Decide these on purpose, write them down, and hold them all year.

    Should practice work count in the grade?

    The evidence says be careful, and it points the opposite direction from the standard advice.

    The usual argument is that practice is formative, so it should not be graded — students will do it because it helps them. A two-year study by Huey and colleagues in Studies in Educational Evaluation tested exactly that policy change with 122 eighth graders and 123 ninth graders in year-long geometry courses. When practice work was removed from grade computations, completion of practice work decreased overall, and student achievement declined on several of the standards being assessed. The authors concluded that process grades are likely essential to maintaining achievement in that population, and noted their result contradicts reform advocates who claim engagement holds regardless.

    That is one study of high-achieving students in one subject, and it should not be read as a verdict on the whole question. But it is a direct test of a specific gradebook decision, and it came out against the conventional answer. If you take practice out of the grade, put something else in its place that makes the practice visibly matter, and watch your completion rates rather than assuming.

    Students see the same thing from the other side. In a study of 478 students at one high school, the most common complaint about standards-based grading was that homework should count — not because they wanted easy points, though some did, but because with few graded items the whole grade rested on two or three assessments. “There are so few points available on quizzes and tests” is a fairness objection, and it is a reasonable one.

    How do you convert to a letter grade when the office needs one?

    Publish the conversion rule before the first grade goes in, and use the same one every time.

    Most secondary teachers running this system do not control the report card, so the standards-based gradebook feeds a traditional one. That translation is where trust gets lost, because a student who sees a row of 3s and receives a B wants to know how. The receiving end of that translation is its own skill, and it helps to know how a standards based report card is meant to be read. Three workable approaches:

    1. A published crosswalk. A fixed table — all 4s and 3s with no 2s is an A, and so on. Simple, transparent, and slightly blunt at the boundaries.
    2. A proficiency threshold. The grade is determined by the proportion of standards at proficient or above, with a stated floor of standards that must be met regardless.
    3. A weighted composite with named priority standards. More precise, harder to explain, and worth it only if you will actually explain it.

    Whichever you choose, the parent-facing version has to be one paragraph long. Brookhart and colleagues found that many parents attempt to interpret standards-based labels by translating them back into letter grades regardless of what the school intends. Give them the translation rather than letting them invent one.

    What breaks, and when

    Reassessment load, teacher-to-teacher inconsistency, and midyear rule changes — in that order.

    • Unlimited reassessment. Guskey and Link warn directly that unlimited retakes create burdensome workloads, and that retaking a poorly aligned assessment does not produce learning regardless of how many attempts you allow. Cap attempts, require evidence of new study before a retake, and put reassessment in a fixed window rather than on demand.
    • Different rules in different rooms. Students in the 478-student survey said it repeatedly: nobody communicates the same, there is no standardization, some teachers appear to make reassessment deliberately difficult. Within a department, the five decisions above should have one answer, not six.
    • Changing the rule in January. A grading rule changed midyear is functionally retroactive, because the evidence already in the book was produced under the old one. If a decision is wrong, finish the term and change it at the semester line.
    • A gradebook nobody opens. Fifteen standards with one entry each in November is not a standards-based gradebook, it is a spreadsheet. The system only pays off if there is enough evidence per row to make the row mean something.

    Before you do this alone: what it costs beyond your own room

    A standards-based gradebook inside one classroom in a traditional building is a bigger undertaking than it looks, and four things will bite you.

    • The transcript is not yours. Whatever you do internally, a letter grade and a GPA leave your room and go on a document that affects class rank, scholarship eligibility, and athletic eligibility. Confirm with your counseling office how your marks will be recorded before you change how you produce them, not in May.
    • Your software may not support it. Most district gradebooks are built around assignments with point values. Some can be bent into standards; some can only fake it with categories. Find out which you have before you design a system it cannot hold, because a parallel spreadsheet you maintain by hand is a system that dies in November.
    • Students transfer. A student who arrives in week twelve arrives with points, and a student who leaves takes your proficiency levels into a building that will not know what they mean. Have a stated rule for both directions.
    • Reassessment is the real labor cost. Be concrete about it before you promise anything. If 20% of 140 students reassess one target a week, that is 28 additional items to write, administer, and score every week, on top of everything else. That number is why reassessment windows and attempt caps exist, and it is why Guskey and Link warn that unlimited retakes become burdensome.

    There is an instructional point buried in that last one that a coach would raise immediately. Reassessment only works if you have more than one assessment item per target that genuinely measures the same thing. If the retake is the same quiz, you are measuring memory of a quiz. If the retake is harder, you are punishing the student for needing it. Building a second and third form for each priority standard is the unglamorous prerequisite, and it is most of the actual work of this system.

    Four failure points for a standards-based gradebook: unlimited reassessment workload, inconsistent rules between teachers, midyear rule changes, and too little evidence per standard
    In roughly this order, and usually by midyear.

    None of this is an argument against doing it. It is an argument for doing it with the department and the counseling office rather than in private, and for starting with one course rather than a schedule.

    A setup checklist you can work through in an afternoon

    1. List the course’s learning targets and bundle them down to 8–15 per semester. Write each one in student-facing language. If you cannot say it in a sentence a fifteen-year-old understands, it is still a standards document and not yet a target — the four parts of a target a student can actually use covers the rewrite.
    2. Pick the scale and write the descriptors. Not just the numbers — what a 3 actually looks like in this course. Rubric templates are the fastest way in.
    3. Write the five decisions on one page. Granularity, scale, how attempts combine, what counts as evidence, where behavior goes. Date it.
    4. Build the columns before the semester, not during it. Retrofitting a gradebook in week six means hand-remapping every entry already in it.
    5. Decide the reassessment window and the entry requirement now. Which days, how many attempts, what a student must show to earn one.
    6. Write the one-paragraph explanation for families. What the numbers mean, how they become a letter, and when. Send it in the first two weeks rather than after the first complaint — the same front-loaded contact that works for everything else works here.
    7. Pick your check date. A day in week eight when you open the gradebook and ask whether any row has too little evidence to defend, and whether your conversion rule still produces grades you believe.

    What to tell students, and what to tell families

    Tell students the rules before the first entry, and show them the gradebook. Most of the recorded student resistance to this system is not resistance to rigor. It is the experience of being graded by a machine whose rules nobody explained.

    Grades 6–12 students can handle the actual explanation, and they deserve it. Say what the scale means. Say how repeated attempts combine, including the case where a retake scores lower. Say which standards carry the most weight. Say what happens to homework. Then hold to it, because the fastest way to lose a room under this system is to make an exception for one student and get caught.

    For families, lead with the translation and the one thing that changed. If your building is also making the shift, the arguments against are worth knowing as well as the arguments for — the case that standards-based grading does not work is an honest summary of the objections, and a teacher who can state the objection fairly is more persuasive than one who cannot.

    What to do next

    Before you rebuild anything, write the five decisions on one page and show it to one colleague who teaches the same course. Most of the damage in a standards based grading gradebook happens because a decision was never made explicitly — it just emerged from whatever the software defaulted to and whatever felt fair in the moment.

    Then build one unit, not one semester. Run it, look at how many entries each row actually accumulated, and see whether your conversion rule produced a grade you would defend to a parent. Adjust once, at the unit boundary. That is a slower start than a summer rebuild and it is the version that is still running in April. When the unit is done, a short structured reflection on what the rows told you is worth more than another round of reorganizing the columns.

    Frequently Asked Questions

    What is a standards based grading gradebook?

    A gradebook organized by learning target rather than by assignment. Each row is a standard and each entry is evidence a student produced for that standard, so a single test can feed six different rows and three assignments over a month can feed one. The practical test is whether the gradebook answers “what can this student do” rather than “what did this student turn in.” If the rows are still tasks with point values, the labels have changed and the system has not.

    How many standards should be in the gradebook?

    For most secondary courses, eight to fifteen bundled targets per semester. Listing every state standard produces a gradebook nobody opens, including you. Bundling too aggressively produces a grade that is no more diagnostic than a single letter. The working check is whether each row will accumulate enough evidence by the end of the term to defend a judgment — a row with one entry in November is not measuring anything.

    Should homework and practice work count toward the grade?

    The evidence is more cautious than the usual advice. A two-year study of a policy change in secondary mathematics found that when practice work was removed from grade computations, practice completion fell and achievement declined on several standards. Students in a separate survey said the same thing from their side: with few graded items, removing practice makes the entire grade rest on two or three assessments. If you take practice out, replace it with something that makes practice visibly matter and watch your completion rates.

    How should multiple attempts at the same standard be combined?

    Pick one rule, publish it before the first entry, and do not change it midyear. Averaging punishes early struggle, which is the thing the system is supposed to fix. “Most recent” can drop a student for one bad day. Highest score removes the incentive to prepare. Many teachers use most-recent with professional judgment for outliers. Whichever you choose, students need to know in advance what happens when a retake scores lower than the original — that specific surprise is one of the most common student complaints on record.

    Does standards-based grading raise test scores?

    The evidence is mixed and should be described that way. A cluster randomized trial across 29 schools of a proficiency-plus-reassessment program in ninth-grade math reported a 0.33 standard deviation gain on end-of-course tests. A comparison of two Midwestern high schools found no GPA difference and ACT scores roughly 2.2 to 2.7 points higher at the traditional school. Guskey and Link argue no grading system improves learning on its own, because grading changes neither curriculum nor instruction. What it reliably changes is what the grade means.

    How do you turn standards-based marks into a letter grade?

    With a published conversion rule applied identically every time. The three workable approaches are a fixed crosswalk table, a proficiency threshold based on the proportion of standards met, and a weighted composite with named priority standards. Write the parent-facing version in one paragraph and send it in the first two weeks. Research on grading found that many parents translate standards-based labels back into letter grades regardless of what the school intends, so it is better to hand them the translation than to let them invent one.

    What is the biggest implementation mistake?

    Leaving the rules implicit and letting them emerge from whatever the software defaults to. The five decisions — granularity, scale, how attempts combine, what counts as evidence, and where behavior goes — need explicit written answers that are the same across a department. Students surveyed about standards-based grading complained most about inconsistency between teachers, not about difficulty. Unlimited reassessment is a close second; it produces a workload that collapses by midyear.

    Can one teacher run this if the rest of the school does not?

    Yes, with three conversations first. Confirm with the counseling office how your marks will be recorded on the transcript, since class rank, scholarships, and athletic eligibility depend on a document you do not control. Confirm that your district gradebook can actually hold standards rather than categories pretending to be standards. And agree on a rule for students who transfer in or out mid-term. Start with one course rather than a full schedule.

    Sources

    • Link, Laura J., and Thomas R. Guskey. “Is Standards-Based Grading Effective?” Theory Into Practice, 2022. Full text (PDF).
    • Brookhart, Susan M., Thomas R. Guskey, Alex J. Bowers, James H. McMillan, Jeffrey K. Smith, Lisa F. Smith, Michael T. Stevens, and Megan E. Welsh. “A Century of Grading Research: Meaning and Value in the Most Common Educational Measure.” Review of Educational Research, vol. 86, no. 4, 2016, pp. 803–848. Full text (PDF).
    • Townsley, Matt, and Matthew Varga. “Getting High School Students Ready for College: A Quantitative Study of Standards-Based Grading Practices.” Journal of Research in Education, vol. 28, no. 1, 2017, pp. 93–112. Full text (PDF).
    • Huey, Maryann E., Peter R. Silvey, Amanda G. Vaughan, and Anne L. Fisher. “Assessing the Impact of Standards-Based Grading Policy Changes on Student Performance and Practice Work Completion in Secondary Mathematics.” Studies in Educational Evaluation, vol. 75, 2022, article 101211. Journal listing.
    • Peters, Randal, Jerrid Kruse, Tom Buckmiller, and Matt Townsley. “‘It’s Just Not Fair!’ Making Sense of Secondary Students’ Resistance to a Standards-Based Grading.” American Secondary Education, vol. 45, no. 3, 2017, pp. 9–28. Full text (PDF).
    • Kramer, Karen, Jill Posner, Alexander Browman, Rebecca Lawrence, Jennifer Roem, and Kathryn Krier. “The Impact of a Standards-Based Grading Intervention on Ninth Graders’ Mathematics Learning.” Journal of Research on Educational Effectiveness, 2024. Figures cited here come from the Society for Research on Educational Effectiveness study summary, which is what was read; the full article was not accessible.

    A note on the evidence. Five of the six sources above are peer-reviewed, and they do not agree with each other. That is the accurate state of this field, and a gradebook decision made on the assumption that the research is settled is a decision made on something that is not true.


    About Clay Shumate

    By Clay Shumate — Clay Shumate is a certified secondary Social Studies teacher in the public schools of West Alabama, with seven years of classroom experience, a B.A. in History, and an M.Ed. in Secondary Education. He writes about project-based learning, student responsibility, respect, and practical ways to hold young people to a higher standard while giving them room to learn from mistakes. He is a member of the Society of Professional Journalists and writes to its Code of Ethics; this site’s editorial standards and corrections policy are published in full.

  • The 1–4 Standards-Based Grading Scale, and the Conversion Problem Nobody Solves

    The 1–4 Standards-Based Grading Scale, and the Conversion Problem Nobody Solves

    By Clay Shumate · Updated October 24, 2026

    A 1–4 standards-based grading scale reports how well a student has met a standard, not how many points they accumulated. Four means beyond the standard, three means meeting it, two means approaching it, one means not yet. Three is the target, not four — which is the single thing most families and a fair number of teachers have wrong about it.

    The scale itself is not hard. What is hard is the part nobody puts on the poster: turning those numbers back into a letter grade, because almost every school that adopts a four-point scale still has to file a percentage at the end of the term.

    This page covers what each level means, why four levels rather than a hundred, and the conversion problem — including why the neat conversion chart your district hands out is a convention rather than a measurement.

    Key Takeaways

    • 3 is proficient and it is the goal. A 4 is not “an A” — it is work beyond the grade-level standard, and a student can have an excellent year without many of them.
    • Four levels exist because a hundred do not work. Asked to grade one paper, 90 trained high-school teachers produced scores from 50 to 96.
    • Nearly two-thirds of a 100-point scale describes failure. That is an accident of arithmetic nobody designed on purpose.
    • The zero is the clearest case. Recovering from one zero in a percentage system takes perfect scores on at least nine other assignments.
    • There is no validated conversion from 1–4 to letters. Every chart is an institutional convention — and the published ones converge on 3 = B, which is exactly the message problem rather than a confirmation.
    • Do not average the levels. Averaging reintroduces exactly the precision the scale was built to remove, and it punishes students who improved.
    • Decide what a 3 means before September, in writing, with the department. Most scale arguments are definition arguments wearing a number.

    Free Download · Printable PDF

    1–4 Scale and Conversion Sheet

    The four level descriptors in student-facing language, three conversion approaches side by side, the decision rules that beat averaging, and a one-page explainer you can send home.

    Download the free PDF

    Free. No email address required. Designed for grades 6–12. Rubric templates for each of the four levels are ready to download and adapt in the companion pack.

    What Does Each Level on a 1–4 Grading Scale Mean?

    There is no national definition, which is worth saying out loud before anyone quotes one at you. Schools write their own descriptors, and they vary. The shape is consistent though, and this family-facing version from Gateway Public Schools is about as standard as it gets:

    The four levels of a standards-based grading scale, in order: below standard, approaching, meeting, exceeding
    Three is the target. Four is a different kind of work, not a better grade.

    A 4 “consistently exceeds expectations” for skills and understanding. A 3 consistently meets them. A 2 meets some of them. A 1 meets few.

    Read the word consistently in the first two. It is doing more work than the numbers. A student who produced one brilliant analysis in October and nothing like it since is not a 4, and a student who has hit the standard on the last three attempts is a 3 even if the first attempt was dreadful. The scale is a claim about where a student is now, not a summary of everything they have ever handed in.

    The 4 causes most of the trouble at home, because families read four levels and assume A/B/C/D. It is not that. A 4 is work that goes past the grade-level standard — a different kind of task, not a tidier version of the same one. A student can meet every standard in your course, be entirely successful by any honest account, and collect very few 4s. If your reporting language does not say that plainly, you will spend October explaining it one parent at a time.

    Why Use a 1–4 Scale Instead of 100 Points?

    Because nobody can tell the difference between an 84 and an 86, and pretending otherwise has a cost.

    Three problems with the 100-point grading scale: two-thirds is failure, teachers disagree widely, one zero is unrecoverable
    The four-point scale is not a simplification. It is a correction.

    Thomas Guskey has made this case more carefully than anyone. In The Case Against Percentage Grades he points out that with a pass mark around 60, nearly two-thirds of the percentage scale describes levels of failure — sixty-odd gradations of failing and about forty of succeeding. No one chose that. It is what happens when you inherit a scale and never ask what it is for.

    On reliability he cites a 2011 replication of a study first run in 1912. Ninety high-school teachers, given twenty hours of training, scored the same paper. The scores ranged from 50 to 96. More levels do not produce more accuracy; Guskey’s phrase for it is the illusion of precision, and his point is that with more levels more students are simply misclassified.

    Then the zero, which is the cleanest arithmetic in the whole argument. To recover from a single zero in a percentage system, a student must earn a perfect score on at least nine other assignments. On a 0–4 scale the same missing piece of work costs about what it should. Guskey recommends integer scales for exactly this reason, and notes they line up with the GPA scale and with state assessment levels that already use four.

    Worth being honest about what this evidence is. It is an argument about measurement and reliability, not a trial showing that four-point scales raise achievement. What the outcome evidence on standards-based grading actually shows is a separate and more mixed question. The case for four levels is that the number you report means something. That is a real benefit and it is not the same as a test-score claim.

    How Do You Convert a 1–4 Grading Scale to Letter Grades?

    Here is the part the training day skips. Almost every school running a 1–4 scale still has to produce a letter grade, a GPA, or a transcript percentage — and there is no validated way to get from one to the other. The same spacing problem drives the argument on a 100-point scale, where entering a floor instead of a zero is the usual response.

    If you came here for the chart, here it is — three real ones, from schools that publish their conversion rule. Read the row for 3 before anything else. All three land a proficient student on a B, and the two Vermont schools are reproduced in the state Agency of Education’s own guidance, which declines to endorse them and calls the symbols “arbitrary” next to the learning they stand for (Vermont Agency of Education, Vermont Proficiency-Based Grading Practices, rev. February 2021; EAS Standards-Based Grading Conversion Chart, Lake Washington School District).

    1–4 to letter grade · three published district charts

    Three real conversion charts, side by side. They agree on the thing that matters least and disagree on the edges.
    Level What it means Champlain Valley Union HS (VT) Montpelier HS (VT) EAS, Lake Washington SD (WA)
    4 Consistently exceeds the standard 3.9–4.0 = A+ · 3.7–3.8 = A · 3.5–3.6 = A− 3.80–4.0 = A+ · 3.60–3.79 = A · 3.40–3.59 = A− 100% = A · 95% = A
    3 Consistently meets the standard — the target 3.3–3.4 = B+ · 3.0–3.2 = B · 2.7–2.9 = B− 3.20–3.39 = B+ · 3.00–3.19 = B · 2.80–2.99 = B− 92% = B+ down to 85% = B
    2 Meets some of the standard 2.4–2.6 = C+ · 2.0–2.3 = C · 1.8–1.9 = C− 2.50–2.79 = C+ · 2.20–2.49 = C · 2.00–2.19 = C− 80% = B down to 70% = C
    1 Meets few of the standard 1.5–1.7 = D+ · 1.3–1.4 = D · 1.0–1.2 = D− · below 1.0 = F 1.80–1.99 = D+ · 1.60–1.79 = D · 1.50–1.59 = D− · below 1.50 = F 64% = D+ · 57% = D · no evidence = 0% F

    Look at where they part company. Champlain Valley fails a student below 1.0; Montpelier fails one below 1.50, so the same body of work is a D− in one building and an F in the other. EAS puts a 2 as high as a B. The convergence on 3 = B is not evidence that B is correct — it is evidence that everyone inherited the same habit of hanging the new scale on the old one. That is the problem this page is about, not the solution to it.

    Three approaches to converting a 1-4 standards scale into letter grades, with what each one distorts
    Every conversion chart is a local convention. None of them is a measurement.

    Districts generally pick one of three approaches. A direct map assigns a letter to each level: 4 is an A, 3 a B, and so on. It is simple and it quietly tells every proficient student they are a B student, which is both demoralising and false. A weighted map puts 3 at an A or A− and reserves the top only for consistent 4s, which fixes the message and compresses everything below into very little room. A decision-rule approach sets conditions instead of arithmetic — an A requires 3s on all standards and 4s on some, a B requires 3s on nearly all — which is the most defensible and the hardest to explain on a progress report.

    None of those is discovered. They are all chosen. If you are looking for the correct conversion chart, stop: what you are actually choosing is what your school wants a letter grade to mean, and the arithmetic follows from that decision rather than producing it.

    The question underneath the family anxiety is usually GPA, and it deserves a straight answer. A transcript still has to carry letters or a grade point, so the conversion your district picks is the thing that reaches a college — not your levels. A direct map that makes proficient students into B students will pull a GPA down relative to a neighbouring district doing it differently, and that is a real consequence rather than a misunderstanding to be explained away. If your school is adopting a four-point scale, someone should model what it does to the GPA distribution before it goes live, and should be able to tell families the answer. “It all works out” is not an answer.

    Which is why the one genuinely portable rule is a negative one.

    Do not average the levels

    Averaging is the default in every gradebook and it undoes the scale. Three reasons, in order of how much damage they do.

    It reintroduces false precision. A student with levels of 2, 3 and 3 averages to 2.67, and 2.67 is not a thing. The scale has four values because four is roughly what professional judgement can reliably distinguish. Producing two decimal places from it is the exact error the scale was adopted to stop.

    It punishes the students who improved. A student who goes 1, 2, 3, 3 has learned the thing. Their average says 2.25 — approaching. Their most recent evidence says 3. One of those numbers is a description of a student and the other is a description of their history, and only one of them is what a grade is supposed to report.

    It hides the pattern that matters. Two students both averaging 2.5 — one going 3, 3, 2, 2 and one going 2, 2, 3, 3 — need opposite conversations. The average erases the only information that would tell you which is which.

    The usual alternatives are the most recent evidence, the mode, or professional judgement with the pattern in front of you. All three are defensible; all three require you to be able to say why. That is a feature, and it is also why this works far better when a department agrees the rule together rather than each teacher inventing one, which is the same failure mode as most of the ways standards-based grading goes wrong.

    Two practical warnings. The first is that your gradebook will fight you: most systems average by default, several will not store a non-numeric level at all, and a few will happily average your levels behind the scenes while displaying something else. Find out which yours does before you trust a term’s worth of data to it.

    The second is about the scale’s own reliability, and it would be dishonest to leave out. Fewer levels reduce disagreement between teachers; they do not remove it. Two teachers in the same department, marking the same essay against the same descriptors, will still hand back a 2 and a 3 often enough to matter to the student sitting between them. The fix is not a better rubric, it is moderation — a department periodically marking the same three pieces of work and arguing until the descriptors mean the same thing to everyone. An hour a term does more for grading accuracy than any conversion chart.

    Let Them Argue Their Own Level

    The most useful thing I do with this scale is not marking with it. It is making students say a number out loud and defend it.

    In a project check-in the question is not how is it going — that gets you fine. The question is which level the work is currently at and what would move it up one. They have the descriptors. They have their own draft. They have to make the case, and I get to hear the reasoning rather than guess at it.

    What happens is consistently more interesting than the grade. Students undersell by about a level and can usually name precisely what is missing, which means the gap was never that they did not know — it was that nobody had asked them to say it. A student who can tell you they are at a 2 because their evidence is thin in the second section has just written their own next step, and they will do it because it was theirs.

    It also does something to the scale itself. A number a student has argued for is a number they understand. A number that arrives on a report card is a verdict, and teenagers treat verdicts the way anyone does — as something to contest or absorb, but not as information. What the report card itself is trying to say is a separate puzzle, and reading a standards based report card is worth walking through with families before the first one goes home. If you want a structure for this rather than an improvised conversation, a short self-assessment form does most of the work — and it is worth being clear first about what student self assessment actually asks of a teenager.

    One thing the scale should never become is a label. A 1 or a 2 is a statement about a piece of work at a point in time and it is supposed to trigger something — a re-teach, a conference, a second attempt that actually counts. If a student sits at 2 for six weeks and the only consequence is that the 2 keeps being recorded, the scale has stopped doing its job and become a slower way of writing a D. The number is a prompt for the adult, not a verdict on the child. I give away a free test-corrections and retake request form for teachers who want the second attempt to be a process rather than a favour.

    What If Your District Requires Percentages Anyway?

    Most teachers reading this do not get to choose the reporting system. That is fine and the scale is still worth using; you just have to keep the two jobs separate — which is mostly a question of how the columns are set up before the first unit is graded.

    • Assess in levels, report in whatever they require. The conversion happens once, at the end, as a deliberate act rather than a running total.
    • Keep the level in front of students all term. They should see 1–4 on returned work even if the portal shows a percentage, because the level is the part they can act on.
    • Write your conversion rule down before you need it and give it to students and families in September. A rule published in advance is a policy; the same rule produced in May is an argument.
    • Never convert a single assignment. Convert the body of evidence for a standard, once. Converting each task and then averaging the percentages is the worst of both systems.
    • Expect the first term to be rough and say so. Families are fluent in percentages and your scale is new to them.

    And if you are the person choosing the system rather than living inside it, the honest brief is: a four-point scale buys you numbers that mean something and costs you a conversion argument you will have every year. That is usually a good trade. It is not a free one, and schools that present it as free are the ones that abandon it in year two.

    One place the conversion argument shows up every semester is the midterm. Whatever level you report, a family wants to see the evidence behind it, and a printed exam with an answer key is the easiest piece to point at. If you need one, Mid-Terms.org has 200 free printable midterm exams for grades 6–12 with answer keys, plus a Midterm Maker that builds a custom test from only the units you taught.

    Before you go: grab the free 1–4 Scale and Conversion Sheet (PDF) — ElevateTheNorm.com branded, printable, no email required.

    Frequently Asked Questions

    Still reporting on percentages? Our breakdown of the 10 point grading scale has the chart, the cutoffs, and what actually changes for a student sitting at 69 instead of 70.

    What does each number mean on a 1–4 standards-based grading scale?

    4 means the work consistently goes beyond the grade-level standard, 3 means it consistently meets the standard, 2 means it meets some expectations, and 1 means it meets few. There is no national definition — schools write their own descriptors and they vary — but that shape is close to universal. The word doing the most work is “consistently”: the level describes where a student is now, across recent evidence, not an average of everything they have ever submitted.

    Is there a standard 1–4 grading scale conversion chart?

    No. There is no validated conversion from a 1–4 scale to letter grades; every chart is a local convention. Published examples differ at the edges: Champlain Valley Union HS fails a student below 1.0, while Montpelier HS fails one below 1.50. What they share is putting a 3.0 at a B. Use the chart your district publishes, and know it is a choice, not a measurement.

    What percentage is a 3 on a 1–4 grading scale?

    It depends on the district’s chart. Lake Washington’s EAS chart maps a 3 to roughly 85–92 percent, a B to B+. Champlain Valley Union HS treats 3.0–3.2 as a B and Montpelier HS treats 3.00–3.19 as a B. A 3 means the student met the standard, so many schools that rethink the conversion place it at an A or A− instead.

    Is a 3 a B?

    Only if your district decided it is, and that decision is a convention rather than a measurement. A 3 means the student has met the standard, which in most schools’ own language is exactly what they were asked to do. Mapping that to a B tells every proficient student they are second-tier, which is both discouraging and inaccurate. Schools that think it through usually land on 3 as an A or A−, with the very top reserved for consistent 4s.

    Should I average standards-based grading scores?

    No. Averaging 2, 3 and 3 into 2.67 manufactures a precision the scale exists to avoid, and it penalises exactly the students who improved — a student who went 1, 2, 3, 3 has learned the material, whatever the mean says. Use the most recent evidence, the mode, or professional judgement with the whole pattern visible. Whichever you pick, agree it with your department and publish it before the term starts.

    Why not just use percentages?

    Because they are less accurate than they look. With a pass mark near 60, roughly two-thirds of a 100-point scale describes gradations of failure, and reliability research is unkind: asked to score one paper, 90 trained high-school teachers produced marks from 50 to 96. Then there is the zero — recovering from a single zero requires a perfect score on at least nine other assignments, which is a punishment nobody consciously designed.

    How do I explain the 1–4 scale to parents?

    Lead with the fact that 3 is the goal, because that is the misunderstanding underneath almost every worried email. Say plainly that a 4 is work beyond the grade-level standard rather than a better version of the same work, and that a student can be entirely successful with few 4s. Send it in writing in September, before any scores exist — the same explanation lands very differently once a family is looking at a number they do not like.

    What if a student improves a lot at the end of the term?

    Then their level should reflect that, which is the main practical advantage of the scale over a running average. A student who finishes the term demonstrating proficiency has demonstrated proficiency; a system that averages away their improvement is reporting their history rather than their learning. The check worth running is whether the recent evidence is genuinely consistent rather than one good day.

    Does standards-based grading hurt my child’s GPA?

    It depends entirely on the conversion your district chose, which is a decision rather than a property of the scale. A direct map where a 3 becomes a B will produce lower grade points than a weighted map where a 3 is an A−, for identical work. Since a transcript still carries letters or grade points, that choice is what actually reaches a college. It is a fair question to ask your school, and the right form of it is specific: what does a 3 convert to, and what happened to the GPA distribution the year you adopted this?

    Does a 1–4 scale improve student achievement?

    That is a different and much less settled question than whether it measures more honestly. The case for four levels is a measurement argument — fewer levels mean fewer misclassifications and a number that means something. The evidence on whether standards-based grading as a whole moves outcomes is genuinely mixed, and anyone selling it as a proven achievement intervention is going past what the research supports.

    Sources

    • Guskey, T. R. The Case Against Percentage Grades. Read the paper (PDF) — source for the two-thirds-of-the-scale-is-failure point, the 2011 replication in which 90 trained high-school teachers scored one paper from 50 to 96, the nine-assignments-to-recover-from-one-zero figure, and the recommendation to use integer 0–4 scales. This is an argument from measurement and reliability research; it is not a trial of student outcomes, and it should not be cited as one.
    • Gateway Public Schools. Grading and the four-point scale: an overview for families. Read the overview (PDF) — source for the level descriptors quoted above. One school’s definitions, used here because they are clearly written and representative; there is no national standard, and your district’s wording governs in your building.
    • Vermont Agency of Education. Vermont Proficiency-Based Grading Practices, revised February 9, 2021. Read the guidance (PDF) — source for the Champlain Valley Union HS and Montpelier HS rows in the conversion table. A state agency reproducing two local charts, not endorsing them: the document calls the choice between 1–4, descriptor labels and A–F “arbitrary” relative to the learning they represent, and frames conversion as a communication bridge during transition rather than an equivalence.
    • Lake Washington School District. EAS Standards-Based Grading Conversion Chart. Read the chart (PDF) — source for the percentage column. Note the population: EAS is a 5–8 school and the chart exists to translate a percentage-based gradebook back into proficiency levels, which is the reverse of the direction most readers need. It is included because it is a real published percentage mapping, not because it is a model to copy.

    Links checked September 17, 2026; the two conversion-chart sources added and checked October 4, 2026. The three conversion approaches described in this article are common practice observed across published district policies, not findings from a study — there is no validated conversion between a four-point scale and letter grades, which is precisely the argument this page is making.


    About Clay Shumate

    By Clay Shumate — Clay Shumate is a certified secondary Social Studies teacher in the public schools of West Alabama, with seven years of classroom experience, a B.A. in History, and an M.Ed. in Secondary Education. He writes about project-based learning, student responsibility, respect, and practical ways to hold young people to a higher standard while giving them room to learn from mistakes. He is a member of the Society of Professional Journalists and writes to its Code of Ethics; this site’s editorial standards and corrections policy are published in full.

Teacher Emergency Toolkit — practical resources, real classroom support. Shop on TPT.Teacher Emergency Toolkit — practical resources, real classroom support. Shop on TPT.