By Clay Shumate
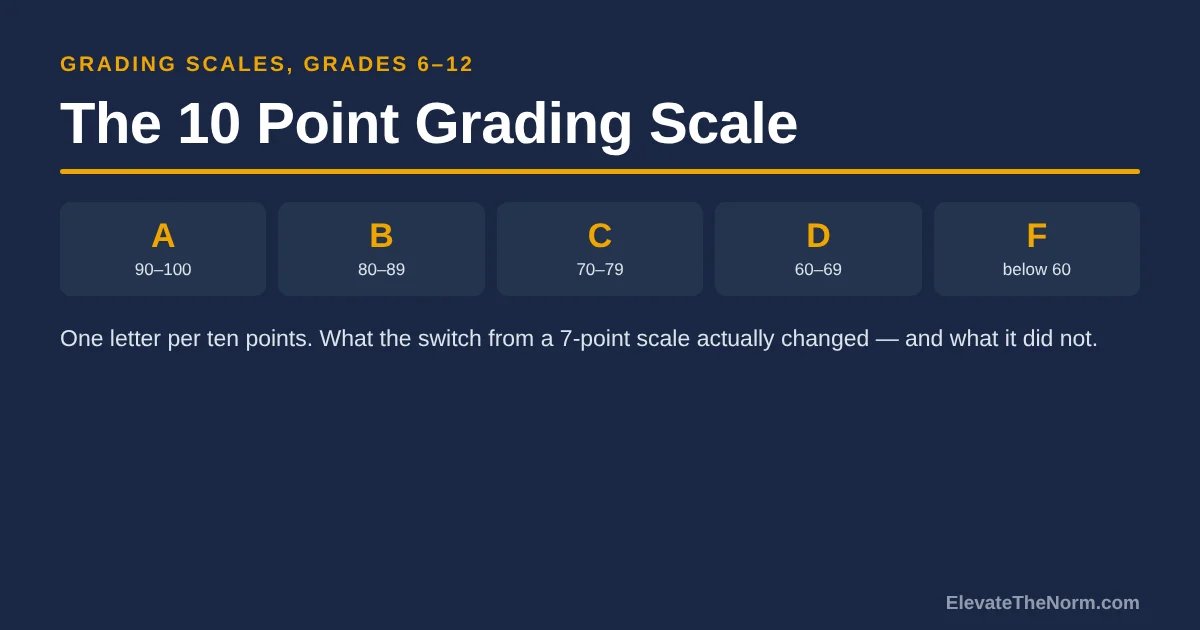
A 10 point grading scale gives each letter grade a ten-point band: 90–100 is an A, 80–89 a B, 70–79 a C, 60–69 a D, and anything under 60 is an F. It replaced the older seven-point scale, where an A started at 93. Same work, wider bands, different letter on the transcript.
That is the whole mechanical answer, and it is the part people come looking for. The part worth staying for is what the switch actually did, because it was never sold as a teaching improvement and it never was one. It moved lines on a page. Whether that helps a student depends entirely on what you do inside the bands.
Key Takeaways
- One letter per ten points. A 90–100, B 80–89, C 70–79, D 60–69, F below 60. North Carolina’s state policy writes the bottom band as “below 59,” which leaves 59 unassigned — a small drafting gap that has been sitting in an adopted statewide policy for years.
- The seven-point scale it replaced started an A at 93 and a B at 85. A student with an 86 average was a B on both scales. A student with a 91 was an A on one and a B on the other.
- States switched for transcript comparability, not learning. North Carolina’s board voted on 2 October 2014; South Carolina’s approved unanimously on 13 April 2016. Both rationales were about college admissions, scholarships and transferring families.
- No study shows that widening a band teaches anybody anything. What it changes is which side of a line a student lands on, and how many students sit near a line at all.
- The research on scale length is not kind to percentages. Simulation work puts the useful number of categories at four to seven. A percentage scale has 101. Asked to grade one paper, 73 teachers trained in writing assessment produced scores from 50 to 96.
What Is a 10 Point Grading Scale?
It is a percentage grading scale where every letter covers exactly ten points, so the cutoffs land on round numbers: 90, 80, 70, 60. Here is the chart, with the 4.0 quality points most transcripts attach to each letter.
| Letter | Percent | Standard quality points | What it is usually called |
|---|---|---|---|
| A | 90–100 | 4.0 | Exceeds or fully meets |
| B | 80–89 | 3.0 | Meets |
| C | 70–79 | 2.0 | Partially meets |
| D | 60–69 | 1.0 | Credit, barely |
| F | below 60 | 0.0 | No credit |
Weighting sits on top of that and is where a lot of transcript confusion actually lives. Under North Carolina’s policy, honors courses add 0.5 quality points and AP, IB, Cambridge and eligible dual-enrollment courses add 1.0 — so an A in an AP course is a 5.0, and a student can finish with a weighted GPA above 4.0 while every single grade was earned on the same ten-point bands. Students get both an unweighted and a weighted GPA, and official class rank comes off the weighted one.
One more thing the chart hides: the scale is a reporting rule, not a grading method. It tells you what band a number falls in. It says nothing about how the number was produced, which is the only part you control.
How Is a 7 Point Grading Scale Different?
The seven-point scale sets an A at 93–100, a B at 85–92, a C at 77–84 and a D at 70–76, with failure starting at 69. Every cutoff is higher, and the F band is much smaller.
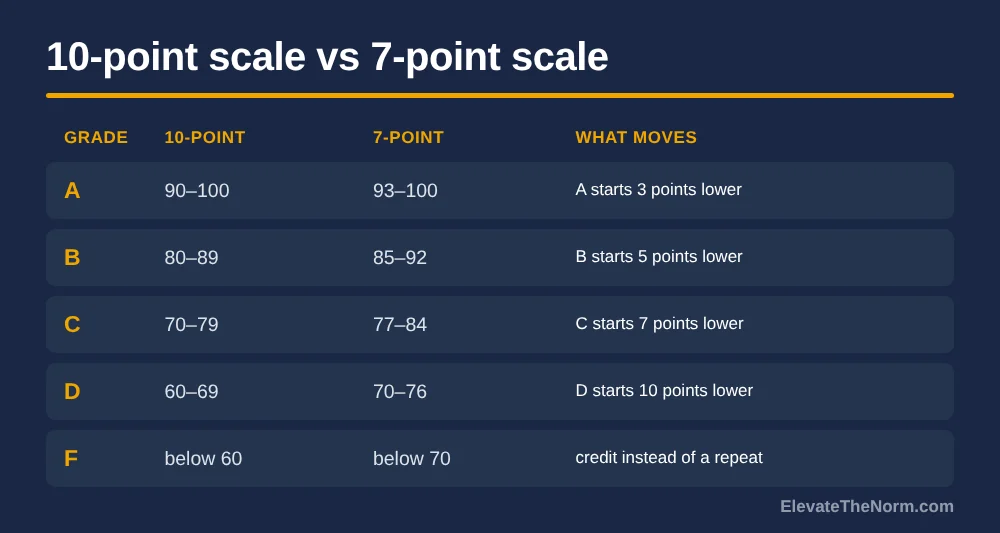
Run a few numbers through both and the pattern shows up fast. A 91 is an A on the ten-point scale and a B on the seven-point. An 86 is a B either way. A 76 is a C on one and a D on the other. A 69 is a D on the ten-point scale and an F on the seven-point — that is the real one, because it is the difference between credit and a repeated course.
When North Carolina made the change, a local report put the problem in one sentence: a student with a 91 in every class had a 4.0 in Atlanta and a 3.0 at home. That is not a rigor argument. It is a paperwork argument, and it was a fair one.
Notice what the comparison does not show. It does not show that students on one scale learn more. Both scales are percentage scales. Both carry every problem a percentage scale has. One of them just puts the walls in different places.
Why Did States Switch to a 10 Point Grading Scale?
Because transcripts were not comparable across state lines, and students were losing scholarships to arithmetic.
North Carolina’s State Board of Education approved the ten-point range on 2 October 2014, beginning with freshmen in 2015–16. Elementary and middle schools kept the right to use a locally approved system, though the state recommends the same 90–100 scale, and any high school course taken in middle school has to use the high school scale.
South Carolina’s State Board approved a uniform ten-point scale unanimously on 13 April 2016, effective 2016–17. The reasons the department gave were specific: students from military and other transferring families were being penalized, in-state students were at a disadvantage against neighbors applying to the same colleges, and dual-credit students were being graded on two scales at once. The department also said it would re-examine its Hope, Life and Palmetto Fellows scholarship requirements “to ensure fairness and rigor” afterward — which is the quiet admission that moving cutoffs moves who qualifies for money.
That is the honest case for the switch, and it is strong. It is also narrow. Nobody in either state claimed a wider B band would improve a single lesson, and nobody should quote them as if they had.
If you are the one who has to implement a change like that, the hard part is not the new chart. South Carolina’s department named the real work in its own announcement: deciding the timing, merging grade calculations for students already enrolled, and preparing for the knock-on effect on lottery-funded scholarships. For a year or two you have students in the same building whose transcripts were built on two different rules, and every one of those families deserves a plain-language explanation before they ask for one.
Does a 10 Point Grading Scale Make Grades Easier?
It lowers four cutoffs, so on identical work more students clear each line. That is not the same thing as grade inflation, and the two get confused constantly.
Grade inflation is real and it is measurable. An ACT study of one southern state’s ACT-tested public high school graduates found mean self-reported GPA rose from 3.17 in the 2017 class to 3.38 in 2022 — about 0.21 grade points after adjusting for test scores, with school-level estimates running from roughly −0.3 to 0.7. It also found inflation weakened what a GPA predicts: for two students with a 2.5, the one from a school with 0.5 of inflation was projected to finish first-year college 0.37 GPA points lower.
Read that carefully before you use it. That study is one state, a sample the authors describe as predominantly White and female, and it measured inflation across a five-year window that included the pandemic. It does not attribute any of the rise to scale changes, and it does not test scale changes at all. Anyone telling you the ten-point scale caused grade inflation is borrowing a real number to support a claim nobody has tested.
One finding in it does deserve attention from anyone thinking about equity: the inflation the study estimated was more pronounced at schools whose average GPAs were lower to begin with. If a GPA means less coming out of the schools whose students can least afford a discounted signal, that is a problem worth naming — and it is a problem about grading practice, not about where the A cutoff sits.
What the scale change genuinely does is a one-time shift in the distribution. Every student near a cutoff moves up a letter once, and then the system settles. If grades keep climbing after that, the cause is somewhere else — in retake policies, in how late work gets scored, in extra credit, in what gets averaged into the gradebook at all.
How Many Levels Should a Grading Scale Have?
Fewer than a hundred. The simulation research lands on four to seven categories, and a percentage scale has 101.
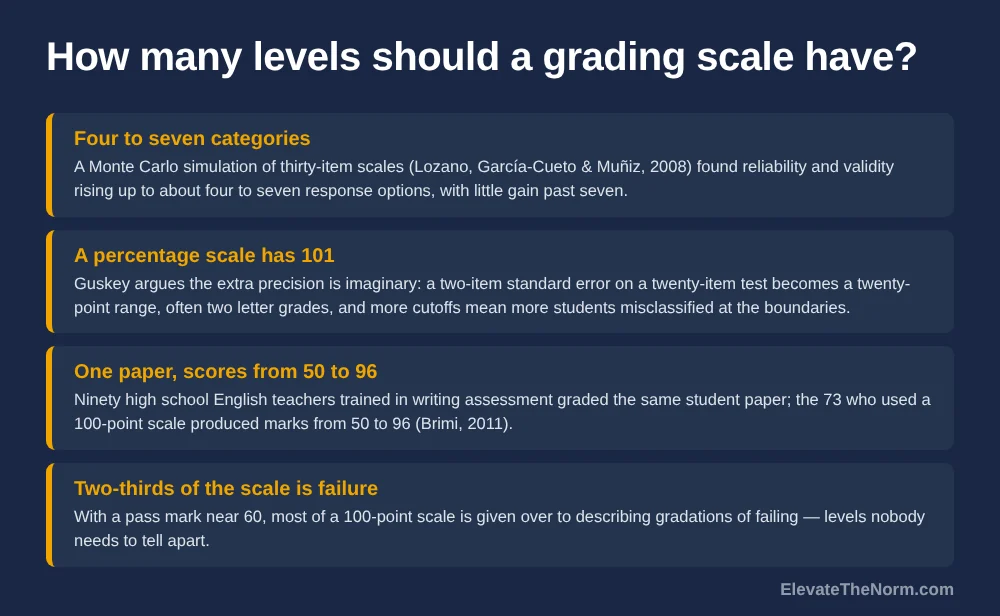
Lozano, García-Cueto and Muñiz simulated thirty-item scales across sample sizes from 50 to 500 and response options from two to nine. Reliability and validity improved as options increased, but the gains flattened out: their conclusion was that the optimum sits between four and seven, that fewer than four costs you real precision, and that past seven the improvement is small. That is a psychometric simulation, not a classroom study, and it is about rating scales generally rather than report cards — but 101 is not within shouting distance of seven.
Thomas Guskey has made the applied version of this argument for years. His case against percentage grades is that the precision is imaginary: a standard error of two items on a twenty-item test becomes a twenty-point range on a percentage scale, often spanning two letter grades. More cutoffs mean more students misclassified at boundaries, not fewer. And with a pass mark near 60, roughly two-thirds of the scale is devoted to describing gradations of failure that nobody needs.
The reliability evidence underneath that is older than most grading debates. In 1912 and 1913, Starch and Elliott had 147 high school English teachers grade two identical papers — scores ran 64 to 98 on one and 50 to 97 on the other — and 128 mathematics teachers grade geometry papers, where one paper drew scores from 28 to 95. A century later Hunter Brimi ran the replication with teachers trained in a writing-assessment framework. Ninety teachers graded one paper; the 73 who used a 100-point scale produced scores from 50 to 96.
Here is the part that cuts against the easy conclusion. If fewer levels are better, then the ten-point scale is an improvement on the seven-point one, because its bands are wider and its boundaries are fewer in the range where students actually cluster. But it is still a percentage scale with 101 levels underneath the letters, and Guskey’s own recommendation is not a wider percentage band at all — it is a 0–4 integer scale. If you want that argument in full, including why the conversion back to a letter is the hard part, it is in the 1–4 scale and its conversion problem, and the system it belongs to is laid out in what standards-based grading actually fixes.
What Changes for a Student at 69 Instead of 70?
On a ten-point scale, nearly nothing: 69 is a D and the student gets credit. On a seven-point scale, 69 is an F and the course gets repeated. Same work, same kid, different year.
That is the strongest practical argument for the wider bands, and it deserves to be stated plainly rather than buried in a policy rationale. It is also the argument that should make you look hard at your own gradebook, because the scale is not what put the student at 69. Something else did, and a wider band does not fix it. It just stops that particular thing from costing a credit.
There is a cost on the other side, and it is worth saying before someone else does. A ten-point scale hands out credit at 60 that a seven-point scale withheld until 70. Some of those students walk into the next course without the ground under them, and the transcript says they are fine. The letter is not the problem there — the problem is a student moving up without the skill, and nothing about the band width tells you which students those are. That is what the boundary review in the next section is for.
The zero is where this gets ugly. On a 100-point scale a single zero is not one bad grade, it is a hole — moving a student from a zero to passing takes six or seven times the gain that moving a B to an A takes. Guskey, Fisher and Frey call minimum-grade policies a Band-Aid for exactly this reason: a 50 percent floor is an attempt to fix the arithmetic of the scale without changing the scale, and teachers using one are still sorting among fifty-one levels of not-passing. Several districts have put floors in and then pulled them back out; Texas legislated against them.
None of that is an argument for giving a student a number they did not earn. It is an argument for not building a system where one missed assignment is mathematically unrecoverable. If a student can screw up that badly in your class, look at the planning before you look at the student — and give them a real route back, whether that is test corrections that actually teach or a reassessment with the same standard and a new attempt.


How Do You Run a 10 Point Scale Without Lying to Students?
Treat the scale as the reporting rule it is, and put your effort into what produces the number. Five things, in order.
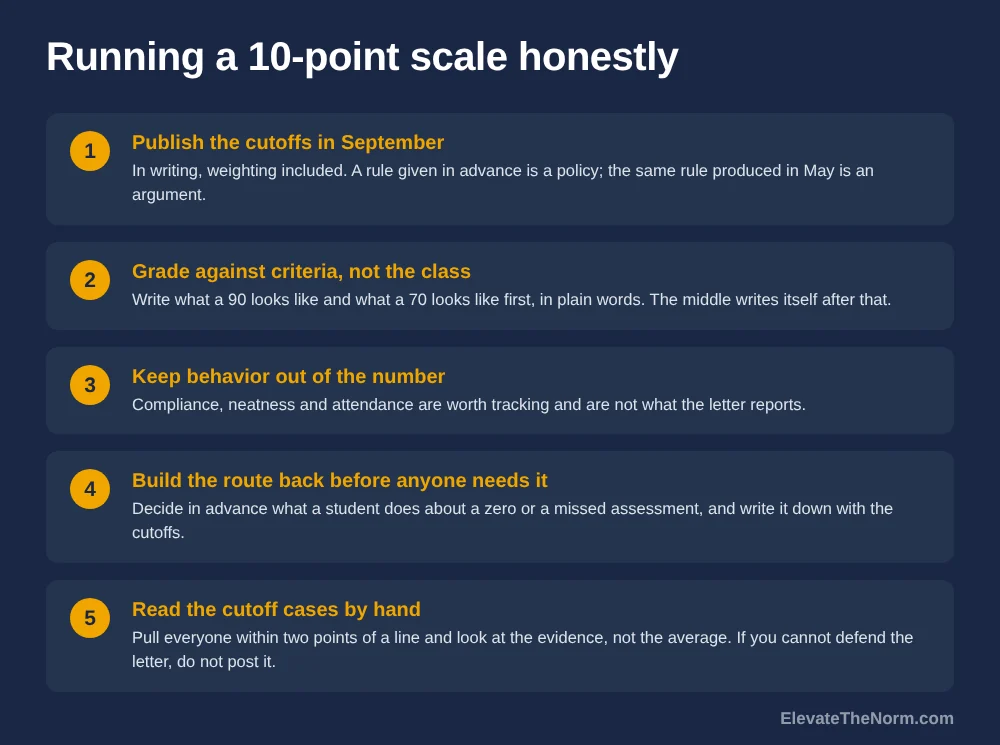
- Publish the cutoffs in September, in writing. A rule given in advance is a policy. The same rule produced in May is an argument you will lose. Include the weighting if your school weights, because that is where families get blindsided.
- Grade against criteria, not against the class. A ten-point band is only meaningful if 85 means something describable. If it means “a bit above the middle of this particular group,” the band is decoration. A written description of what each level looks like does more for accuracy than any cutoff you pick, and the quickest way in is to write the description of a 90 and the description of a 70 first. Once the top and the pass line are on paper in plain words, the middle writes itself.
- Keep behavior out of the number. Compliance, neatness and attendance are real and worth tracking, and they are not what the letter is supposed to report. Starch and Elliott found teachers deducting for neatness and spelling on geometry papers in 1913. That has not gone away on its own.
- Build the route back before anyone needs it. Decide in advance what a student does about a zero, a missed assessment, or a standard they have not reached yet — and write it down with the cutoffs. Deciding case by case is how you end up being generous to the students who ask and strict with the ones who do not.
- Read the cutoff cases by hand before grades post. Pull everyone within two points of a line and look at the evidence instead of the average. In most sections that is a handful of students, and it is a few minutes of reading rather than a re-grade. The arithmetic put them there; your judgment is what the cutoff was always standing in for. If you cannot defend the letter to the student, do not post it — and if the student thinks you have it wrong, let them bring the evidence and make the case. A sixteen-year-old arguing from their own work is the best outcome on this entire list.
Then say it out loud to the room. Students handle a hard line fine when it was announced in advance and applied the same way to everybody. What they do not forgive is a cutoff that moved. Doing exactly what you said you would do is the entire mechanism, and it works the same way with families as it does with a seventeen-year-old staring at an 89.
What to Do Next
If you are a teacher on a ten-point scale, you do not get to choose it, so spend your effort on the four steps above that are yours: published cutoffs, criteria instead of a curve, behavior out of the number, and a hand-read of the boundary cases. The band is somebody else’s decision. The number inside it is yours.
If you are the one choosing the system, the honest brief is short. Moving from seven points to ten buys you comparable transcripts, fewer students failing on a technicality, and fewer boundaries to misclassify at — and it buys you nothing instructional. If you want the scale itself to carry meaning, the evidence points past percentages altogether, toward four to seven levels with written descriptors. Start with how the gradebook has to be set up, because that is the part that decides whether a new scale survives its second year.
And either way, write your rule down before you need it. That single habit prevents more grading arguments than any scale ever has.
Frequently Asked Questions
What is a 10 point grading scale?
A 10 point grading scale gives each letter grade a ten-point band: 90–100 is an A, 80–89 a B, 70–79 a C, 60–69 a D, and anything below 60 is an F. On a standard 4.0 transcript those letters carry 4, 3, 2, 1 and 0 quality points. North Carolina’s state policy writes the bottom band as “below 59,” which technically leaves a score of exactly 59 unassigned.
What is the difference between a 10 point and a 7 point grading scale?
Every cutoff moves. On a seven-point scale an A starts at 93, a B at 85, a C at 77 and a D at 70, so failure begins at 69. On a ten-point scale those lines are 90, 80, 70 and 60. A 91 is an A on the ten-point scale and a B on the seven-point one. A 69 is a D on the ten-point scale and an F on the seven-point — the difference between earning credit and repeating the course.
Is a 10 point grading scale easier?
On identical work, more students clear each line, because four cutoffs moved down. That is arithmetic, not generosity, and it happens once when the scale changes rather than year after year. It is not the same thing as grade inflation, and no study has tested whether switching scales causes inflation. If grades keep climbing after the transition year, look at retake rules, late-work scoring and extra credit rather than the chart.
Why did states switch to a 10 point grading scale?
For transcript comparability, not for learning. North Carolina’s State Board approved the change on 2 October 2014, starting with 2015–16 freshmen, after reporting that a student with a 91 average could hold a 4.0 in one state and a 3.0 in another. South Carolina’s board approved a uniform ten-point scale unanimously on 13 April 2016, citing transferring military families, college admissions, scholarships and dual-credit students graded on two scales at once.
Should a teacher round an 89 up to an A?
Decide the rule before September and then apply it to everyone, which is the only version of this that is fair. A published rule is a policy; the same decision made in May for one student is a favor, and the rest of the class will hear about it. The defensible practice is to review every student within a point or two of a line against the actual evidence rather than the average, and let a student who disagrees bring their work and make the case.
Is a D a passing grade on a 10 point grading scale?
A D (60–69) normally earns course credit and one quality point, so it passes. Whether it counts toward a specific requirement is a separate question — many graduation pathways, athletic eligibility rules, NCAA core-course lists and college prerequisites set a higher floor than a D. It is also the band most worth a second look, because a student can clear 60 and still walk into the next course without the ground under them.
Does a 10 point grading scale hurt college admissions?
It generally helps, which is why states adopted it. Admissions offices recalculate GPAs, and a student graded on a seven-point scale was arriving with a lower number than an identically performing student from a ten-point state. The scale change removes that penalty. It does not change course rigor, test scores or the weighted GPA mechanics, where honors courses usually add 0.5 quality points and AP, IB or dual-enrollment courses add 1.0.
How many levels should a grading scale have?
The research points to far fewer than a hundred. A simulation study by Lozano, García-Cueto and Muñiz across thirty-item scales found reliability and validity improving up to about four to seven response categories, with little gain beyond seven. A percentage scale has 101. Asked to grade one paper, 73 teachers trained in writing assessment produced scores from 50 to 96, and in 1912 Starch and Elliott found English teachers scoring one identical paper from 64 to 98.
Sources
- North Carolina State Board of Education. GRAD-009: High School Grading and Transcript Standards. Adopted 1 June 2017, last revised 7 November 2024. States the required high school scale (A 90–100, B 80–89, C 70–79, D 60–69, F below 59), the 4.0 quality-point values, honors +0.5 and AP/IB/CIE/college +1.0 weighting in force since 2015–16, dual unweighted and weighted GPAs, and the local option for grades K–8. The policy text reads “< 59 = F,” which leaves a score of exactly 59 unassigned; that is reported here as written. GRAD-009 (PDF)
- South Carolina Department of Education. 10-Point Uniform Grading Scale Approved by State Board of Education. News release, 13 April 2016. Unanimous approval effective 2016–17; rationale covers transferring military families, parity for college admissions and scholarships, and dual-credit students; notes the implementation work of merging calculations for enrolled students and reviewing the Hope, Life and Palmetto Fellows scholarships. The release does not publish the cutoff percentages, so South Carolina’s specific bands are not stated in this article. ed.sc.gov
- WRAL. NC changes high school grading scale. 2 October 2014. Reports the State Board vote, the prior seven-point ranges (A 93–100, B 85–92, failing below 70), the 2015–16 freshman start, and the 91-average example yielding a 4.0 in Atlanta against a 3.0 in North Carolina. News reporting, cited for the vote date and the comparison it states rather than as research. wral.com
- Guskey, T. R. (2013). The Case Against Percentage Grades. Educational Leadership, 71(1), 68–72. Argues that a 100-level scale creates false precision (a two-item standard error on a twenty-item test becomes a twenty-point range), that more cutoffs mean more boundary misclassification, that roughly two-thirds of the scale describes failure once the pass mark sits near 60, and that a single zero takes six or seven times the gain of a B-to-A move to recover from. Recommends a 0–4 integer scale instead. Read in the author’s own posted copy; this is an argument article, not an empirical study, and his recommendation is not a wider percentage band. tguskey.com (PDF)
- Guskey, T. R., Fisher, D., & Frey, N. (2024). The Unwinnable Battle Over Minimum Grades. Educational Leadership, 82(2). Treats 50 percent floors as a “Band-Aid approach” to the arithmetic of the percentage scale, notes that a teacher using one still distinguishes 51 levels of failing, and records districts amending or rescinding such policies and Texas legislating against them. Cites the four-to-seven-level reliability research. ascd.org
- Brimi, H. M. (2011). Reliability of Grading High School Work in English. Practical Assessment, Research & Evaluation, 16(17). Ninety high school English teachers, all trained in a writing-assessment framework, graded one identical student paper; the 73 who used a 100-point scale produced scores from 50 to 96. Cited from the ERIC record, which was read; the hosting journal’s full text was unreachable from this session. One paper, one district. eric.ed.gov
- Lozano, L. M., García-Cueto, E., & Muñiz, J. (2008). Effect of the Number of Response Categories on the Reliability and Validity of Rating Scales. Methodology, 4(2), 73–79. Monte Carlo simulation of thirty-item scales, inter-item correlations .2–.9, samples of 50–500, two to nine response options; reliability and validity rise with more categories but the optimum sits between four and seven, with small gains past seven. A psychometric simulation of rating scales in general, not a study of report-card grades, and cited from the published abstract. doi.org/10.1027/1614-2241.4.2.73
- Sanchez, E. I. (2025). The Implications of Grade Inflation: Evaluating the Prediction of First-Year College GPA Using High School GPA and ACT Scores. ACT Research Report R2432. Mean self-reported HSGPA rose from 3.17 (2017 class) to 3.38 (2022) in one southern state with statewide ACT testing; 22,717 and 16,199 students, 160 high schools; school-level inflation estimates ran from about −0.3 to 0.7 and were larger at lower-GPA schools; for two students at a 2.5 HSGPA, 0.5 of school inflation predicted a first-year college GPA 0.37 points lower. One state, a sample the report describes as predominantly White and female, and a window that includes the pandemic. The study does not test grading-scale changes and attributes none of the rise to them. act.org (PDF)
- Starch, D., & Elliott, E. C. (1912). Reliability of the Grading of High-School Work in English. The School Review, 20(7), 442–457; and the 1913 mathematics companion study. Cited as reported by Guskey (2013) — 147 English teachers scoring two identical papers 64–98 and 50–97, and 128 mathematics teachers scoring one geometry paper 28–95. The 1912 article’s bibliographic record was confirmed, but the full text was not read in this session, so the figures are attributed to Guskey’s account of them. archive.org