By Clay Shumate
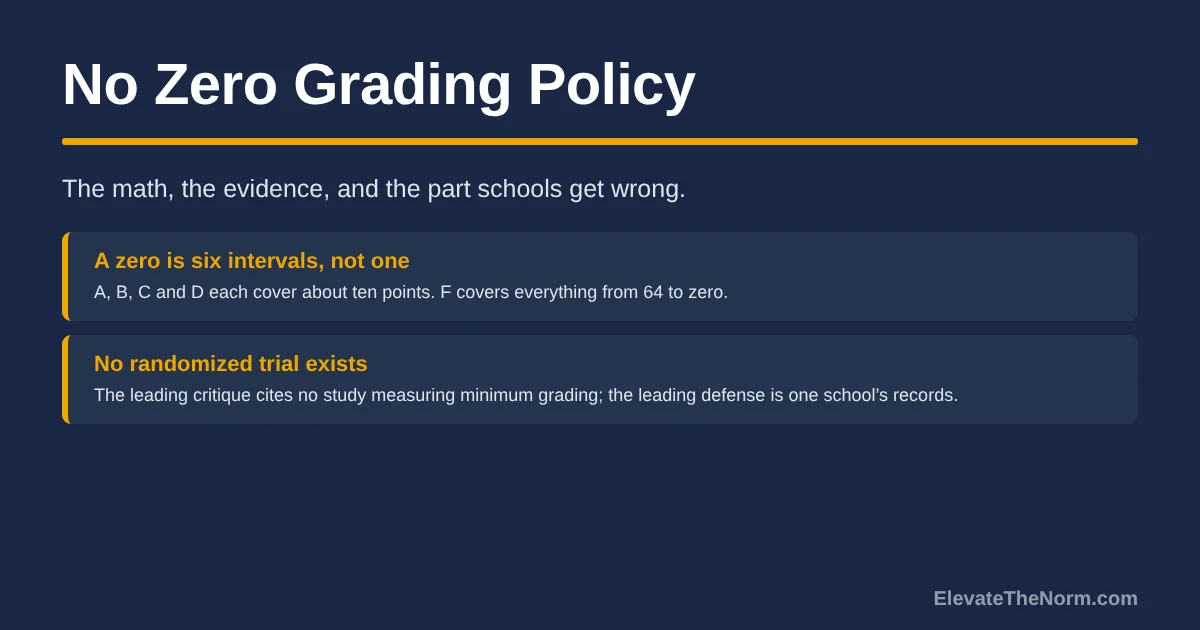
A no zero grading policy replaces a score of zero for missing or failed work with a floor, usually 50 on a 100-point scale. It exists because a zero costs a student roughly six letter-grade intervals while every passing grade costs one. The floor fixes that arithmetic. It does not, on its own, get the work done.
Key Takeaways
- The argument for a grading floor is arithmetic, not sympathy. On a 100-point scale where 65 passes, the failing band is about two-thirds of the scale while each passing letter grade gets roughly ten points, so a single zero carries a penalty no passing grade can match.
- The largest study of minimum grading in practice looked at 343,425 sets of grades given to 10,958 students over seven years in one urban high school with a 50 floor, and found no grade inflation. Only 0.3 percent of grade sets started with a minimum grade and ended in a pass.
- The strongest evidence on the other side is about grading standards, not grading floors. Across 342,098 North Carolina Algebra I students, the strictest-grading quarter of teachers raised same-year test scores by 16.9 percent of a standard deviation over the most lenient quarter.
- Nobody has run a controlled trial of a no zero grading policy. The leading critique of equitable grading concedes it cites no study measuring the effects of minimum grading itself, and the leading defense comes from one school’s retrospective records. Anyone who tells you the question is settled is selling something.
- A floor without a required redo is the version that earns the criticism. The policy that holds up pairs the 50 with a recorded reason, a deadline for the real work, and a grade that still says the student has not shown the learning yet.
Every school argument about zeros collapses into the same two sentences. One side says a zero is the only honest score for work that does not exist. The other says a zero is a punishment dressed up as a measurement. Both sides are partly right, and both sides usually skip the part that decides it, which is what the number does to the average afterward.
So, in order: what the policy is, the arithmetic that started the fight, what the research on both sides actually found, and the five conditions that separate a defensible floor from a free pass.
What is a no zero grading policy?
A no zero grading policy is a grading rule that sets a minimum score for any assignment, so that missing or failed work is entered as that minimum rather than as a zero. On a 100-point scale the floor is almost always 50. The work is still unfinished and the grade is still an F. Only the size of the hole changes.
Three versions get called by the same name, and they are not the same policy. The first is a bare floor: nothing is entered below 50, and that is the end of it. The second is a floor plus a required redo, where the 50 is a placeholder until the student submits the work. The third replaces the number entirely with an incomplete or a not-yet code until the assignment arrives.
When a teacher tells you a no zero policy ruined their class, they almost always mean the first version. When an administrator tells you it transformed their school, they almost always mean the second. The two groups are arguing about different rules.
Why does one zero do so much damage on a 100-point scale?
A zero is the only score on a 100-point scale that can outweigh a semester of work, because the scale is not evenly divided. A, B, C and D each occupy about ten points. F occupies everything from 64 down to nothing. A zero is not one grade worse than a D; it is about six intervals worse.
Carifio and Carey put the point plainly in the Mid-Western Educational Researcher: a disproportionate two-thirds of the 100-point scale represents a failing grade, which concentrates every bit of teacher-to-teacher variation at the bottom end of the scale, where it does the most damage. Their summary of the underlying problem is the best sentence written on the subject: “The core and unavoidable problem is the effects of intermittent catastrophic failures.”
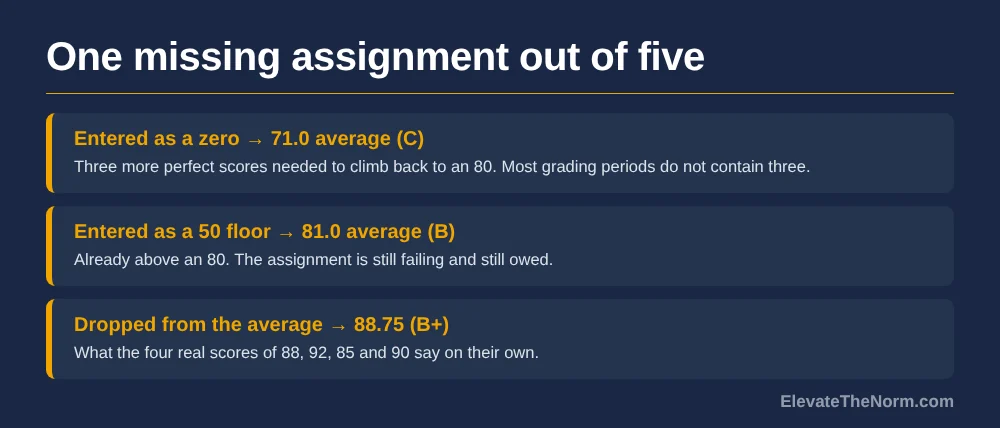
Run the arithmetic on an ordinary grades 6–12 student. Four assignments at 88, 92, 85 and 90 is an average of 88.75, a solid B+. Add one missing fifth assignment and watch what the two choices do.
| Entry for the missing work | New average | Letter | Perfect scores needed to climb back to an 80 |
|---|---|---|---|
| Zero | 71.0 | C | 3 |
| 50 floor | 81.0 | B | 0 — already there |
| Dropped from the average | 88.75 | B+ | 0 |
One missing assignment out of five takes a B+ student to a C, and climbing back to a B takes three more perfect scores that most grading periods do not contain. That is the whole case for the floor, and it is a case about mathematics rather than effort or character. It is also why a four-level scale changes the shape of the problem — though Carifio and Carey note a 0.0–4.0 scale only solves the asymmetry if its minimum is 1.0 rather than zero. The spacing is what matters, not the scale.
What does the research on minimum grading actually show?
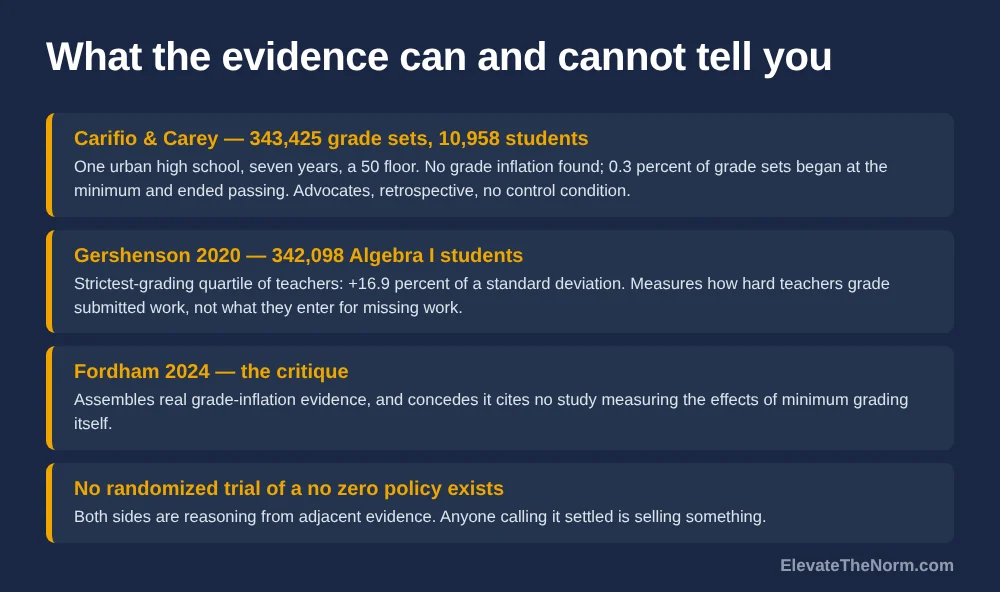
The only large-scale study of a school-wide minimum grade found no grade inflation and almost no social promotion. Carifio and Carey analyzed seven years of grading records from one large urban high school with a 50 floor: 343,425 sets of grades across 10,958 students. They report finding no evidence of grade inflation or social promotion.
The specific numbers matter more than the headline. Only 1,159 grade sets, about 0.3 percent, began with a minimum grade and ended with a passing grade, which is the exact outcome critics predict and it barely happened. 925 students, 8.4 percent of the school, passed at least one course after receiving a minimum grade somewhere along the way, roughly 142 students a year. The authors also report that after adjusting for GPA, students who received minimum grades outperformed peers who never received one on Massachusetts state exams.
Now the honest caveats, because this is the study everybody quotes and nobody qualifies. Carifio and Carey are advocates for minimum grading, and the article I read is their own point-counterpoint defense of it. It is one school, retrospective records, and no control condition. The design can tell you what happened in a building that adopted the floor. It cannot tell you that the floor caused it.
What does the evidence against lenient grading show?
The strongest evidence against lenient grading is about how hard teachers grade, not about whether zeros are allowed. Seth Gershenson tracked 342,098 eighth and ninth grade Algebra I students across about 8,000 North Carolina teachers over ten years and found that students of the strictest-grading quarter of teachers scored 16.9 percent of a standard deviation higher on the end-of-course exam than students of the most lenient quarter.
The effect carried forward. Those students scored 7.3 percent of a standard deviation higher in Geometry a year later and 8.6 percent higher in Algebra II two years later. It held across subgroups at roughly the same size: 8.2 percent for Black students, 10.3 percent for white students, 10.4 percent for Hispanic students, with the subgroup differences not statistically significant. The effect was slightly larger in less-affluent schools than in more-affluent ones.
That is a serious result and I am not going to soften it. But read what the study says about its own reach. Gershenson states that “the mechanism that leads from higher standards to higher performance is not clear,” and the report does not study no-zero or grade-floor policies at all. Its only mention of them sits in the implications section as a policy argument, not a tested finding. Grading harder on the work students do hand in is a different variable from what you enter when they hand in nothing.
The fullest critique of the wider equitable-grading movement comes from Meredith Coffey and Adam Tyner at the Thomas B. Fordham Institute, and it is worth reading because it is specific. They assemble real evidence that grades have drifted from achievement: an average ACT-tested GPA of 3.4 in 2021, the highest on record, against composite scores at their lowest since 2010, and TNTP’s finding that students earned the same grade or better in 2022 as in 2019 despite losing about five months of learning. They also cite Figlio and Lucas on stricter-grading teachers producing greater test-score growth, and Babcock’s finding that college students expecting a C studied about 50 percent more than those expecting an A.
And then they concede the thing the headlines left out. The brief cites no study measuring the effects of minimum grading itself, acknowledges that “it is difficult to quantify the impact of these specific grading reforms on national grading standards,” and allows that “some grading reforms may benefit students.” Its strongest line against the reforms, that there is “not an iota of hard evidence” they help long term, is a claim about missing evidence rather than a finding of harm.
So the state of the field is this. Nobody has randomized a no zero grading policy. One side has a large retrospective study from an advocate. The other side has strong evidence about a related but different variable and an openly stated absence of evidence about this one. That is not a tie, and it is not a victory. It means the decision has to be made on design and on values, with the evidence informing it rather than deciding it.
Does a no zero grading policy mean students stop being accountable?
A floor removes one consequence, and if nothing replaces it, accountability does drop. That is the legitimate complaint and it should not be waved away. Teachers at Leominster Public Schools in Massachusetts concluded that “kids just weren’t learning to be responsible” and the district rescinded its policy, and one teacher in the same reporting described students who could “take half of a year off and still pass.”
Notice what those complaints are about. Not the number 50 — the missing second half of the policy. A 50 that requires nothing is a gift; a 50 that holds a slot open until the work arrives is a deadline with a different shape. There is also a real argument that a zero was never much of a consequence to begin with. Sarah Duncan of the University of Chicago’s Network for College Success noted in the same reporting that students who get an F tend to withdraw, because “they interpret an F as ‘You do not belong in this environment.’” A consequence that makes a student quit is working as an exit, not a consequence.


What should a no zero grading policy actually require?
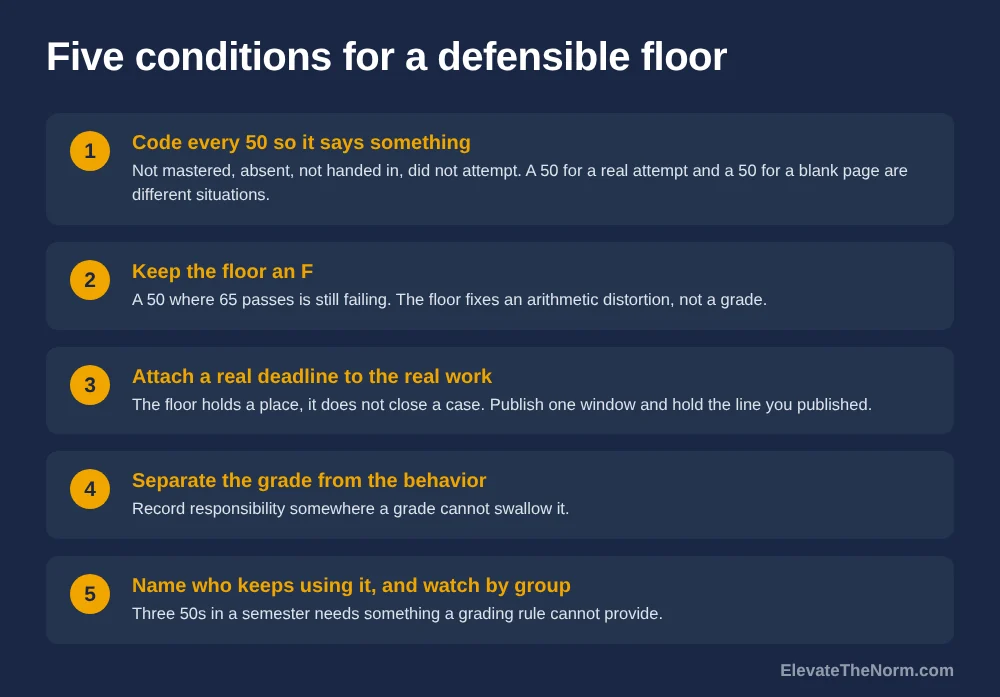
Five conditions separate a defensible floor from a free pass, and all five are about what happens after the 50 goes in the book. A policy with the floor and none of the rest is the version that gets rescinded two years later.
- Code every 50 so it says something. A 50 with no explanation tells a student and a parent nothing. Gradebook codes do the work: not mastered, absent, not handed in, did not attempt. One teacher in the Edutopia reporting uses exactly those four so families can see which problem they are looking at. A 50 for a genuine attempt and a 50 for a blank page are different situations wearing the same number.
- Keep the floor an F. A 50 on a scale where 65 passes is still failing. If the policy is being sold as protecting students from failure, it is being sold wrong. It protects them from a specific arithmetic distortion, which is a smaller and more defensible claim.
- Attach a real deadline to the real work. The floor should hold a place, not close a case. Publish one window, say what happens at the end of it, and hold the line you published. The deadline question deserves its own policy, and the two rules have to agree with each other or students will find the gap in about a week.
- Separate the grade from the behavior. If the concern is responsibility, record responsibility somewhere a grade cannot swallow it. Mixing a measure of learning with a measure of compliance produces a number that answers neither question, which is the same problem standards-based grading is built to solve.
- Name who keeps using it, and watch the pattern by group. Track which students take the floor repeatedly. Three 50s in a semester is a student who needs something other than a grading rule, and the floor is doing its job only if it buys time for somebody to notice. Run the same count by student group, because a floor applied far more often to one group is either catching a real inequity or hiding one, and you cannot tell which without looking.
One thing a grading floor genuinely costs you, and the reason the reason codes in condition one are not optional: a 50 is not a measurement. It is a placeholder entered where no evidence exists. A gradebook with nine real scores and one 50 still tells you what the student can do. A gradebook with four real scores and six 50s has stopped being a record of learning, and no amount of averaging will tell you which standard the student missed. That is the strongest objection to the policy and it has nothing to do with accountability. It is why the incomplete or not-yet version is cleaner on the measurement question, and why a floor without reason codes destroys information a teacher needs.
And one logistical fact that decides whether any of this survives contact with a building: most gradebooks cannot enforce a floor automatically. If the rule depends on every teacher remembering to type 50 instead of 0, the policy will be applied unevenly within the same hallway by November. Check what the software can actually do before the policy is announced, not after.
How do you explain a no zero grading policy to a parent who thinks it is soft?
Lead with the arithmetic and never with the compassion. A parent who hears “we did not want him to feel bad” has every reason to object. A parent who hears “one missing assignment was costing him three perfect scores to recover from, and he is still failing that assignment” is being told something checkable.
Then say the part most schools skip. The 50 is not the grade for the work; it is the grade for the absence of the work, and it is still an F. The assignment is still due. If the policy does not include that second sentence, the parent is right to push, and the way the message is written decides how the conversation goes more than the policy does.
The harder parent to answer is the one whose child does every assignment on time. That parent is not asking about arithmetic; they are asking why the gap between their child and a classmate who turned in nothing just got smaller. The honest answer is that it did, by ten points on one assignment, and that their child’s grade is unchanged while the classmate is still failing that assignment and still owes the work. If the policy has no redo requirement, there is no good answer to give that parent, which is another reason the second half of the rule is not optional.
What does this look like from the student’s side?
Students read a grading floor as information about whether recovery is possible. That is the honest reason it changes behavior when it changes behavior at all. A student at 71 with three assignments left can do the math and see a path; a student who did the same math and found no path has already decided what the rest of the semester is worth. They also read it as information about whether the adults are consistent, and a floor announced in August and quietly ignored in October is worse than no floor at all.
And the students who do all the work have a fairness complaint of their own, which deserves a straight answer rather than a lecture about empathy. They notice when a classmate gets fifty points for a blank page. The answer is that the classmate is still failing that assignment, still owes it, and gets no credit until it arrives — and that the student asking is owed the same consistency everyone else is getting. A policy you cannot defend to a sixteen-year-old who did the work is not ready.
What should a school decide before mandating this?
A district adopting a floor is making three decisions at once, and most adopt the first and skip the other two. The number, what it obligates the student to do next, and what it obligates the school to do next — which is where the staffing and the money live.
Carifio and Carey estimate the school they studied saved roughly $1 million over seven years in avoided course repeats, summer school and credit recovery. Treat that figure carefully: it is one school, it is the authors’ own estimate, and savings assume the students who passed had actually learned enough to move on. But it does mean the cost conversation runs in both directions, which is not how the policy usually gets presented to a board.
Two decisions usually get made by default instead of on purpose. The first is whether teachers keep any discretion. A mandate that strips judgment from every teacher in the building will be worked around, and a rule everyone quietly works around is worse than either option honestly chosen. The second is who chases the redo. The required-work half of the policy is real labor — tracking, reminding, re-collecting, re-grading — and if the answer is “the classroom teacher, on top of everything else,” say so out loud when the policy is announced rather than letting people discover it in week three.
One compliance item to check before adopting, not after: how the floor interacts with transcripts, GPA calculation and anything your state reports. A grading rule that changes course averages changes the number colleges see, and a district that cannot explain the relationship between its floor and its transcripts has created a problem for its own counselors.
Clay’s take
My position starts somewhere slightly different than the research. If a student can fail that badly in my room, the first question is what the planning looked like, and the second is what I was doing for the three weeks it took to get there. A zero that accumulated quietly over a grading period is usually a record of adult inattention as much as student choice.
So the floor is not the interesting part of this policy. The redo requirement is, and a school that adopts the 50 without it has bought the criticism and none of the benefit. Give a teenager a path back and most of them take it; give them arithmetic saying the semester is already over and some of them believe you. And the honest answer to “what does the research say” is that the research has not been done — which teachers deserve to hear instead of a confident number from whichever side asked first.
What to do next
Pull your own gradebook and find one student whose average is held down by a single zero. Run the arithmetic above on that student and see how many perfect scores recovery would take. If the answer is more assignments than the grading period contains, you have found the problem the floor is built for.
Then decide the second half before you decide the number. What does the student owe, by when, and what happens when the work arrives? If you cannot answer those three questions, the floor is not ready to adopt. Next, read the late work policy that has to agree with it and the objections to standards-based grading taken seriously, because every real version of this fight ends up in one of those two places. Everything on this site is free and nothing asks for your email address.
Frequently Asked Questions
What is a no zero grading policy?
A no zero grading policy sets a minimum score for any assignment, usually 50 on a 100-point scale, so missing or failed work is entered as that minimum instead of a zero. The grade is still an F and the assignment is still owed. The rule changes only how far a single missing assignment can drag an average down.
Does a no zero grading policy cause grade inflation?
The largest study available says no. Carifio and Carey examined 343,425 sets of grades for 10,958 students across seven years in one urban high school with a 50 floor and reported no evidence of grade inflation or social promotion, with only 0.3 percent of grade sets starting at the minimum and ending in a pass. It is one school, retrospective, and written by advocates.
Why is a zero considered mathematically unfair?
Because the 100-point scale is not evenly spaced. A, B, C and D each cover about ten points while F covers everything from 64 to zero. That makes a zero roughly six letter-grade intervals below a D rather than one, so a single zero can outweigh several strong scores in a way no passing grade ever can.
Is there research proving no zero policies help students?
No. There is no randomized trial of a no zero grading policy. The Fordham Institute’s critique of equitable grading concedes it cites no study measuring the effects of minimum grading itself, and the main study in favor is retrospective records from a single school. Both sides are reasoning from adjacent evidence.
Does strict grading produce better results than a grading floor?
Strict grading standards do have strong evidence behind them, but on a different question. Gershenson found that across 342,098 North Carolina Algebra I students, the strictest-grading quarter of teachers raised end-of-course scores by 16.9 percent of a standard deviation. That study measures how hard teachers grade submitted work, not what they enter for missing work.
What should replace a zero if you do not use a 50?
An incomplete or not-yet code with a required submission date is the cleanest alternative, because it withholds a number rather than inventing one. Some teachers record the true score on the paper and a 50 in the gradebook with a reason code attached. The common requirement in every workable version is that the real work is still owed.
How many 50s should one student be allowed?
Set a count and watch it rather than leaving it open. A student taking the floor three times in a semester needs something a grading rule cannot provide, and the point of the floor is to buy time for an adult to notice. A policy with no counting mechanism cannot tell the difference between a bad week and a pattern.
Sources
- Carifio, J., & Carey, T. (2013). The arguments and data in favor of minimum grading. Mid-Western Educational Researcher, 25(4), 19–30. Seven years of grading data from one large urban high school with a 50 minimum: 343,425 sets of grades, 10,958 students; 0.3 percent of grade sets began at the minimum and ended passing; 925 students (8.4 percent) passed at least one course after a minimum grade; estimated savings of roughly $1 million over seven years. The authors advocate for minimum grading, the design is retrospective with no control condition, and it is a single school. Reports the figures of their own 2012 Educational Researcher study, 41(6), 201–208.
- Gershenson, S. (2020). Great Expectations: The Impact of Rigorous Grading Practices on Student Achievement. Thomas B. Fordham Institute. 342,098 eighth and ninth grade Algebra I students, about 8,000 teachers, North Carolina, 2006–2016. Top grading-standards quartile versus the lowest: +16.9 percent of a standard deviation same-year, +7.3 percent in Geometry, +8.6 percent in Algebra II. Subgroup effects 8.2–10.4 percent, differences not significant. No effect on graduation. The study does not examine no-zero or grade-floor policies; its mention of them is a policy argument in the implications section. Author states the mechanism is unclear.
- Coffey, M., & Tyner, A. (2024). Think Again: Does “equitable” grading benefit students? Thomas B. Fordham Institute. Assembles the grade-inflation evidence (ACT 2023: average GPA 3.4 against composite scores at a post-2010 low; TNTP False Signals; CALDER and Brookings grade-versus-test gaps) and cites Figlio and Lucas (2004), Gershenson (2020) and Babcock (2010) for stricter standards. Concedes it cites no study measuring the effects of minimum grading itself, that quantifying the reforms’ impact is difficult, and that “some grading reforms may benefit students.”
- Minero, E. (2018). Do no-zero policies help or hurt students? Edutopia. Cited as practitioner reporting, not a study. Source of the Leominster Public Schools rescission, the gradebook reason-code practice, and Sarah Duncan’s observation that students read an F as not belonging. Describes the 50-percent floor as implemented in districts including Fairfax County and Philadelphia.
- Minimum grade / grading scale (book excerpt, “Equitable Grading Practices,” p. 84). Corwin. Read as an excerpt; the excerpt does not name its author and ends mid-argument. Sets out the two alternatives — raise the minimum or change the scale — and carries Guskey’s (2004) explanation that secondary teachers keep the zero partly so students feel a consequence. Also cites Reeves (2004).
- Arithmetic in the table and the recovery counts is my own calculation from the four stated scores, not a finding from any source above.