By Clay Shumate
Progress monitoring is the repeated use of a short, standardized measure with a student already receiving an intervention, graphed against a goal, so you can see whether that intervention is working before the semester ends. It answers a different question from a daily check for understanding, and at secondary level the evidence is thinner than the paperwork suggests.
Key Takeaways
- Progress monitoring is not formative assessment. A check for understanding tells you whether today landed. A progress-monitoring probe is a standardized measure given on a schedule to a student in an intervention, and its job is to tell you whether the intervention is working at all.
- The effects are real but modest, and they are not secondary findings. A meta-analysis of data-based decision making in reading interventions found g = 0.24, with a confidence interval of 0.01 to 0.46 across 15 studies of struggling readers in grades K–12. The lower bound almost touches zero.
- Nobody agrees how much data is enough. Published guidance runs from six data points to twenty, and the national center that writes the standards says plainly that the number needed before a decision “is unclear.”
- The one measure that fits a secondary caseload is the one with the weakest case. A review of 14 studies and 5,839 students in grades 6–12 concluded that maze reliability is “often below acceptable levels” for exactly the progress decisions teachers want to make.
- The graph is a trigger, not a diagnosis. Curriculum-based measurement tells you when instruction needs to change and is much less useful for telling you what to change. That second question still needs a diagnostic look at the work.
What is progress monitoring?
Progress monitoring is the repeated measurement of a student’s performance over time, using a valid and reliable measure with a standardized administration, to see whether that student is responding to an intervention. The measure stays the same difficulty every time so the scores can be compared.
That last sentence is the whole mechanism. If Tuesday’s task is easier than last Tuesday’s, a rising line means nothing. The measures built for this — the curriculum-based measurement family — are deliberately short, boring and interchangeable. You are not finding out what the student learned this week. You are getting a number that can sit next to twelve other numbers on one axis.
The practitioner manuals describe it as a system of ongoing data collection on an academic skill, with measures given anywhere from twice a week to once a month. The reading probes are one minute long. A maze passage, where students pick the right word from three choices as they read, runs two and a half minutes in the elementary manual that specifies it.
One more boundary, and it matters more than any of the technical detail. Progress monitoring is for students who are already receiving an intervention. If every student in your room is taking the probe every week, you are not progress monitoring. You are testing.
How is progress monitoring different from formative assessment and screening?
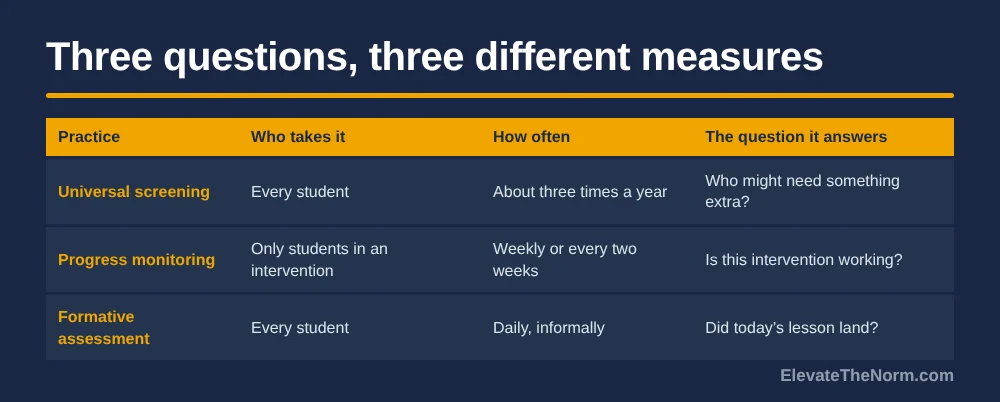
Three practices, three different questions. A universal screener asks which students might need help. A progress-monitoring probe asks whether an intervention is working for one student. A check for understanding asks whether today’s lesson landed. Only the middle one needs a standardized measure on a fixed schedule.
| Practice | Who takes it | How often | The question it answers |
|---|---|---|---|
| Universal screening | Every student | About three times a year | Who might need something extra? |
| Progress monitoring | Only students in an intervention | Weekly or every two weeks | Is this intervention working for this student? |
| Formative assessment | Every student | Daily, informally | Did today’s lesson land? |
| Benchmark or unit test | Every student | Each unit, quarter or semester | What has been learned so far? |
The people who build these systems draw the line at standardization: ordinary classroom monitoring means informal check-ins, while progress monitoring means a measure with established reliability and validity given the same way every time. Both are useful, they are not substitutes, and a school that runs one while reporting the other is fooling itself.
If what you actually want is the daily version, that is a different article: the formative and summative labels do less work than people think, and writing checks that fit inside one period will serve you better than a probe will. Progress monitoring earns its cost only when a student is in an intervention and somebody has to decide whether to keep going.
Does progress monitoring actually improve achievement?
Modestly, in reading, mostly in elementary samples, and only as part of a decision process. The strongest synthesis for struggling readers reports g = 0.24 with a confidence interval of 0.01 to 0.46, and its authors say experimental studies are needed before data-based decision making can be called an evidence-based practice.
That synthesis covered 15 studies of struggling readers in grades K–12. In the six studies that compared the same intervention with and without a data-based decision process, the effect was g = 0.27, confidence interval 0.07 to 0.47. Those two numbers are the honest answer to the question, and they are smaller than the enthusiasm around progress monitoring would lead you to expect.
A second meta-analysis, summarized in the Council for Exceptional Children’s practice alert on data-based individualization, puts data-based individualization against business as usual at g = 0.37 across 14 studies, and at g = 0.38 in six studies that added other data sources. Effects did not differ across reading, math and spelling. Larger effects showed up where teachers built their own measures and where they got more frequent support, such as consultation. That last detail is the best argument going for keeping an instructional coach in the loop: the part of this that moves results is the conversation about what to do next, not the collecting.
Now the caveats, because they are load-bearing. That same alert rates data-based individualization “Use Caution,” since few experimental studies test the whole process. Of the 15 studies in the reading synthesis, only three used standardized progress-monitoring measures, and most interventions were code-focused work on word reading and fluency — a beginning-reader profile, not a tenth grader’s. Neither meta-analysis says much about what teachers actually changed, so the literature cannot separate the measuring from the teaching.
And the broadest federal guidance on using student data to drive instruction rates all five of its recommendations at a low level of evidence, with the panel stating that it cannot point to rigorous research proving the practices improve achievement. That guide covers interim and benchmark data rather than curriculum-based measurement, so it is not a verdict on probes — but it is a fair picture of how unsettled this field is.
How often should you progress monitor?
The national standard is at least every two weeks for a tier 2 intervention and at least weekly for tier 3. High-school guidance repeats the same two numbers. Older practitioner manuals allow monthly for general-education students and recommend twice weekly for students with disabilities or significant risk.
This is the one number nobody fights about, which is worth noticing: the frequency guidance is stable across the national center, the state networks and the manuals. Everything downstream of it — how many points you need, what slope counts as good, which measure to use at grade 10 — is contested.
Pick the frequency from the intensity of the support, not from how worried you are. A student in a thirty-minute daily reading intervention is a weekly case. A student who got moved to the front and given a graphic organizer has not been given an intervention in this sense at all, and monitoring them fortnightly will produce a noisy line and a false sense of rigor.
How many data points do you need before you change an intervention?
More than most schools collect, and there is no single answer. Published guidance runs from six data points to twenty, and the national center’s own practice alert says the number needed “is unclear.” A federal research summary notes that most decision-making practices in this area rest on expert opinion.
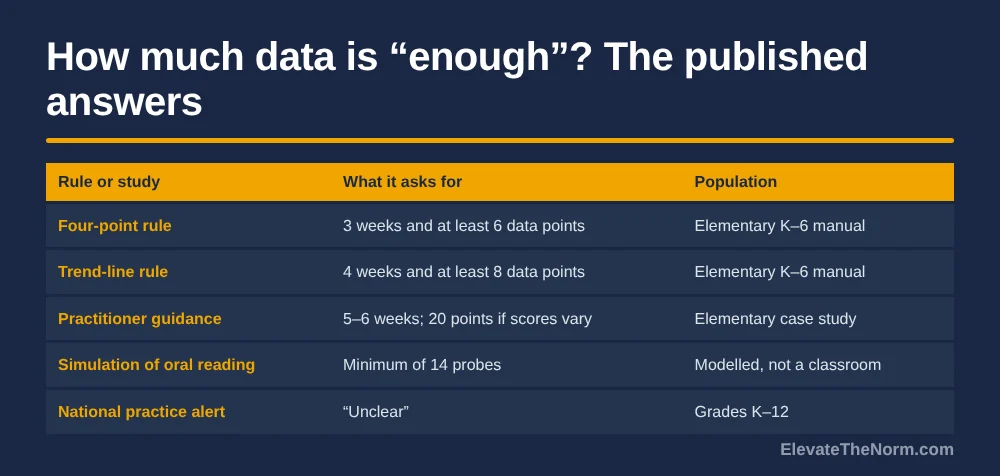
Here is the spread, and I think seeing it side by side is more useful than being handed one rule. The four-point rule asks for at least three weeks of instruction and at least six data points before you act on the last four. The trend-line rule asks for at least four weeks and at least eight points. A widely used practitioner article says instructional decisions are possible with five to six weeks of data, then notes that some researchers want at least twenty total points for students whose performance bounces around. A simulation study of oral reading fluency found that a trustworthy growth estimate needed a minimum of fourteen probes, ordinary least-squares regression, and a very clean dataset.
Those are not small differences. Six points at one a week is a month and a half; twenty points is most of a semester. And the simulation’s fourteen is not a classroom finding — it is a modelled result for one reading measure under synthetic error conditions.
One other finding is worth carrying around: a dissertation on the accuracy of these interpretations concluded that educators improve their odds of a correct decision by looking at the graph rather than only the rule, and by collecting data for longer than six weeks. The honest practical answer for a secondary teacher is that a slope-based decision wants most of a grading period, and anything faster is a judgment call wearing a number.
There is a reason this bothers me. A student who sits in a failing intervention for ten weeks because the rule said wait has lost ten weeks. A student pulled out of a working one after three noisy points has lost the thing that was working. The published rules cannot tell you which error you are making. Look at the work, not only the line.
What can you actually measure in grades 6–12?
Less than the elementary catalog offers. Reading at secondary usually means a maze passage, writing means a timed sample scored for correct word sequences, and math means an algebra-specific measure. The best review of maze at these grades concluded its reliability is often below acceptable levels for progress-monitoring decisions.
That review, a University of Maryland dissertation, covered 14 studies and 5,839 students in grades 6 through 12. Maze predicted later reading ability reasonably well — six studies ranged from 0.44 to 0.81, median 0.62 — and correlated with other reading measures at a median of 0.63 across nine studies. Alternate-form reliability looked decent at 0.79 to 0.96, median 0.86, but that figure comes from a single grade 8 sample. The author’s conclusion was that maze shows promise as a screening tool for secondary students and has much less support for progress-monitoring decisions, and that only two studies had examined its technical adequacy with high schoolers at all.
Math is thinner still. A paper on curriculum-based measurement for secondary mathematics opens by noting that only one study existed on using it in secondary-level math courses. The field has moved since, but nothing I could open replaces that with a strong secondary base.
What districts actually do at high school is instructive. A state network conversation starter on high-school progress monitoring lists grades, attendance, daily behavior ratings, unit assessments and student contracts alongside the academic probes. For tier 3 reading it points at a maze passage pitched to eighth-grade national norms. For writing it suggests five-minute samples scored by correct minus incorrect word sequences. For math it names an algebra assessment project and a commercial product.
Notice the ceiling problem in that list. Monitoring a sixteen-year-old on eighth-grade material is defensible when that is genuinely where the skill sits, and it is also how a student ends up with a beautiful upward line and no change in what they can read in your class. If you are monitoring a content-area skill rather than a basic one, you are off the end of the evidence — say so, and treat the number as local rather than validated.
How do you run progress monitoring with 150 students?
You do not run it on 150 students. You run it on the handful who are in an intervention, with a group-administrable measure, on a fixed day, with a goal set before the first probe. Six steps, and the first one is the only one that saves you.
- Name the list. Write down exactly which students are in an intervention and what the intervention is. If you cannot name the intervention in one sentence, there is nothing to monitor yet.
- Pick one measure and keep it. Same type, same length, same difficulty, every time. Switching measures mid-stream destroys the comparison you are collecting.
- Take three baseline points before you set the goal. The practitioner guidance is three, and the median of three is a far better starting point than one score on a bad day.
- Write the goal and the decision date on the graph, with the student looking at it. Decide in advance what you will do if the line stays flat, and when you will look. A rule written afterward is not a rule.
- Probe on a schedule, not when you remember. Weekly for tier 3, every two weeks for tier 2. Same day, same slot, scored on the spot — the last five minutes of a Friday works as well as anything, and a stack of unscored probes is the same as no data.
- When the line says change something, look at the work to decide what. The graph tells you the intervention is not working. It cannot tell you why, and that gap is where the actual teaching decision lives.
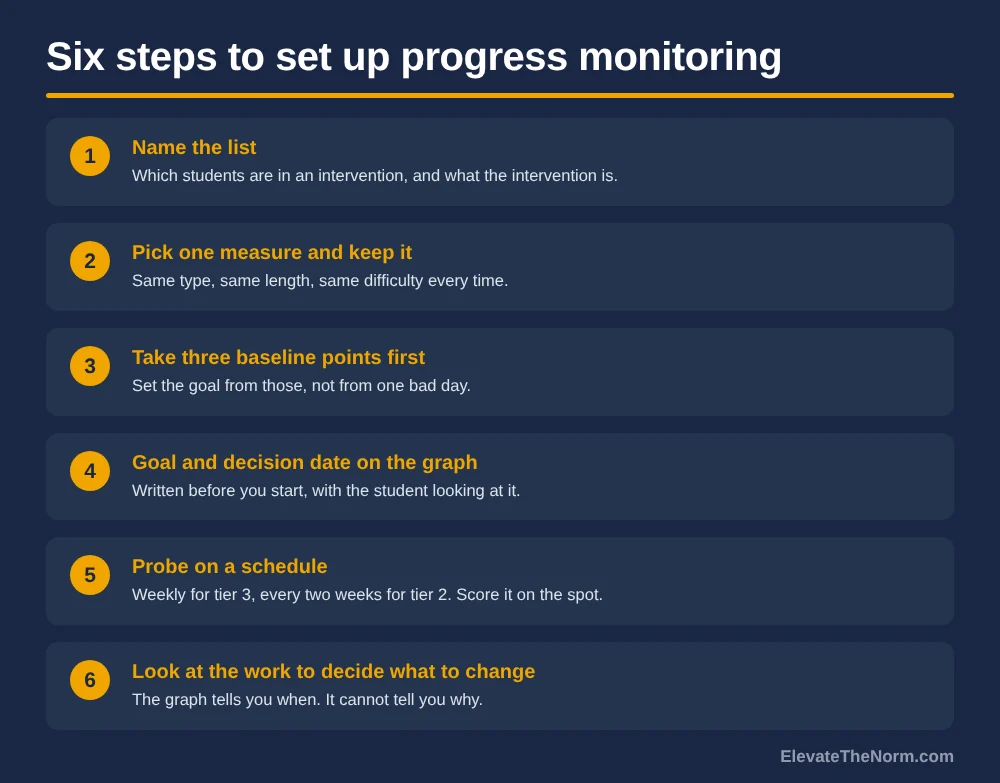
Step four is the one schools skip, and I would argue hardest for it. A teenager pulled for the same short timed task every Friday, on work deliberately easier than the class, who never sees what it is for, is being measured rather than taught. Show them the graph, the goal line and the date you will look. Say out loud that the task stays the same difficulty on purpose, because the point is comparison and not challenge. A student who knows the decision date can have an opinion about the decision. And the graph is theirs and yours, not a chart on the wall with names on it.
Families need the same honesty in a different register. If you are monitoring on eighth-grade material, a rising line means that skill is improving — not that the class work is fixed, and saying so early prevents a hard conversation in the spring. Two more fairness points: a probe score is not a grade and should never reach the gradebook, and where a student has a special-education goal written in progress-monitoring language, the limits in this article belong in that team’s conversation rather than hidden from it.
On the arithmetic, which is mine rather than anybody’s research: a one-minute individual reading probe is fine for four students and impossible for forty, while a maze is a written task a whole group takes at once. That is why the secondary options collapse toward maze and timed writing samples — and it is the uncomfortable part, because that is the measure whose reliability the best secondary review questions.
Two practical notes. Scoring is quick; building the materials is not — maze construction guidance asks for passages of at least 200 words and at least eighteen of them for a school year, with distractors that cannot make contextual sense and cannot rhyme. And a student who cannot start the work is a different problem from one who cannot do it: if the intervention is about getting going at all, the strategies for students who cannot get started beat a probe.


What does progress monitoring cost, and is anything free?
Some of it is genuinely free, with a grade ceiling you need to know about. easyCBM offers a free tier for an individual teacher covering up to 200 students, including progress-monitoring assessments and individual progress graphs. Its reading forms stop at grade 8.
That ceiling is the whole story for a high-school teacher. On the vendor’s own pricing page, the free tier lists six reading forms for grades 6 and 7 and three for grade 8, with a K–8 math set; the paid tier runs $69.99 for a year and adds benchmark assessments and reporting. There is nothing in the free tier for grades 9 through 12, which is one more reason high schools end up monitoring on eighth-grade material.
For choosing a tool, the national center publishes a review chart whose committee rates each submitted tool against published criteria without comparing tools to each other. That distinction matters: it is a registry of what vendors submitted and how it scored, not a ranking and not an endorsement. Read it as a consumer guide, which is exactly how its authors describe it.
If this is a district decision rather than a classroom one, the cost is not the licence. It is the measure, the training, and somebody’s time to give and score probes on a schedule across a building. A mandate that funds the spreadsheet and none of those three produces compliance data — the version of this practice the research does not support.
Is progress monitoring worth it in grades 6–12? Clay’s take
It is worth it for students who are genuinely in an intervention, and worth almost nothing as a compliance exercise. The measuring only pays when somebody acts on it, and the secondary tools are weaker than the forms imply. Both facts should change how you use it.
What convinced me is the structural finding rather than any effect size: curriculum-based measurement is good at telling you when to change instruction and much less useful for telling you what to change. The graph is a smoke alarm, not a diagnosis, and a school that treats a flat line as a finished analysis has bought the alarm and thrown away the extinguisher.
The honest secondary picture is three things at once. The frequency standards are stable and sensible. The decision rules largely rest on expert opinion, by the admission of the federal summary of that research. And the measure most of us can give to a whole class has reliability its own best review calls often below acceptable levels for this purpose. You can run a defensible system inside those limits, but not one that pretends they are not there.
So my line is this: monitor few students, monitor them properly, write the decision rule before you start, and keep looking at their work. A short list you take seriously beats a spreadsheet nobody reads, and it beats a graph you were always going to interpret in the direction you already wanted.
What should you do next?
Make the list. Write down every student in your classes who is receiving an intervention right now, and what it is. Most teachers find the list is shorter than they expected and that one or two entries are not really interventions. That is the useful part.
Then pick one student from it and set the graph up properly: one measure, three baseline points, a written goal, a decision date, and a note of what you will change if the line stays flat. Run it for a grading period before judging the method. For the harder question of whether the task itself is pitched right, start with how hard the thinking in a task actually is.
Frequently Asked Questions
What is progress monitoring in simple terms?
It is giving a student the same kind of short, standardized measure over and over on a schedule, plotting the scores against a goal, and using the line to decide whether the intervention they are receiving is working. The measure never gets easier or harder, which is what makes the scores comparable. It is only used with students who are already getting extra support.
Is progress monitoring the same as formative assessment?
No. Formative assessment is the informal, unstandardized checking you do daily to find out whether a lesson landed. Progress monitoring uses a measure with established reliability and validity, administered the same way each time, to judge a student’s response to an intervention over weeks. Both are worth doing. Reporting one as the other is how schools end up with paperwork instead of information.
How often should you progress monitor a student?
The national standard is at least once every two weeks for a tier 2 intervention and at least once a week for tier 3, and state high-school guidance repeats those figures. Older practitioner manuals allow monthly monitoring for general-education students and recommend twice weekly for students with disabilities or significant risk. Match the frequency to the intensity of the support.
How many data points do you need before changing an intervention?
There is no agreed number. The four-point rule asks for six points and three weeks, the trend-line rule for eight points and four weeks, one widely used article suggests twenty points for students whose scores bounce around, and a simulation of oral reading fluency found fourteen probes were the minimum for a trustworthy growth estimate. The national center says the number is unclear.
Does progress monitoring work in high school?
The evidence is much thinner than at elementary level. A review of 14 studies and 5,839 students in grades 6 to 12 found maze works reasonably as a screening measure but concluded its reliability is often below acceptable levels for progress-monitoring decisions, and that only two studies had examined high schoolers specifically. Secondary mathematics has even less behind it.
What can you use for progress monitoring in a content-area class?
Nothing validated. State high-school guidance suggests maze passages for reading, five-minute writing samples scored for correct word sequences, algebra-specific measures for math, and non-academic indicators such as grades, attendance and daily behavior ratings. Vocabulary-matching probes get named as an option for content areas. Treat anything you build for a history or science skill as a local measure, not a validated one.
Is there a free progress monitoring tool?
easyCBM has a free tier for an individual teacher covering up to 200 students, with progress-monitoring assessments, item-level reports and individual progress graphs. Its reading forms stop at grade 8, with six forms for grades 6 and 7 and three for grade 8, so there is nothing in the free tier for grades 9 to 12. The paid tier is $69.99 for a year.
Does progress monitoring raise achievement on its own?
No, and nobody has shown that it does. The research is about what teachers do with the data: a synthesis of data-based decision making in reading interventions reports g = 0.24 with a confidence interval of 0.01 to 0.46, and its authors say experimental studies are still needed. The national practice alert rates the full process Use Caution.
Sources
- Filderman, M. J., Toste, J. R., Didion, L. A., Peng, P., & Clemens, N. H. Data-Based Decision Making in Reading Interventions: A Synthesis and Meta-Analysis of the Effects for Struggling Readers. The Journal of Special Education, 52(3). Repository record with full abstract. Source of g = 0.24 (CI 0.01 to 0.46) across 15 studies of struggling readers in grades K–12, the six-study subset at g = 0.27 (CI 0.07 to 0.47), and the authors’ statement that experimental studies are needed. The article itself was not reachable; the abstract was read in full on this record.
- Toste, J., Filderman, M., & Clemens, N. Data-Based Individualization. Current Practice Alert 30, Division for Learning Disabilities and Division for Research, Council for Exceptional Children. Practice alert (PDF). Source of the Jung and colleagues figures (g = 0.37 across 14 studies; g = 0.38 across six), the “Use Caution” rating, the statement that the number of data points needed is unclear, and the note that only three of the 15 reading studies used standardized progress-monitoring measures.
- Filderman, M. J., & Toste, J. R. Decisions, Decisions, Decisions: Using Data to Make Instructional Decisions for Struggling Readers. TEACHING Exceptional Children, 50(3). Full article (PDF). Source of the three baseline points, the five-to-six-week minimum, the twenty-point suggestion for variable performers, the statement that research varies in these recommendations, and the finding that curriculum-based measurement shows when instruction needs to change but is less useful for deciding what to change. Population: a case study of a fifth grader reading at a second-grade instructional level.
- Stecker, P. M., & Lembke, E. S. Advanced Applications of CBM in Reading (K–6): Instructional Decision-Making Strategies Manual. ERIC ED519250. Manual (PDF). Source of the one-minute reading probe, the two-and-a-half-minute maze, the four-point and trend-line rules, and the monitoring-frequency ranges. Population: an elementary manual, K–6.
- Christ, T. J., Zopluoglu, C., Long, J. D., & Monaghen, B. D. Curriculum-Based Measurement of Oral Reading: Quality of Progress Monitoring Outcomes. Exceptional Children, 78(3). Repository record with abstract. Source of the minimum of fourteen probes for a trustworthy growth estimate. This is a simulation of oral reading fluency across modelled durations of 6 to 20 weeks, not a classroom sample, and the abstract rather than the article was read.
- Van Norman, E. R. An Evaluation of the Accuracy of Time Series Interpretations of CBM-R Progress Monitoring Data. University of Minnesota. Repository record with abstract. Source of the finding that inaccurate interpretations undermine the use of these measures and that educators improve their decisions by analyzing the graph and collecting data for longer than six weeks.
- Regional Educational Laboratory Southeast, Institute of Education Sciences. Ask A REL Response: policy surrounding data-based progress monitoring. Response page. Source of the characterization of Ardoin and colleagues’ systematic review of decision rules, including the statement that most decision-making practices are based on expert opinion and that more research is required. Ardoin and colleagues’ article was not opened; this federal summary of it was.
- Mitchell, M. A. Investigating the Use of Maze-CBM for High School Students. University of Maryland. Dissertation record. Source of the 14-study, 5,839-student review of maze in grades 6–12, the predictive and concurrent validity medians of 0.62 and 0.63, the 0.79-to-0.96 alternate-form reliability from a single grade 8 sample, and the conclusion that reliability is often below acceptable levels for progress-monitoring decisions while maze shows promise for screening.
- Calhoon, M. B. Curriculum-Based Measurement for Mathematics at the High School Level: What We Do Not Know . . . What We Need to Know. Assessment for Effective Intervention, 33(4). Repository record with abstract. Source of the statement that only one study existed on curriculum-based measurement as an assessment tool in secondary-level mathematics courses at the time of writing.
- Illinois MTSS Network, Northern Illinois University. MTSS Conversation Starter: Defining Progress Monitoring at the High School Level. Conversation starter (PDF). Source of the high-school measure list, the maze pitched to eighth-grade national norms, the five-minute writing sample scored by correct minus incorrect word sequences, and the tier 2 and tier 3 frequency restatement.
- National Center on Intensive Intervention / American Institutes for Research. Progress Monitoring and What Is Progress Monitoring? Features one-pager (PDF). Source of the definition as repeated measurement using tools with strong reliability and validity, and of the at-least-biweekly tier 2 and at-least-weekly tier 3 standard.
- PROGRESS Center, American Institutes for Research. Using Academic Progress Monitoring for Individualized Instructional Planning (session transcript). Transcript (PDF). Source of the standardization distinction between progress monitoring and informal classroom check-ins, and of the point that screening covers all students while progress monitoring is reserved for students receiving an intervention.
- Hamilton, L., Halverson, R., Jackson, S., Mandinach, E., Supovitz, J., & Wayman, J. Using Student Achievement Data to Support Instructional Decision Making. NCEE 2009-4067, Institute of Education Sciences. Practice guide (PDF). Source of the low evidence rating on all five recommendations and the panel’s statement that it cannot point to rigorous research proving the practices improve achievement. Note that this guide addresses interim and benchmark data and does not cover curriculum-based progress monitoring.
- National Center on Intensive Intervention. Academic Progress Monitoring Tools Chart. Resource page. Source of the statement that the technical review committee rated each submitted tool against its criteria without comparing tools to one another.
- easyCBM (Riverside Insights). Pricing. Vendor pricing page. Source of the free tier for an individual teacher up to 200 students, the reading form counts for grades 6 to 8, the absence of grades 9 to 12 coverage in the free tier, and the $69.99 annual paid tier.
- University of Minnesota, College of Education and Human Development. Creating Maze Reading Passages. Guidance page. Source of the maze construction requirements: passages of at least 200 words, at least eighteen passages for a school year, and distractors that cannot make contextual sense and cannot rhyme.