Tag: assessment

  • The 1–4 Standards-Based Grading Scale, and the Conversion Problem Nobody Solves

    The 1–4 Standards-Based Grading Scale, and the Conversion Problem Nobody Solves

    A 1–4 standards-based grading scale reports how well a student has met a standard, not how many points they accumulated. Four means beyond the standard, three means meeting it, two means approaching it, one means not yet. Three is the target, not four — which is the single thing most families and a fair number of teachers have wrong about it.

    The scale itself is not hard. What is hard is the part nobody puts on the poster: turning those numbers back into a letter grade, because almost every school that adopts a four-point scale still has to file a percentage at the end of the term.

    This page covers what each level means, why four levels rather than a hundred, and the conversion problem — including why the neat conversion chart your district hands out is a convention rather than a measurement.

    Key Takeaways

    • 3 is proficient and it is the goal. A 4 is not “an A” — it is work beyond the grade-level standard, and a student can have an excellent year without many of them.
    • Four levels exist because a hundred do not work. Asked to grade one paper, 90 trained high-school teachers produced scores from 50 to 96.
    • Nearly two-thirds of a 100-point scale describes failure. That is an accident of arithmetic nobody designed on purpose.
    • The zero is the clearest case. Recovering from one zero in a percentage system takes perfect scores on at least nine other assignments.
    • There is no validated conversion from 1–4 to letters. Every chart is an institutional convention, and they disagree with each other.
    • Do not average the levels. Averaging reintroduces exactly the precision the scale was built to remove, and it punishes students who improved.
    • Decide what a 3 means before September, in writing, with the department. Most scale arguments are definition arguments wearing a number.

    Free Download · Printable PDF

    1–4 Scale and Conversion Sheet

    The four level descriptors in student-facing language, three conversion approaches side by side, the decision rules that beat averaging, and a one-page explainer you can send home.

    Download the free PDF

    Free. No email address required. Designed for grades 6–12. Rubric templates are on the standards-based grading rubrics page.

    What Each Level on the 1–4 Scale Means

    There is no national definition, which is worth saying out loud before anyone quotes one at you. Schools write their own descriptors, and they vary. The shape is consistent though, and this family-facing version from Gateway Public Schools is about as standard as it gets:
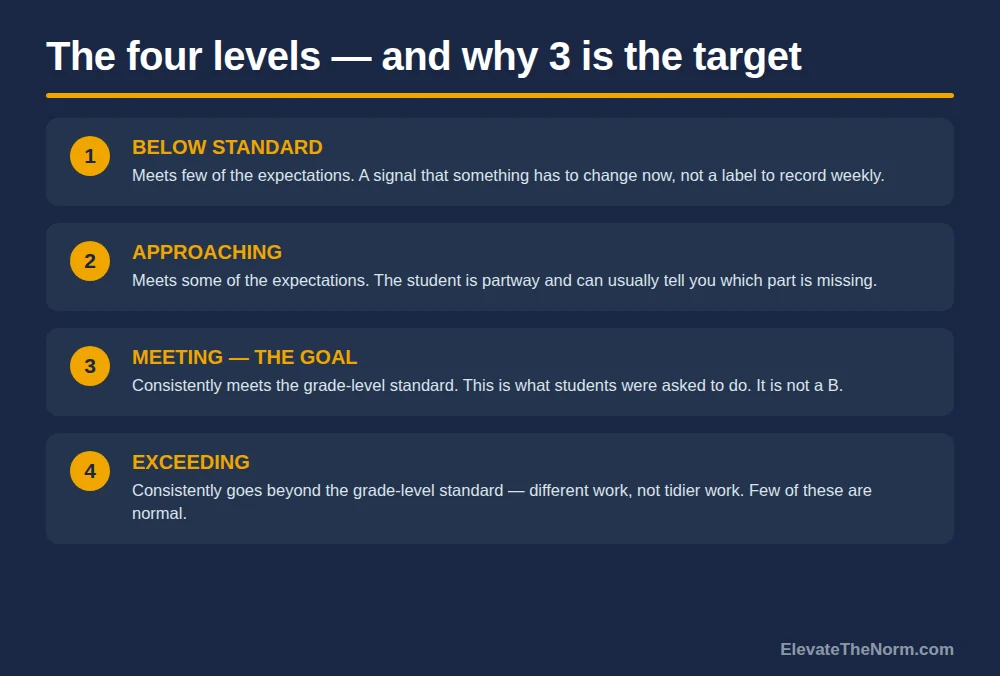
    The four levels of a standards-based grading scale, in order: below standard, approaching, meeting, exceeding
    Three is the target. Four is a different kind of work, not a better grade.

    A 4consistently exceeds expectations” for skills and understanding. A 3 consistently meets them. A 2 meets some of them. A 1 meets few.

    Read the word consistently in the first two. It is doing more work than the numbers. A student who produced one brilliant analysis in October and nothing like it since is not a 4, and a student who has hit the standard on the last three attempts is a 3 even if the first attempt was dreadful. The scale is a claim about where a student is now, not a summary of everything they have ever handed in.

    The 4 causes most of the trouble at home, because families read four levels and assume A/B/C/D. It is not that. A 4 is work that goes past the grade-level standard — a different kind of task, not a tidier version of the same one. A student can meet every standard in your course, be entirely successful by any honest account, and collect very few 4s. If your reporting language does not say that plainly, you will spend October explaining it one parent at a time.

    Why Four Levels and Not a Hundred

    Because nobody can tell the difference between an 84 and an 86, and pretending otherwise has a cost.
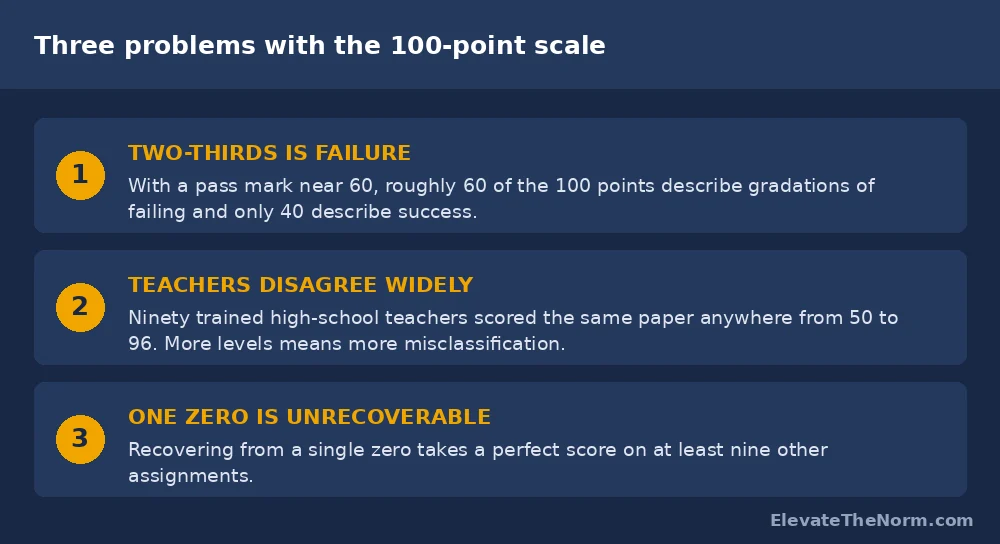
    Three problems with the 100-point grading scale: two-thirds is failure, teachers disagree widely, one zero is unrecoverable
    The four-point scale is not a simplification. It is a correction.

    Thomas Guskey has made this case more carefully than anyone. In The Case Against Percentage Grades he points out that with a pass mark around 60, nearly two-thirds of the percentage scale describes levels of failure — sixty-odd gradations of failing and about forty of succeeding. No one chose that. It is what happens when you inherit a scale and never ask what it is for.

    On reliability he cites a 2011 replication of a study first run in 1912. Ninety high-school teachers, given twenty hours of training, scored the same paper. The scores ranged from 50 to 96. More levels do not produce more accuracy; Guskey’s phrase for it is the illusion of precision, and his point is that with more levels more students are simply misclassified.

    Then the zero, which is the cleanest arithmetic in the whole argument. To recover from a single zero in a percentage system, a student must earn a perfect score on at least nine other assignments. On a 0–4 scale the same missing piece of work costs about what it should. Guskey recommends integer scales for exactly this reason, and notes they line up with the GPA scale and with state assessment levels that already use four.

    Worth being honest about what this evidence is. It is an argument about measurement and reliability, not a trial showing that four-point scales raise achievement. What the outcome evidence on standards-based grading actually shows is a separate and more mixed question. The case for four levels is that the number you report means something. That is a real benefit and it is not the same as a test-score claim.

    The Conversion Problem

    Here is the part the training day skips. Almost every school running a 1–4 scale still has to produce a letter grade, a GPA, or a transcript percentage — and there is no validated way to get from one to the other.
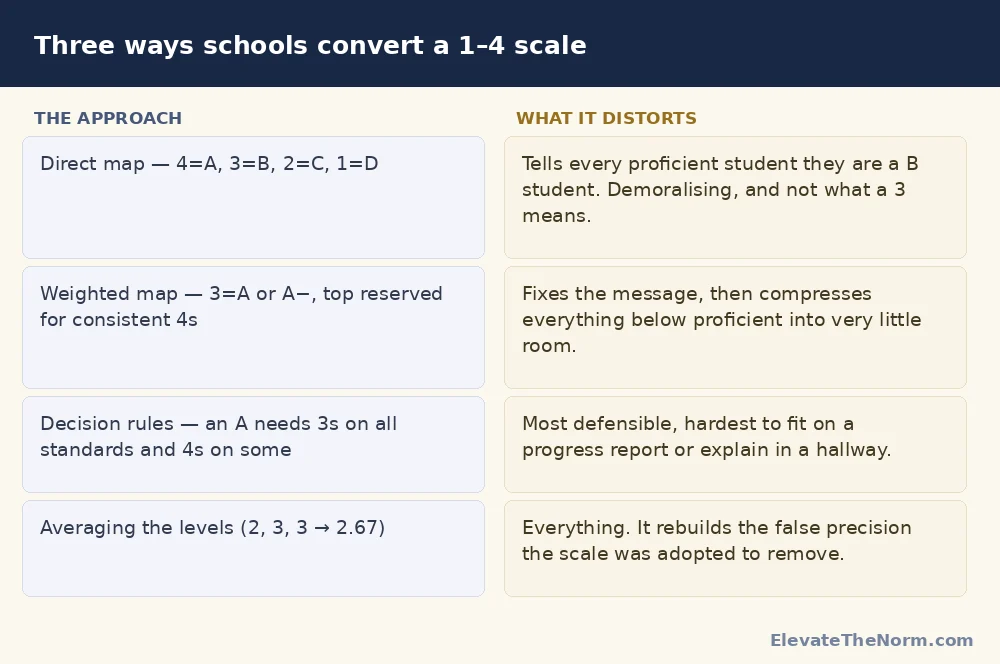
    Three approaches to converting a 1-4 standards scale into letter grades, with what each one distorts
    Every conversion chart is a local convention. None of them is a measurement.

    Districts generally pick one of three approaches. A direct map assigns a letter to each level: 4 is an A, 3 a B, and so on. It is simple and it quietly tells every proficient student they are a B student, which is both demoralising and false. A weighted map puts 3 at an A or A− and reserves the top only for consistent 4s, which fixes the message and compresses everything below into very little room. A decision-rule approach sets conditions instead of arithmetic — an A requires 3s on all standards and 4s on some, a B requires 3s on nearly all — which is the most defensible and the hardest to explain on a progress report.

    None of those is discovered. They are all chosen. If you are looking for the correct conversion chart, stop: what you are actually choosing is what your school wants a letter grade to mean, and the arithmetic follows from that decision rather than producing it.

    The question underneath the family anxiety is usually GPA, and it deserves a straight answer. A transcript still has to carry letters or a grade point, so the conversion your district picks is the thing that reaches a college — not your levels. A direct map that makes proficient students into B students will pull a GPA down relative to a neighbouring district doing it differently, and that is a real consequence rather than a misunderstanding to be explained away. If your school is adopting a four-point scale, someone should model what it does to the GPA distribution before it goes live, and should be able to tell families the answer. “It all works out” is not an answer.

    Which is why the one genuinely portable rule is a negative one.

    Do not average the levels

    Averaging is the default in every gradebook and it undoes the scale. Three reasons, in order of how much damage they do.

    It reintroduces false precision. A student with levels of 2, 3 and 3 averages to 2.67, and 2.67 is not a thing. The scale has four values because four is roughly what professional judgement can reliably distinguish. Producing two decimal places from it is the exact error the scale was adopted to stop.

    It punishes the students who improved. A student who goes 1, 2, 3, 3 has learned the thing. Their average says 2.25 — approaching. Their most recent evidence says 3. One of those numbers is a description of a student and the other is a description of their history, and only one of them is what a grade is supposed to report.

    It hides the pattern that matters. Two students both averaging 2.5 — one going 3, 3, 2, 2 and one going 2, 2, 3, 3 — need opposite conversations. The average erases the only information that would tell you which is which.

    The usual alternatives are the most recent evidence, the mode, or professional judgement with the pattern in front of you. All three are defensible; all three require you to be able to say why. That is a feature, and it is also why this works far better when a department agrees the rule together rather than each teacher inventing one, which is the same failure mode as most of the ways standards-based grading goes wrong.

    Two practical warnings. The first is that your gradebook will fight you: most systems average by default, several will not store a non-numeric level at all, and a few will happily average your levels behind the scenes while displaying something else. Find out which yours does before you trust a term’s worth of data to it.

    The second is about the scale’s own reliability, and it would be dishonest to leave out. Fewer levels reduce disagreement between teachers; they do not remove it. Two teachers in the same department, marking the same essay against the same descriptors, will still hand back a 2 and a 3 often enough to matter to the student sitting between them. The fix is not a better rubric, it is moderation — a department periodically marking the same three pieces of work and arguing until the descriptors mean the same thing to everyone. An hour a term does more for grading accuracy than any conversion chart.

    Let Them Argue Their Own Level

    The most useful thing I do with this scale is not marking with it. It is making students say a number out loud and defend it.

    In a project check-in the question is not how is it going — that gets you fine. The question is which level the work is currently at and what would move it up one. They have the descriptors. They have their own draft. They have to make the case, and I get to hear the reasoning rather than guess at it.

    What happens is consistently more interesting than the grade. Students undersell by about a level and can usually name precisely what is missing, which means the gap was never that they did not know — it was that nobody had asked them to say it. A student who can tell you they are at a 2 because their evidence is thin in the second section has just written their own next step, and they will do it because it was theirs.

    It also does something to the scale itself. A number a student has argued for is a number they understand. A number that arrives on a report card is a verdict, and teenagers treat verdicts the way anyone does — as something to contest or absorb, but not as information. If you want a structure for this rather than an improvised conversation, a short self-assessment form does most of the work.

    One thing the scale should never become is a label. A 1 or a 2 is a statement about a piece of work at a point in time and it is supposed to trigger something — a re-teach, a conference, a second attempt that actually counts. If a student sits at 2 for six weeks and the only consequence is that the 2 keeps being recorded, the scale has stopped doing its job and become a slower way of writing a D. The number is a prompt for the adult, not a verdict on the child.

    If Your District Requires Percentages Anyway

    Most teachers reading this do not get to choose the reporting system. That is fine and the scale is still worth using; you just have to keep the two jobs separate.

    • Assess in levels, report in whatever they require. The conversion happens once, at the end, as a deliberate act rather than a running total.
    • Keep the level in front of students all term. They should see 1–4 on returned work even if the portal shows a percentage, because the level is the part they can act on.
    • Write your conversion rule down before you need it and give it to students and families in September. A rule published in advance is a policy; the same rule produced in May is an argument.
    • Never convert a single assignment. Convert the body of evidence for a standard, once. Converting each task and then averaging the percentages is the worst of both systems.
    • Expect the first term to be rough and say so. Families are fluent in percentages and your scale is new to them.

    And if you are the person choosing the system rather than living inside it, the honest brief is: a four-point scale buys you numbers that mean something and costs you a conversion argument you will have every year. That is usually a good trade. It is not a free one, and schools that present it as free are the ones that abandon it in year two.

    Before you go: grab the free 1–4 Scale and Conversion Sheet (PDF) — ElevateTheNorm.com branded, printable, no email required.

    Frequently Asked Questions

    What does each number mean on a 1–4 standards-based grading scale?

    4 means the work consistently goes beyond the grade-level standard, 3 means it consistently meets the standard, 2 means it meets some expectations, and 1 means it meets few. There is no national definition — schools write their own descriptors and they vary — but that shape is close to universal. The word doing the most work is “consistently”: the level describes where a student is now, across recent evidence, not an average of everything they have ever submitted.

    Is a 3 a B?

    Only if your district decided it is, and that decision is a convention rather than a measurement. A 3 means the student has met the standard, which in most schools’ own language is exactly what they were asked to do. Mapping that to a B tells every proficient student they are second-tier, which is both discouraging and inaccurate. Schools that think it through usually land on 3 as an A or A−, with the very top reserved for consistent 4s.

    Should I average standards-based grading scores?

    No. Averaging 2, 3 and 3 into 2.67 manufactures a precision the scale exists to avoid, and it penalises exactly the students who improved — a student who went 1, 2, 3, 3 has learned the material, whatever the mean says. Use the most recent evidence, the mode, or professional judgement with the whole pattern visible. Whichever you pick, agree it with your department and publish it before the term starts.

    Why not just use percentages?

    Because they are less accurate than they look. With a pass mark near 60, roughly two-thirds of a 100-point scale describes gradations of failure, and reliability research is unkind: asked to score one paper, 90 trained high-school teachers produced marks from 50 to 96. Then there is the zero — recovering from a single zero requires a perfect score on at least nine other assignments, which is a punishment nobody consciously designed.

    How do I explain the 1–4 scale to parents?

    Lead with the fact that 3 is the goal, because that is the misunderstanding underneath almost every worried email. Say plainly that a 4 is work beyond the grade-level standard rather than a better version of the same work, and that a student can be entirely successful with few 4s. Send it in writing in September, before any scores exist — the same explanation lands very differently once a family is looking at a number they do not like.

    What if a student improves a lot at the end of the term?

    Then their level should reflect that, which is the main practical advantage of the scale over a running average. A student who finishes the term demonstrating proficiency has demonstrated proficiency; a system that averages away their improvement is reporting their history rather than their learning. The check worth running is whether the recent evidence is genuinely consistent rather than one good day.

    Does standards-based grading hurt my child’s GPA?

    It depends entirely on the conversion your district chose, which is a decision rather than a property of the scale. A direct map where a 3 becomes a B will produce lower grade points than a weighted map where a 3 is an A−, for identical work. Since a transcript still carries letters or grade points, that choice is what actually reaches a college. It is a fair question to ask your school, and the right form of it is specific: what does a 3 convert to, and what happened to the GPA distribution the year you adopted this?

    Does a 1–4 scale improve student achievement?

    That is a different and much less settled question than whether it measures more honestly. The case for four levels is a measurement argument — fewer levels mean fewer misclassifications and a number that means something. The evidence on whether standards-based grading as a whole moves outcomes is genuinely mixed, and anyone selling it as a proven achievement intervention is going past what the research supports.

    Sources

    • Guskey, T. R. The Case Against Percentage Grades. Read the paper (PDF) — source for the two-thirds-of-the-scale-is-failure point, the 2011 replication in which 90 trained high-school teachers scored one paper from 50 to 96, the nine-assignments-to-recover-from-one-zero figure, and the recommendation to use integer 0–4 scales. This is an argument from measurement and reliability research; it is not a trial of student outcomes, and it should not be cited as one.
    • Gateway Public Schools. Grading and the four-point scale: an overview for families. Read the overview (PDF) — source for the level descriptors quoted above. One school’s definitions, used here because they are clearly written and representative; there is no national standard, and your district’s wording governs in your building.

    Every link above was checked on September 17, 2026. The three conversion approaches described in this article are common practice observed across published district policies, not findings from a study — there is no validated conversion between a four-point scale and letter grades, which is precisely the argument this page is making.



    About Clay Shumate

    By Clay Shumate — Clay Shumate is a certified secondary Social Studies teacher in the public schools of West Alabama, now in his seventh year in the classroom, with a B.A. in History and an M.Ed. in Secondary Education. He writes about project-based learning, student responsibility, respect, and practical ways to hold young people to a higher standard while giving them room to learn from mistakes. He is a member of the Society of Professional Journalists and writes to its Code of Ethics; this site’s editorial standards and corrections policy are published in full.

  • Why Standards-Based Grading Doesn’t Work: The Objections, Taken Seriously

    Why Standards-Based Grading Doesn’t Work: The Objections, Taken Seriously

    Standards-based grading fails in practice more often than its advocates admit, and almost never for the reason its critics give. The objection is rarely that measuring proficiency against standards is a bad idea. It is that schools adopt a system requiring absolute consistency, deliver it inconsistently, and then discover that students, teachers and families all noticed.

    This article takes the objections seriously rather than dismissing them as resistance to change. Several of them are correct.

    If you want the case for it and what the evidence shows, that is a separate piece: what standards-based grading is and what the research supports. This one is the other half.

    Key Takeaways

    • Teachers are not marginally opposed to some of this. In a survey of nearly 1,000, 81 percent called no-zero policies harmful.
    • Students object on specific, checkable grounds — inconsistency between teachers above all, not a general dislike of change.
    • Reassessment can be socially costly. Some students said it made them appear stupid, which no policy document accounts for.
    • Piecemeal adoption is the norm and the problem. These practices were designed as a connected system; almost nobody implements them that way.
    • The most common failure is sequencing. Changing the report card before agreeing the standards produces a form nobody can complete consistently.
    • None of this makes it a bad idea. Most of it makes it a bad idea right now, in a specific building, under specific conditions.

    Free Download · 2-page PDF

    Standards-Based Grading Readiness Check

    The five “not yet” conditions as a department checklist, plus the one-hour moderation test, a reassessment rule builder and a transcript answer planner.

    Download the free PDF

    Free. No email address required. Designed for grades 6–12. Browse every printable in Your Free Library.

    What Teachers Actually Say

    The Thomas B. Fordham Institute, working with RAND, surveyed nearly a thousand K–12 teachers about grading policies commonly bundled with standards-based and equitable grading reform. The results are not close.

    Bar chart showing the percentage of teachers rating no-zero policies, no late penalties and unlimited retakes as harmful
    81 percent called no-zero policies harmful. That is not a fringe objection.

    Eighty-one percent rated no-zero policies as harmful, with the consensus holding across demographic groups. Fifty-six percent said the same about removing late penalties. Unlimited retakes were the most accepted of the five policies studied, and even there the split was 41 percent helpful against 37 percent harmful.

    A leader looking at those numbers has two options. Conclude that most of the profession is wrong, or take seriously that the people delivering the policy think it damages engagement.

    There is a detail in that survey which matters more than the headline. Only 6 percent of teachers worked in districts using four or more of these policies, and just 2 percent had all five. Researchers flagged that piecemeal adoption as a concern, because the practices were designed as an interconnected system rather than standalone interventions.

    Which means a large share of the teachers rating these policies harmful were rating them as they experienced them — one piece, bolted onto a system built on different assumptions. A no-zero policy inside a traditional points gradebook really is incoherent. That is not a misunderstanding on the teacher’s part. It is an accurate reading of a half-finished reform.

    Writing for Fordham, Meredith Coffey makes a related argument: doing this well depends on school-level adaptation rather than district mandate, on standards rigorous enough that “meeting expectations” means something, and on students having genuine opportunities to demonstrate competency. Her named failure modes are a low bar, a top-down mandate without buy-in, and large schools with high teacher turnover.

    What Students Say — and Why They Are Mostly Right

    The most useful study here is secondary-specific, which is rare in this field. Peters, Kruse, Buckmiller and Townsley analysed over 500 critical statements from students at one high school during its first year of standards-based grading, published in American Secondary Education.

    Five objections secondary students raised about standards-based grading, including inconsistency, homework not counting and reassessment stigma
    Students were not confused. They were describing a first-year rollout accurately.

    Inconsistency came first. As one student put it, “some teachers do it sometimes, others all the time, and some don’t do it at all.” Reassessment timelines, eligibility and limits all varied by classroom.

    Read that as a finding rather than a complaint. A student is describing, accurately, a system that promises objectivity and delivers a different rule in every room. Their conclusion — that it is unfair — is a reasonable inference from the evidence available to them.

    Homework counting for nothing came second. Students had done the work and watched the grade not move. The theory is sound: effort is a work habit, not evidence of proficiency. But if that has not been explained repeatedly, what a fifteen-year-old experiences is the school announcing that their effort was pointless.

    Reassessment carried social cost. Some students said it made them “appear stupid.” This one rarely appears in implementation plans at all, and it is the one I find most persuasive, because no amount of policy design removes it. If reassessing is visible, it is a public statement about who did not get it the first time.

    Motivation shifted early. Students reported studying less at first, reasoning they could just reassess later. That is rational behaviour in response to the incentives as they understood them.

    The limitations, which the authors state: one high school of about 500 students, predominantly white and economically advantaged, during a first year of implementation when inconsistency would be at its peak, with the analysis deliberately focused on critical comments in order to understand resistance. Three of the four authors were university professors who use standards-based grading themselves. So this is not a representative picture of how students feel everywhere — it is a detailed picture of what goes wrong in year one.

    The Reassessment Problem, and What I Do About It

    When I need to redirect a student, I do it quietly, at close range, rather than announcing it to the room. It takes the same number of seconds and it costs the student nothing in front of thirty people.

    The reassessment stigma finding is the same problem wearing different clothes. A student who has to publicly identify as someone who did not meet the standard has been handed a cost the policy never intended and never accounted for.

    Most of the fix is logistical rather than philosophical. Reassessment that happens quietly, at a normal time, in a way that does not mark anyone out — scheduled during work everyone is doing, arranged in a two-word conversation at the table rather than announced, with more than one student doing it at once wherever possible. None of that changes the grading system. All of it changes whether a fifteen-year-old will use it.

    A reassessment policy nobody will be seen using is not a reassessment policy. It is a line in a handbook.

    The Objections That Do Not Hold Up

    Not every criticism survives contact with the detail, and it is worth separating those out rather than treating all resistance as equally well founded.

    • “It lowers standards.” It can, if “meeting expectations” is set at a trivial bar — Coffey names exactly that as a failure mode. But that is a decision about rigour, not a property of the system. A traditional gradebook with generous partial credit lowers standards just as effectively and less visibly.
    • “Students will game the retakes.” Some will, early on, and the student data confirms it. It is also the objection most easily fixed by a written rule about what a student must do to earn a reassessment. “Unlimited” is not a policy.
    • “It does not prepare them for the real world.” Most work outside school involves revision, feedback and redoing things until they are right. The single-attempt model is the unusual one.
    • “Colleges do not use it.” Students raised this and it is a genuine anxiety, but it is a transcript-conversion question rather than an argument about grading. It has an answer; schools just have to give it before the first report card rather than after.

    The pattern across all four: each is a real risk that a school can design against, and each becomes a genuine failure when nobody does.

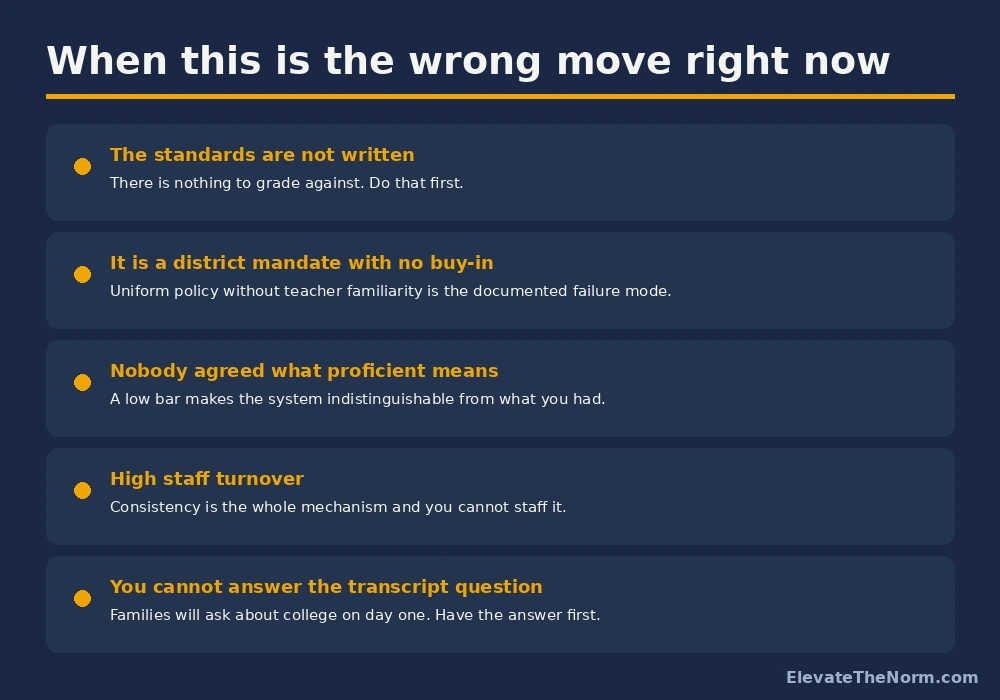
    When Standards-Based Grading Is the Wrong Move Right Now

    Five conditions under which the honest recommendation is “not yet.”

    Five conditions under which a school should not adopt standards-based grading yet, including unwritten standards and district mandates without buy-in
    None of these are arguments against the idea. They are arguments about timing.

    The first is the one that sinks most rollouts. If the standards themselves are not written in language a student could read, there is nothing to grade against, and every teacher will invent their own — which produces precisely the inconsistency students identified as the core injustice.

    The second is structural and largely outside a teacher’s control. A district mandate with no buy-in is the documented failure mode, and Coffey’s argument is that school-level adaptation is what makes this work. A staff told to implement something they do not understand will implement five different versions of it.

    And the last one is the cheapest to fix and the most often skipped. Families will ask about transcripts and college on day one. Not having an answer does not make the question go away; it just means the first person to answer it will be someone on a parents’ group who has guessed.

    What to Do Next

    If your school is considering this, the most useful meeting you can have is not about the report card. It is about whether every teacher in a department would give the same proficiency level to the same piece of work. Test it — take one student’s work, have four teachers score it independently, and compare.

    If the answers diverge, you have found the actual problem, and it is the same problem whether you are grading by standards or by percentages. Standards-based grading did not cause it. It just makes it visible to students, who will then tell you it is unfair, and they will be right.

    Fix the agreement first. The free proficiency-level rubrics are a reasonable place to start that conversation, no email required.

    The conversion objection deserves its own answer rather than a footnote. Turning proficiency levels back into a percentage is the point where most of these arguments actually stall.

    Before you go: grab the free Standards-Based Grading Readiness Check (PDF) — ElevateTheNorm.com branded, printable, no email required.

    Frequently Asked Questions

    Do most teachers dislike standards-based grading?

    They dislike specific policies bundled with it, sometimes overwhelmingly. In a Fordham and RAND survey of nearly 1,000 teachers, 81 percent called no-zero policies harmful and 56 percent said the same about removing late penalties. Unlimited retakes split roughly evenly. What that survey does not show is teachers rejecting the underlying idea of grading against standards — it shows them rejecting individual practices, frequently as they experienced them bolted onto a traditional gradebook.

    What is the strongest argument against standards-based grading?

    Inconsistency, and it comes from students rather than from critics. When secondary students were asked what was wrong with it, their first and loudest answer was that different teachers applied it differently — different reassessment rules, different timelines, different eligibility. A system that promises a more accurate grade and delivers a different rule in every classroom has undermined its own central claim, and students notice that immediately.

    Do students really dislike it?

    In the one detailed secondary study available, yes — during the first year, in one school. They objected to inconsistency, to homework effort not counting, to a perception that As were harder to get, to the social cost of reassessing, and to a fear about college. The authors are clear about limits: one high school of around 500 students, predominantly white and economically advantaged, analysed specifically to understand resistance. It is a good picture of year-one problems, not a verdict on the model.

    Does it lower standards?

    It can, and that is a decision rather than a property of the system. If “meeting expectations” is set at a trivial bar, the grades mean no more than the ones you had before. The rigour of the standard is the thing to argue about — and it is worth noticing that a traditional gradebook with generous partial credit and extra-credit points lowers standards just as effectively, only less visibly.

    Will students stop trying if they can always retake?

    Some will at first. Students in the research said exactly that — they studied less initially because they believed they could reassess later. The fix is not abandoning reassessment but writing down what a student has to do to earn one. “Unlimited retakes” is the absence of a policy, and the schools that struggle most with this are the ones that never specified.

    Why do so many districts reverse course on it?

    Usually sequencing and mandate. Changing the report card before the staff has agreed what the standards are produces a form nobody can complete consistently, and a district-wide requirement without school-level buy-in produces as many versions of the system as there are teachers. Add a first-year dip in work completion, which is well documented and widely unexpected, and a leadership team reads month three as proof of failure.

    So should a school do it or not?

    It depends almost entirely on whether the groundwork exists. If your standards are written in student-readable language, your department can score the same work the same way, your reassessment rule is specific, and you can answer the transcript question — it is a better system for telling the truth about what students can do. If any of those are missing, fix that first. Most failures documented in this article are failures of preparation, not of the idea.

    Sources

    • Peters, R., Kruse, J., Buckmiller, T., & Townsley, M. (2017). “It’s just not fair!” Making sense of secondary students’ resistance to a standards-based grading. American Secondary Education, 45(3), 9–28. Full text (PDF) — one high school, first year of implementation, predominantly white and economically advantaged; analysis focused deliberately on critical statements.
    • Geduld, A. (2025, September 17). A thousand teachers were asked about “equitable” grading. Most didn’t like it. The 74. Read the article — reporting on a Thomas B. Fordham Institute survey conducted with RAND. The survey itself was not read directly; this article is the source for the figures quoted above.
    • Coffey, M. (2025, October 2). Standards-based grading can benefit students — in the right context. Thomas B. Fordham Institute. Read the commentary — the source for the conditions for success and the named failure modes.
    • Marsh, V. L. (2023, November). Standards-based grading: History, practices, benefits, and challenges. Center for Urban Education Success, University of Rochester. Read the brief (PDF) — context on the implementation dip and stakeholder resistance.

    Every link above was checked on September 12, 2026. Two of these sources are advocacy or commentary rather than primary research, and the text says which is which.


    About Clay Shumate

    By Clay Shumate — Clay Shumate is a certified secondary Social Studies teacher in the public schools of West Alabama, now in his seventh year in the classroom, with a B.A. in History and an M.Ed. in Secondary Education. He writes about project-based learning, student responsibility, respect, and practical ways to hold young people to a higher standard while giving them room to learn from mistakes. He is a member of the Society of Professional Journalists and writes to its Code of Ethics; this site’s editorial standards and corrections policy are published in full.

  • Standards-Based Grading: What It Is, What It Fixes, and What the Evidence Shows

    Standards-Based Grading: What It Is, What It Fixes, and What the Evidence Shows

    A standards-based grading system reports what a student can do against specific course standards, using a small number of proficiency levels, with academic achievement kept separate from behaviour. It is a better communication system than traditional grading. It is not, on the current evidence, a way to raise achievement — and the people who research it say so plainly.

    That gap between what standards-based grading is good at and what schools are often told it will do is where most implementations fail. A staff that adopts it expecting test scores to move will conclude in year two that it did not work, and they will be measuring the wrong thing.

    This is what it actually is, what the research shows and does not show, and what goes wrong.

    Key Takeaways

    • Three criteria define it: report on standards, use three to five levels, and separate achievement from behaviour. Everything else is a local choice.
    • The clearest benefit is accuracy of meaning. A standards-based grade tells you what a student can do; an 87 percent does not.
    • There is no evidence it raises achievement. That is Guskey’s own conclusion, not a critic’s.
    • One comparison found the opposite on test scores. Students at a traditionally graded school scored about 2.2 points higher on the ACT — with serious limits on what that can prove.
    • Retakes are the fight, and they are not part of the definition. Guskey argues against writing them in.
    • Curriculum alignment comes before the report card. Schools that reverse the order generate confusion and then abandon the whole thing.

    Free Download · Printable PDF

    Standards-Based Grading Starter Pack

    Proficiency-level rubrics, a standards list template and a split gradebook layout — the rubric work this article calls the heaviest lift, already started for you.

    Download the free PDF

    Free. No email address required. Designed for grades 6–12. See what is inside on the standards-based grading rubrics page.

    What a Standards-Based Grading System Actually Is

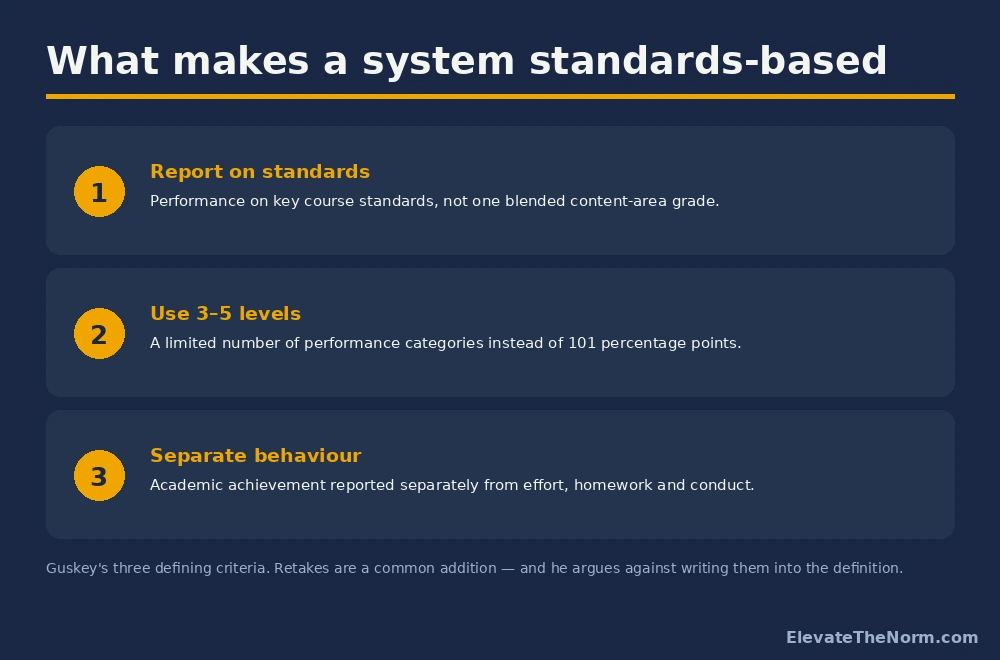
    Three defining criteria, from Linka and Guskey’s review in Theory Into Practice.

    Three defining criteria of standards-based grading: report on standards, use three to five levels, separate behaviour from achievement
    Guskey’s three criteria. Retakes are a common addition, not part of the definition.

    Report performance on key course standards rather than a single blended content-area grade. Use a limited number of performance categories, usually three to five. And report academic achievement separately from noncognitive factors like effort, homework completion and conduct.

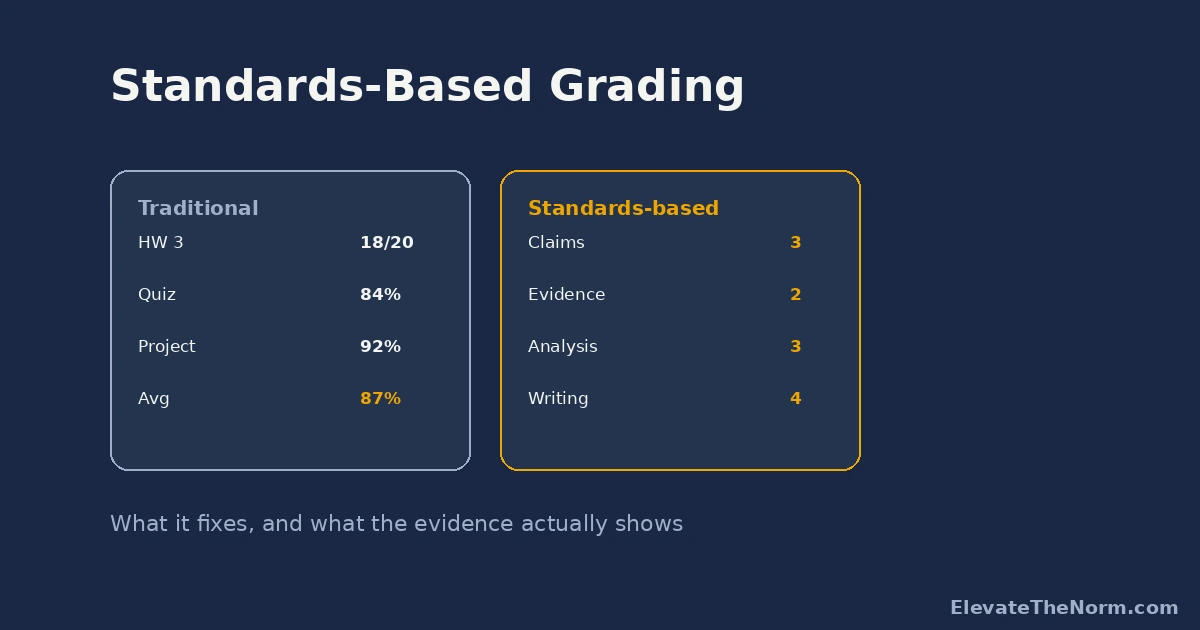
    That third one does most of the work. In a traditional gradebook an 87 percent might be a student who understands the material and forgets to hand things in, or a student who understands very little and hands in everything on time. Those are different students with different needs, and the single number hides which one you have.

    Notice what is not in the definition: unlimited retakes. Guskey is explicit that bolting additional assessment requirements onto the definition adds confusion and can produce unreliable outcomes. Reassessment policy is a separate decision, and treating it as part of the definition is why so many staff conversations about standards-based grading immediately become arguments about retakes.

    What the Evidence Actually Shows

    Here is the honest summary, and it is more mixed than either side of this argument usually admits.

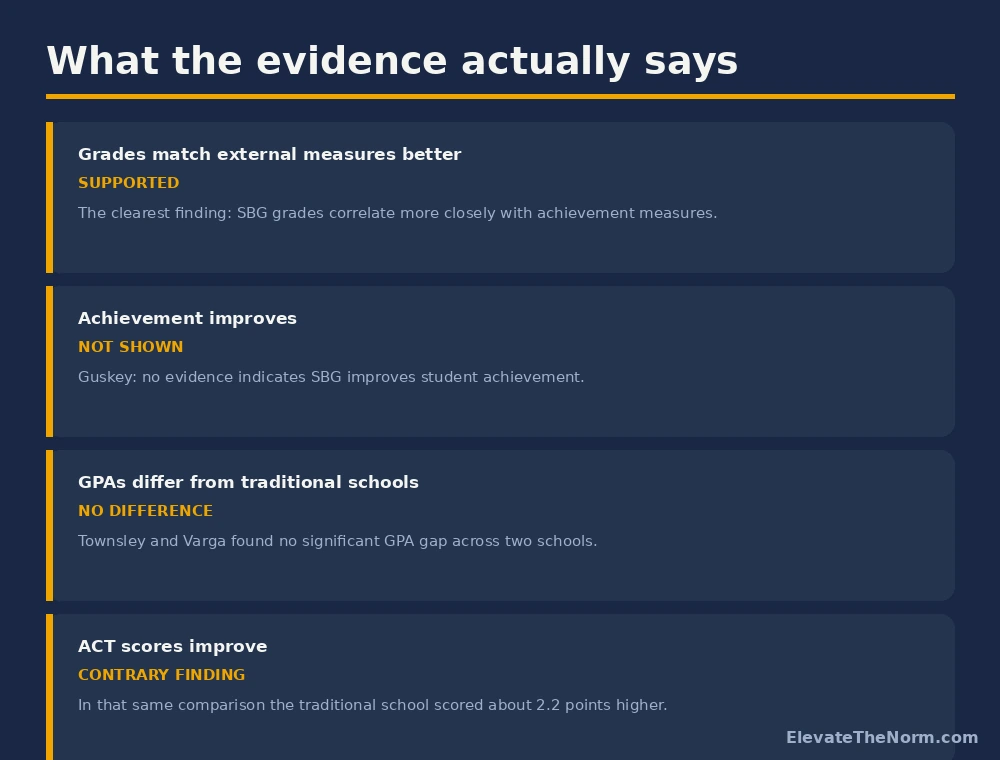
    Four claims about standards-based grading with the evidence verdict for each, including one contrary ACT finding
    One clear win, one honest blank, and one result that goes the other way.

    What is supported. Standards-based grades show a stronger relationship with external measures of achievement than traditional grades do. In plain terms: the grade means more, because it is measuring one thing rather than several mixed together.

    What is not shown. Guskey states it directly: no grading system by itself improves student learning, and no evidence indicates that standards-based grading improves student achievement. He also notes the approach remains largely unstudied, with much of the published guidance drawn from general grading research rather than from studies of standards-based systems specifically.

    And one result that points the other way. Townsley and Varga compared two demographically similar Midwestern high schools, one traditionally graded and one standards-based, across 327 students in two cohorts. They found no significant differences in GPA — but students at the traditionally graded school scored significantly higher on the ACT, by roughly 2.2 to 2.7 points depending on the subtest.

    That finding deserves its caveats stated rather than buried. It is quasi-experimental, not randomised: two schools that differ in grading also differ in a hundred other ways, and nothing here establishes that the grading system caused the gap. The authors say the results are limited to the schools studied and call for replication in more diverse settings. Both schools were small, under 15 percent free or reduced lunch, and had minimal ethnic diversity.

    It is one study and it cannot carry a policy. It also should not be left out, which is what usually happens to it.

    So Why Do It?

    Because “does it raise test scores” is not the only question worth asking about a grading system, and it may not even be the right one.

    A grade is a communication. Its job is to tell a student, a family and a future teacher what this person can currently do. Traditional percentage grading does that job badly — it blends understanding, compliance, timeliness and effort into one number and then reports the number to three decimal places of implied precision.

    Valerie Marsh’s research brief for the University of Rochester’s Center for Urban Education Success catalogues the reported benefits: reduced test anxiety through reassessment, clearer learning objectives, a classroom culture that talks about learning rather than points, and better communication with families. She also cites a Kentucky Algebra 2 study in which the percentage of students doing well on exams nearly doubled compared with traditionally graded peers.

    Hold that Kentucky figure loosely. It is a single course in a single context, reported in a brief rather than read here in the original, and it sits alongside Guskey’s broader conclusion that achievement gains are not established. The defensible claim is about clarity, not scores.

    If you want a reason that survives scrutiny: standards-based grading makes it much harder to hide a student who is quietly failing behind a wall of completed homework, and much harder to fail a student who understands the material but is disorganised. Both of those are worth having on their own terms.

    Catching It Before It Sets

    The most useful thing I do in a lesson has nothing to do with the gradebook. I circulate, and every so often I overhear a group working from a misconception that is about to spread to the table next to them.

    Catching it there costs thirty seconds. Catching it on a unit test costs a week and a conversation with four families.

    That is the honest case for standards-based grading, stated small. A system organised around specific standards makes you notice which standard a student is actually missing, rather than noticing that their average dropped. It does not make the noticing happen — walking around and listening does that. But a gradebook organised by standard means that when you do notice, there is somewhere obvious to record it and somewhere obvious to look next month to see whether it got fixed.

    A percentage column cannot do that. It can only go up and down.

    Where It Goes Wrong

    Marsh’s brief groups the failures into four categories, and every one of them is an implementation problem rather than an evidence problem.

    Five common implementation failures in standards-based grading, including changing the report card first and unplanned retakes
    Most failures are implementation failures, not evidence failures.

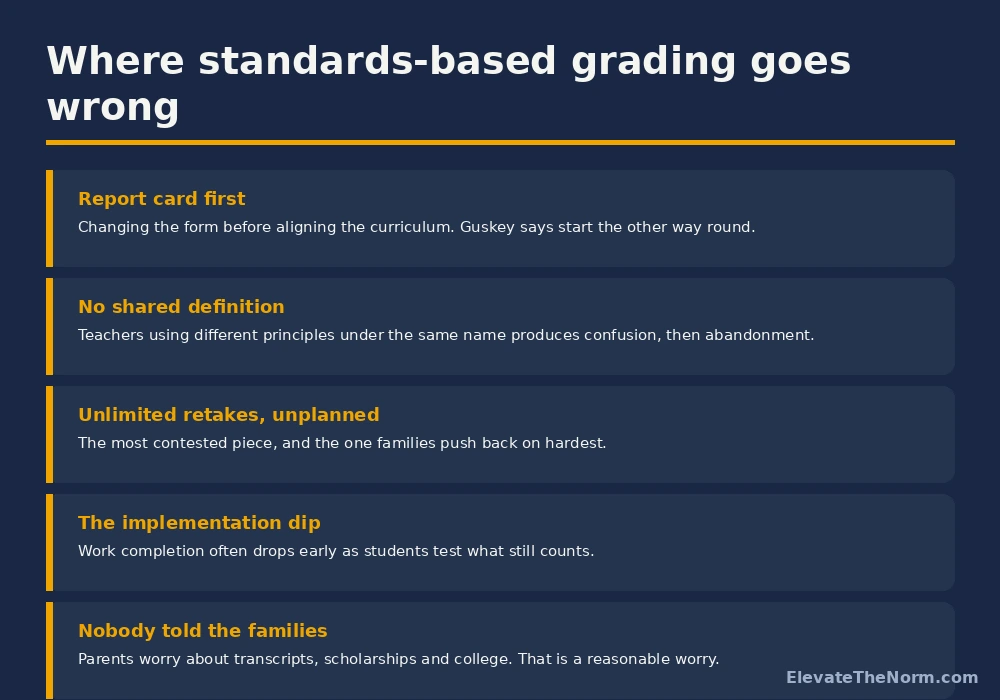
    Inconsistent understanding. Teachers report awareness of the principles but struggle to identify which ones apply. A staff using different principles under the same name produces exactly the confusion you would expect, and confusion is what precedes abandonment.

    The reassessment argument. Critics argue unlimited retakes do not reflect situations outside school and may demoralise students who cannot reach proficiency after several attempts. That is a serious objection, not a reactionary one, and a school that has not answered it will have the argument anyway — just later and in public.

    Stakeholder resistance. Parents worry about work habits, college admission and scholarships. Teachers cite workload and grade inflation. Students worry about inconsistent implementation and college readiness. Marsh notes that most of the resistance research involved suburban, predominantly white, high-achieving populations — worth knowing before assuming those concerns will show up identically in your building.

    The implementation dip. Work completion often falls early, as students feeling less accountable turn in fewer assignments and performance temporarily drops. Schools that did not expect this read it as failure in month three and reverse course.

    Guskey’s structural advice cuts through most of this: start with curriculum alignment, not with the report card. Changing the form before agreeing what the standards are produces a new-looking document that nobody can fill in consistently.

    The objections deserve more room than a summary. A companion article on why standards-based grading does not work takes them seriously — what nearly a thousand teachers said about no-zero policies and retakes, what secondary students identified as the core unfairness, and the five conditions under which the honest answer is not yet.

    Standards-Based Grading vs Traditional Grading

    The difference is not strictness. Both systems can be demanding or lax. The difference is what the number refers to.

     TraditionalStandards-based
    The grade measuresPoints accumulated across assignmentsCurrent proficiency on named standards
    Late workUsually reduces the academic gradeReported separately as a work habit
    Early failureAveraged in permanentlySuperseded if the student demonstrates the standard later
    What a parent learnsA number, and a guess at what caused itWhich specific things their child can and cannot do
    Main riskHides both struggling and disorganised studentsInconsistent application across a department

    The third row is the one families ask about, and it is worth answering directly rather than defensively. Yes, a student who could not do it in September and can do it in November is recorded as able to do it. That is the entire argument — a grade is supposed to describe current ability, and averaging in a September failure describes a student who no longer exists. It is the same reasoning behind giving students accountability and another chance everywhere else.

    If You Are Starting This in One Classroom

    1. List the standards first. Six to ten for the course, in language a student can read. This is the step schools skip and it is the whole foundation.
    2. Pick your levels and define them. Three to five, with a written descriptor for each. Vague levels are worse than percentages.
    3. Split the gradebook. One section for achievement by standard, one for work habits. Do this before you change anything a family sees.
    4. Decide the reassessment rule in advance — and write down what a student must do to earn one. “Unlimited” is not a policy; it is the absence of one.
    5. Tell families in writing, early. Transcripts and scholarships are a legitimate concern. Say how your school converts this for those purposes.
    6. Expect the dip. Work completion may fall first. Plan for it rather than being surprised by it.

    The rubric work is the heaviest lift. If you want a starting point, the free standards-based grading rubrics page has editable proficiency-level descriptors you can adapt, no email required.

    What to Do Next

    Be honest with yourself about what you expect from it. If you are hoping for higher test scores, the evidence does not promise them and one comparison points mildly the other way. If you want a grade that tells the truth about what a student can do, that is a real and defensible reason, and it is the one the research actually supports.

    Start with the standards list for one course. Not the report card, not the software, not a department vote. Six to ten statements about what a student should be able to do by June — written where a fifteen-year-old could read them and tell you which ones they have got. Most of the value of this system shows up the moment that list exists, whatever you end up doing with the gradebook.

    When you do get to the gradebook, the next thing to settle is the scale itself — and converting a 1–4 level into a report-card grade is where most implementations get stuck.

    Before you go: grab the free Standards-Based Grading Starter Pack (PDF) — ElevateTheNorm.com branded, printable, no email required.

    Frequently Asked Questions

    Does standards-based grading improve student achievement?

    On the current evidence, no — and that comes from the researchers who study it rather than from its critics. Guskey’s position is that no grading system by itself improves student learning and that no evidence indicates standards-based grading improves achievement. What it does do reliably is make grades correspond more closely to external measures of what students can actually do. That is a real benefit, and it is a different claim from raising scores.

    Is there research showing it makes things worse?

    There is one comparison worth knowing about. Townsley and Varga looked at two demographically similar Midwestern high schools, one traditional and one standards-based, and found no GPA difference but ACT scores roughly 2.2 to 2.7 points higher at the traditionally graded school. It is quasi-experimental rather than randomised, so it cannot show the grading caused the gap — two schools differ in countless ways — and the authors themselves limit the finding to the schools studied. It is one result, it points the other way, and it should be part of the conversation.

    Do you have to allow unlimited retakes?

    No, and Guskey argues that retake policy should not be written into the definition of standards-based grading at all — doing so adds confusion and can produce unreliable outcomes. Reassessment is a separate decision your school makes. What matters is that the rule is decided in advance and written down. “Unlimited” is not a policy, and the schools that have the worst time with this are the ones that never specified what a student has to do to earn another attempt.

    How do standards-based grades work for college applications?

    Most schools convert proficiency levels to a GPA for transcript purposes, and this is the question families will ask first, so have the answer ready before you start. Parent concern about college admission and scholarships is one of the documented sources of resistance and it is a reasonable concern rather than an obstructive one. If your school has not decided how conversion works, that decision needs making before the first report card goes out, not after.

    Will students stop doing homework if it is not graded?

    Some will, at first. Research describes an implementation dip where students, feeling less accountable early on, turn in fewer assignments and performance temporarily drops. The schools that handle this well expect it and plan for it; the ones that do not read it as proof the system failed and reverse in month three. Separating homework from the achievement grade does not mean homework stops mattering — it means it is reported as what it is, a work habit, rather than disguised as understanding.

    Can one teacher do this if the school does not?

    Partly. You can organise your own gradebook by standard, define proficiency levels, and separate achievement from work habits, and you will teach better for having done it. What you cannot do alone is change the report card or the transcript, so at some point your internal system has to convert to whatever your school reports. Be upfront with students about that conversion rather than letting them discover it in December.

    Where should a school start?

    With curriculum alignment, not the report card. Guskey is explicit about the order, and reversing it is one of the most common ways this fails — you end up with a new-looking form that nobody can complete consistently because the staff never agreed what the standards were. Get six to ten clear standards per course written in student-readable language first. Everything else follows from that list.

    Sources

    • Linka, L. J., & Guskey, T. R. (2022). Is standards-based grading effective? Theory Into Practice, 61(4). Full text (PDF) — the source for the three defining criteria, the conclusion that no evidence indicates SBG improves achievement, and the caution against writing retakes into the definition.
    • Townsley, M., & Varga, M. (2017). Getting high school students ready for college: A quantitative study of standards-based grading practices. Journal of Research in Education, 28(1), 93–112. Full text (PDF) — 327 students across two Midwestern high schools; no GPA difference, higher ACT scores at the traditionally graded school. Quasi-experimental; the authors limit the finding to the schools studied.
    • Marsh, V. L. (2023, November). Standards-based grading: History, practices, benefits, and challenges. Center for Urban Education Success, University of Rochester Warner School of Education. Read the brief (PDF) — the source for the benefits list, the four categories of challenge, the implementation dip, and the Kentucky Algebra 2 figure, which is reported in the brief rather than read here in the original.

    Every link above was checked on September 12, 2026. Where a finding is contested or comes from a single study, the text says so in the body rather than leaving it to a footnote.


    About Clay Shumate

    By Clay Shumate — Clay Shumate is a certified secondary Social Studies teacher in the public schools of West Alabama, now in his seventh year in the classroom, with a B.A. in History and an M.Ed. in Secondary Education. He writes about project-based learning, student responsibility, respect, and practical ways to hold young people to a higher standard while giving them room to learn from mistakes. He is a member of the Society of Professional Journalists and writes to its Code of Ethics; this site’s editorial standards and corrections policy are published in full.

Teacher Emergency Toolkit — practical resources, real classroom support. Shop on TPT.Teacher Emergency Toolkit — practical resources, real classroom support. Shop on TPT.