The Elevate Blog banner: Real Classrooms. Practical Ideas. Higher Expectations. Three students climb a rocky ridge at sunrise, each pulling the next one up, toward a teacher reaching down to help.

Tag: chronic absenteeism

  • Why Is Student Behavior Getting Worse? What the Data Actually Shows

    Why Is Student Behavior Getting Worse? What the Data Actually Shows

    By Clay Shumate

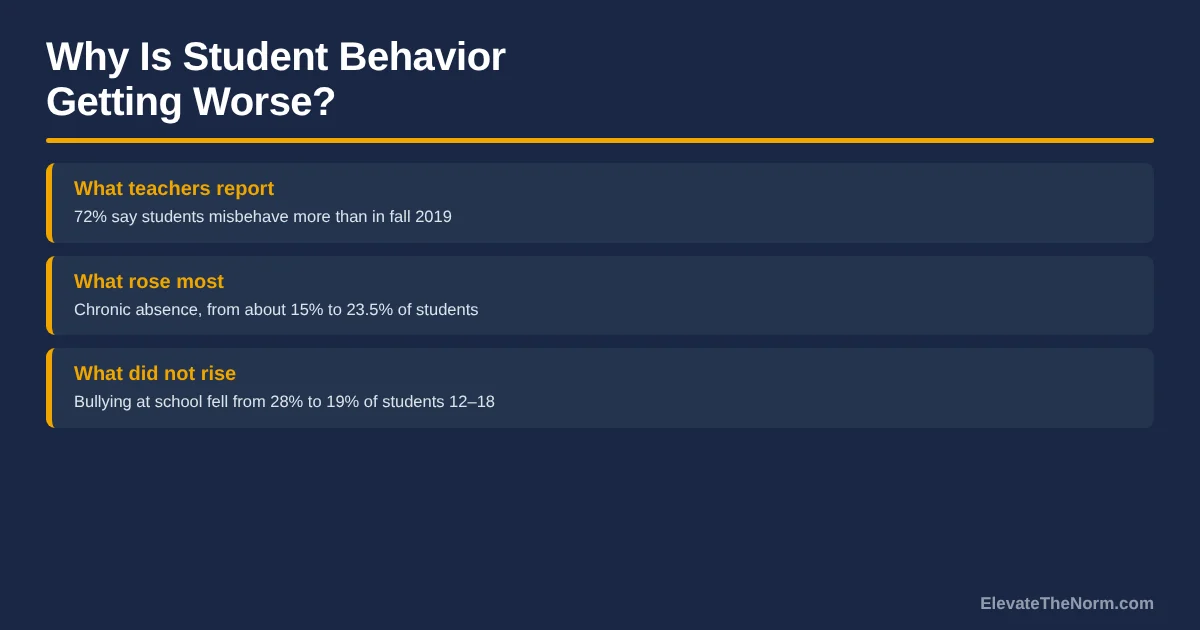
    Student behavior is getting worse in the sense that matters most to teachers — attention, attendance, and everyday disrespect — but not in the ways people usually mean. Serious violence and bullying are flat or down over a decade. What rose is low-level disruption, chronic absence, and the number of adults who feel the room has changed.

    Key Takeaways

    • In a December 2024 EdWeek Research Center survey of 990 educators, 72 percent said students were misbehaving more than in fall 2019, and that share has climbed every year since 2021.
    • Federal teacher surveys disagree: the share of public school teachers saying student misbehavior interfered with their teaching was 41 percent in 2011–12 and 43 percent in 2015–16, then fell to 32 percent in 2020–21 — a year with so much remote and hybrid instruction that the comparison is not clean.
    • Student-reported bullying at school dropped from 28 percent in 2010–11 to 19 percent in 2021–22, while the share of high schoolers who skipped school because they felt unsafe nearly doubled from 7 percent in 2013 to 13 percent in 2023.
    • Chronic absenteeism is the clearest measured worsening: roughly 15 percent of students before the pandemic, 28.5 percent in 2021–22, and still 23.5 percent in 2023–24 — about 57 percent above the pre-pandemic rate.
    • No national dataset establishes a cause. Anyone telling you with confidence that it is phones, or parents, or discipline reform, is giving you an opinion wearing a statistic’s coat.

    Ask a room full of teachers whether student behavior is getting worse and you will not get a debate. You will get stories. The phone that will not go away. The kid who walks out mid-sentence. The parent email that starts at a ten. Nobody in the building thinks this is the same job it was in 2019.

    Then you go look at the national numbers and they do not line up neatly with the stories. Some of them point the other way. That gap is worth understanding, because the version of this question you answer determines what you try to fix.

    This article is the evidence, honestly reported, including the parts that cut against the premise. If you want the practical side instead, start with prevention that happens before anything goes wrong or what to do with the students who take the most out of you.

    Why is student behavior getting worse, according to teachers?

    Teachers overwhelmingly report that behavior is worse than before 2020, and the share saying so keeps rising. In the EdWeek Research Center’s December 2024 survey of 990 educators, 72 percent said students misbehave more than they did in fall 2019 — 48 percent said a lot more. Only 9 percent said students misbehave less.

    What makes that finding hard to wave off is the direction of travel. The same organization asked a version of this question in 2021 and got 66 percent. In early 2023 it was 70 percent. By late 2024 it was 72 percent, and the share saying behavior was about the same as 2019 had fallen from 24 to 20 percent. If this were a pandemic shock wearing off, the line would be going the other way.

    It has not. In an EdWeek Research Center survey of more than 1,000 educators fielded between April and June 2026, student behavior was the single most commonly named challenge for the coming school year, at 75 percent — ahead of student engagement at 70 percent and well ahead of budget uncertainty at 42 percent. Half of respondents expected behavior to get worse again.

    Federal data on schools says something similar, in flatter language. The National Center for Education Statistics’ School Pulse Panel surveyed 1,714 public schools in May 2024. Eighty percent said the pandemic was still negatively affecting students’ behavioral development. Twenty-six percent said lack of focus or inattention was having a severe negative impact on learning — the single highest-rated problem on the list, above classroom disruption at 19 percent and academic unpreparedness at 21 percent. Thirty-six percent reported disrespect toward staff at least weekly.

    What does the data say that cuts against this?

    Several of the longest-running federal measures of student behavior show flat or improving trends, not worsening ones. That does not make teachers wrong. It means the thing teachers are describing is not the thing those surveys measure.

    Start with the measure closest to the claim. NCES asks public school teachers directly whether student misbehavior interfered with their teaching. In 2011–12, 41 percent said yes. In 2015–16, 43 percent. In 2020–21, 32 percent. By that measure, teacher-reported interference dropped by about a quarter.

    Before anyone uses that to tell teachers they are imagining things: 2020–21 was the year of remote and hybrid instruction. A teacher looking at a grid of muted squares is not managing a hallway. That reading is badly confounded, and a newer comparable figure is what the field actually needs. The honest statement is that the most direct federal trend line on this question ends at a year nobody can interpret cleanly.

    The student-reported measures are less ambiguous and still mixed. In the Department of Justice’s School Crime Supplement, the share of students ages 12 to 18 who said they were bullied at school fell from 28 percent in 2010–11 to 22 percent in 2018–19 to 19 percent in 2021–22. NCES cautions that the 2021–22 survey changed and that there was no consistent trend across the period, so do not treat that as a clean slope — but it is not a rise.

    The CDC’s Youth Risk Behavior Survey, which collected 20,103 usable questionnaires from high school students in 2023, tells the same split story. Being bullied at school went from 20 percent in 2013 to 19 percent in 2023, which CDC scores as a decrease overall — though it jumped from 15 percent in 2021 to 19 percent in 2023, which is the kind of two-year move that feels like a trend from inside a building. Meanwhile two things got clearly worse: being threatened or injured with a weapon on school property rose from 7 to 9 percent, and skipping school because of safety concerns rose from 7 to 13 percent.
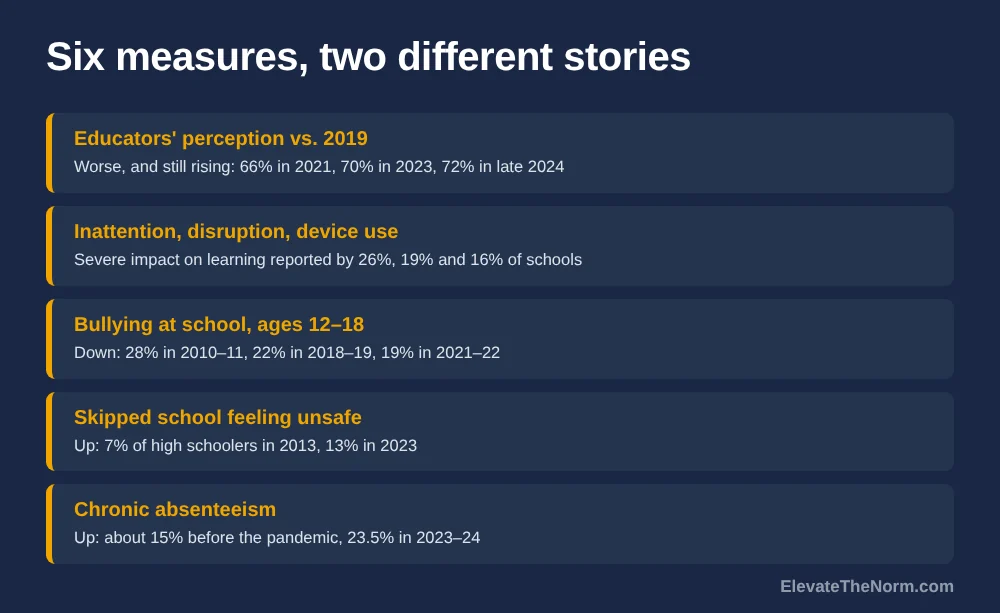
    Six measures of student behavior since 2019: educator perception rising from 66 to 72 percent, inattention disruption and device use rated severe by 26, 19 and 16 percent of schools, bullying falling from 28 to 19 percent, skipping school over safety rising from 7 to 13 percent, and chronic absenteeism rising from about 15 to 23.5 percent.
    The national measures disagree because they count different things.

    Why do teacher reports and student data disagree?

    They measure different things. The national surveys count discrete, nameable events — a fight, a bullying incident, a weapon. Teachers are describing the texture of a class period: attention that will not hold, work that does not get started, a reply that would have been unthinkable six years ago. None of that generates an incident report.

    That is why the School Pulse Panel finding is the most useful one in this whole article. The top-rated problem was not violence. It was inattention. The second was classroom disruption. Sixteen percent of schools said unpermitted device use was severely hurting learning. These are the low-floor, high-frequency behaviors that never show up in a crime statistic and consume an entire career’s worth of patience.

    What’s being measuredSourceDirectionWhat it actually tells a teacher
    Educators’ perception of misbehavior vs. 2019EdWeek Research Center, Dec 2024, 990 educatorsWorse, and still rising (66% → 70% → 72%)The adults in buildings are not adjusting to a new normal. They think it is still moving
    Teacher-reported interference with teachingNCES NTPS/SASS, 2011–12 to 2020–21Down, 41% → 43% → 32%Confounded by remote instruction; needs a post-2021 reading before anyone leans on it
    Inattention, disruption, device useNCES School Pulse Panel, May 2024, 1,714 schoolsSevere impact reported by 26% / 19% / 16%The real complaint, and the one no violence statistic captures
    Bullying at schoolDOJ School Crime Supplement, ages 12–18Down, 28% (2010–11) → 19% (2021–22)Schools got better at this. It is worth saying out loud
    Skipped school over safety fearsCDC YRBS, high school, 2013 vs 2023Up, 7% → 13%Students feel less safe even where incidents did not rise
    Chronic absenteeismAEI analysis of 44 states + DC, 2025Up, ~15% → 23.5%The clearest, largest, best-documented worsening on this list
    Six measures of student behavior since 2019, and what each one is actually about.

    What actually got measurably worse?

    Attendance. It is not close. Chronic absenteeism — missing at least 10 percent of the school year — sat at roughly 15 percent before the pandemic. It hit 28.5 percent in 2021–22, fell to 25.4 percent in 2022–23, and was still 23.5 percent in 2023–24 across the 44 states and the District of Columbia that reported. That is about 57 percent above the pre-pandemic rate, and the rate of improvement slowed in the most recent year.

    This belongs in a behavior article because it is upstream of most of what teachers are describing. A student who misses a day a week is behind, and a student who is behind has every reason to avoid the work, refuse the task, or get removed from the room instead of failing in front of people. If you only have the energy to fix one thing this year, what actually brings students back to class will buy you more than any behavior system will.

    The second clear worsening is the subjective one, and it is real even though it is a feeling: students are more likely to say they stayed home because they did not feel safe. Thirteen percent in 2023, against 7 percent in 2013. A school can have a falling incident rate and a rising fear rate at the same time, and the fear is its own problem.

    So what is causing it?

    Nobody knows, and that answer is more useful than a confident wrong one. None of the datasets above are designed to identify causes. They count things. Every causal story on offer right now is a hypothesis with some supporting correlation and no national test behind it.

    Here is what gets proposed, and what each claim is actually standing on.

    1. Missed social development during the shutdowns. The most widely held explanation, and the one schools themselves endorse: 80 percent of schools told the School Pulse Panel in May 2024 that the pandemic was still negatively affecting students’ behavioral development. That is a belief held by people in a position to know. It is not a measurement of the mechanism.
    2. Phones and screens. Sixteen percent of schools called unpermitted device use a severe drag on learning, and inattention topped the list. That is consistent with a phone story and also consistent with several others. The honest treatment of the evidence here is in our piece on cell phones in the classroom, which does not claim more than the studies support.
    3. Parents. Educators increasingly name this one, and in an EdWeek Research Center survey of more than 5,800 teachers fielded between August and November 2025, 58 percent said more guidance from parents on behavior would help — the most-chosen answer. Worth noting what that is: teachers’ judgment about what would help, not evidence that parenting changed.
    4. Discipline reform. Commonly blamed, rarely evidenced in the direction claimed. Suspension rates fell in many districts over the same period that bullying fell and absenteeism rose, which is not a pattern that picks a side. Our review of what the restorative practices research actually shows includes the findings that do not flatter it — including that half-implemented programs are barely distinguishable from no program at all.
    5. Staffing and instability. Sixty-one percent of schools told NCES in 2024 they needed more classroom-management training, up from 50 percent two years earlier. A building with more new teachers has more rooms where behavior is being learned on the job. Among teachers with three or fewer years of experience, 36 percent reported misbehavior interfering with teaching, against 30 percent of those with 20 or more years.

    Most likely all five are doing some work and the mix differs by building. What should make you suspicious is any version of this argument that explains everything and predicts nothing.
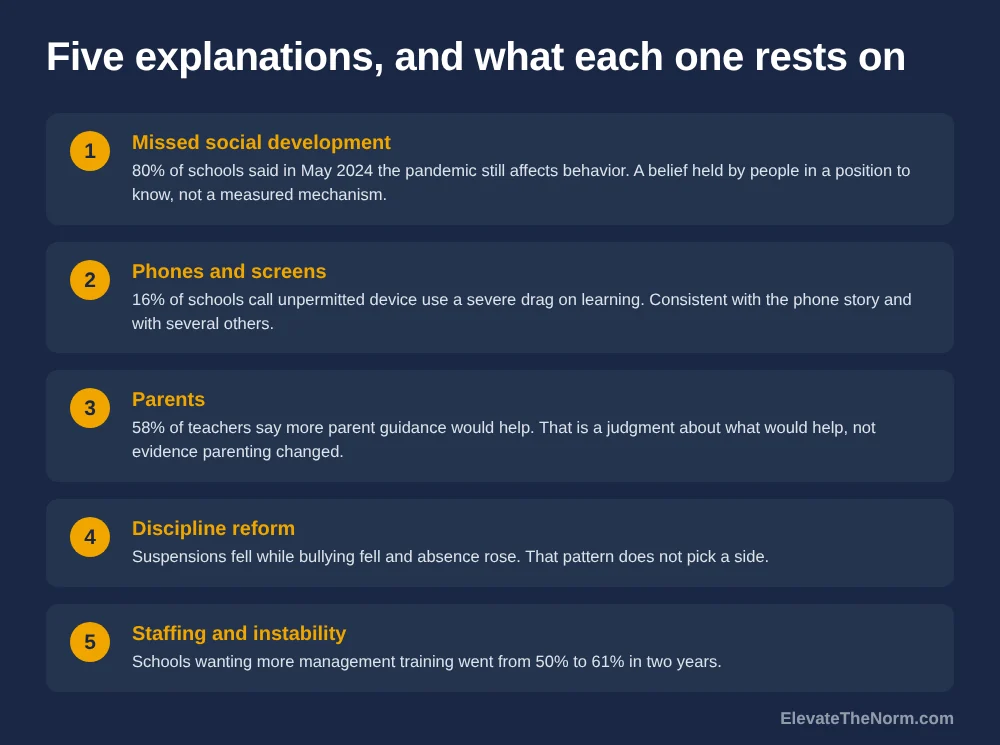
    Five proposed explanations for worsening student behavior and the evidence each rests on: missed social development, phones and screens, parents, discipline reform, and staffing instability.
    Each common explanation, and what evidence it actually rests on.

    Is it worse in some schools than others?

    Yes, and the pattern is the one you would guess. Districts serving more disadvantaged students had higher absenteeism both before and after the pandemic, according to the AEI analysis. The relative increase was similar across district types, though — meaning the shock hit everybody and landed on top of an existing gap. In the federal teacher data, 36 percent of teachers in city schools reported misbehavior interfering with teaching, against 29 to 33 percent elsewhere.

    Two things follow from that, and they pull in opposite directions. A district average hides a lot; the building with the worst numbers needs a different response from the building at the mean, and a single district-wide behavior initiative will be over-built for one and under-built for the other. But a gap in a behavior statistic is not a statement about the students in the higher-number building. It describes attendance, staffing stability, and how many first-year teachers are learning to run a room in September — all of which are distributed unevenly on purpose.

    One more caution on the numbers in this article, because it matters for a grades 6–12 reader. The School Pulse Panel and the federal teacher surveys cover K–12 and report elementary, middle and high schools together unless broken out. The CDC survey is high school only, and the School Crime Supplement covers ages 12 to 18. Where a figure is specific to secondary students, this article says so; where it is a K–12 average, treat it as the direction rather than your number.

    What can one teacher actually do about it?

    Stop trying to solve a national trend inside a 50-minute period, and spend the effort on the three or four things that are genuinely inside your control. None of this is new. It is just more load-bearing than it used to be.

    1. Fight for attendance before you fight for compliance. The student in the seat can be redirected. The student who is not there cannot. Track who is drifting toward a day a week and intervene while it is still three absences, not thirteen.
    2. Design the period so inattention has nowhere to sit. Inattention is the top-rated problem in the federal data, and it grows in the gaps — the dead four minutes at the start, the ten minutes after the work is finished. Routines and procedures are an attention strategy before they are a discipline strategy.
    3. Handle disrespect privately and immediately. Thirty-six percent of schools report disrespect toward staff weekly. Handled in front of an audience it becomes a contest the student cannot afford to lose. Handled quietly, at the desk or at the door, it is usually over in thirty seconds.
    4. Keep the consequence proportional and keep the kid in the room. Removal that buys escape from work rewards the behavior it is meant to punish. Consequences that teach rather than humiliate are harder to run and they do not hand the student a reason to come back angrier.
    5. Do what you said you would do, every single time. This is the whole thing. Teenagers calibrate on follow-through, not on tone. A teacher whose stated consequence arrives on schedule has a quieter room than a teacher with a louder voice and a flexible memory.

    How would you know any of this is working?

    Pick measures you can actually read in four weeks, not a climate survey in May. Five that a single teacher can track without extra software:

    • Minutes to full start. Time from the bell to the point where everyone is working. If that number falls, inattention is losing ground. If it holds at six minutes, nothing else you changed matters much yet.
    • Attendance for your five most-absent students. Not the class average, which hides them. Five names, days present per week, updated Friday.
    • Referrals by type, not count. Split them into disruption, disrespect, and safety. A falling total that is all one category is a different story from a falling total across the board.
    • Work started versus work finished. If most of your incompletes are never-started rather than half-done, the problem is entry into the task, not stamina.
    • Repeat names. If the same four students account for most of what you log, you have four plans to make, not a class-wide culture problem.
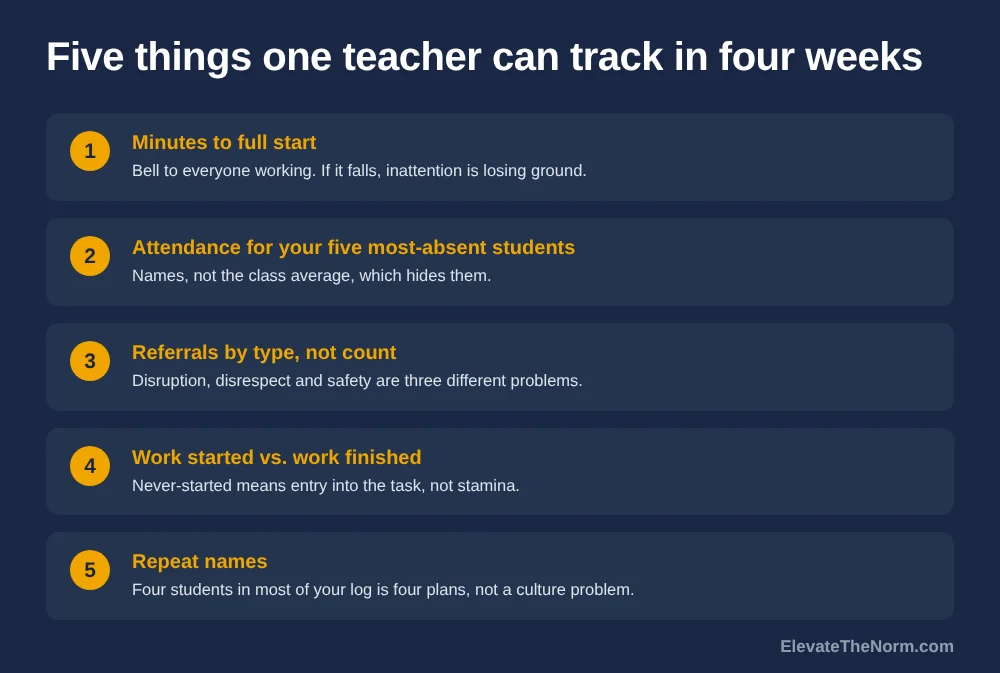
    Five things a single teacher can track in four weeks: minutes to full start, attendance for the five most-absent students, referrals by type rather than count, work started versus finished, and repeat names.
    Five measures a single teacher can read in four weeks.

    And one thing worth telling families straight when they ask whether behavior has gotten worse: the honest answer is that attendance and attention have, that serious incidents mostly have not, and that the school is working on the first two. Over-claiming a crisis makes parents more anxious than the data supports. Denying the change makes teachers feel unheard. Neither helps.

    What should a school do instead of a crackdown?

    Pick one measurable problem and resource it properly, rather than launching a program on every problem at once. The evidence that half-implemented behavior initiatives barely outperform doing nothing is the most consistent finding in this literature, and most buildings are running three of them.

    Two candidates stand out from the data in this article. Attendance, because the gap between 15 percent and 23.5 percent is the largest documented change and it feeds everything downstream. And classroom-management support for early-career teachers, because schools themselves asked for it — the share wanting more training jumped from 50 to 61 percent in two years — and because the experience gradient in the federal data is real.

    What the data does not support is a tougher-consequences push sold as evidence-based. Fifty percent of teachers in the 2025 EdWeek survey said tougher consequences would help, and that is a legitimate thing for a profession to ask for. It is not the same as a study showing it works.

    Clay’s take: the question is wrong, and it costs us

    “Is student behavior getting worse” is a question about teenagers. Almost everything actionable in the data above is a question about adults instead. Specifically, about whether students came to school, whether anybody noticed when they stopped, whether the new teacher in room 12 ever got taught how to run a room, whether the period had dead space in it.

    I do not think a kid can wreck a class period that badly on their own. If it happened, something upstream was already broken, and the student is the place it finally showed. That is not an excuse for the behavior and it does not mean the consequence goes away. It means the consequence is the smallest part of the fix.

    The other thing worth saying plainly: students who are poorer or further behind are not a different species with different needs. They need the same clarity, the same follow-through, and the same assumption of competence — and the research on what high expectations actually are is a lot more modest than the posters suggest. Treat the behavior data as information about your building’s systems. It is a poor description of the kids.

    What should you do next?

    Pull your own numbers before you accept anyone else’s narrative. Count how many of your students missed ten percent of the days so far this semester. Count how many of your referrals last month were inattention and low-level disruption rather than anything that would appear in a safety report. If your building looks like the national data, the first number will be larger than you expect and the second will be most of the list.

    Then fix the period before you fix the policy. Start with the prevention side of classroom management, and if attendance is where your numbers are worst, go straight to the absenteeism piece.

    Frequently Asked Questions

    Is student behavior actually getting worse, or does it just feel that way?

    Both, depending on which behavior. Educators report worsening consistently and the share saying so has risen every year since 2021, reaching 72 percent in a December 2024 EdWeek Research Center survey. But long-running student-reported measures of bullying and violence are flat or down over a decade. The honest answer is that low-level disruption, inattention and absence got worse while serious incidents did not.

    What is the single biggest measured change in student behavior since 2019?

    Chronic absenteeism. It ran around 15 percent of students before the pandemic, peaked at 28.5 percent in 2021-22, and was still 23.5 percent in 2023-24 across 44 states and the District of Columbia. That is roughly 57 percent above the pre-pandemic rate, and the pace of improvement slowed in the most recent year of data.

    Do phones explain the rise in classroom disruption?

    Phones are a plausible contributor, not a proven cause. In May 2024, 16 percent of public schools told federal surveyors that unpermitted device use was severely hurting learning, and inattention was the top-rated problem at 26 percent. Those figures are consistent with a phone explanation and also with several others. No national dataset isolates the effect.

    Why does federal data show teacher-reported misbehavior going down?

    Because the most recent federal reading is from 2020-21, a year of widespread remote and hybrid instruction. Teachers reported misbehavior interfering with their teaching at 41 percent in 2011-12 and 43 percent in 2015-16, then 32 percent in 2020-21. A drop measured during school closures is not evidence that classrooms improved, and a newer comparable figure is what the field needs.

    Is middle school or high school worse for behavior?

    Middle school, by the federal numbers, though the gap is not huge. In 2020-21, 37 percent of middle school teachers said misbehavior interfered with teaching, against 27 percent of high school teachers. High school leads on a different measure: 45 percent of high school teachers said tardiness and class cutting interfered, against 34 percent in middle school.

    Would tougher consequences fix this?

    There is no national evidence that they would, though half of teachers surveyed in 2025 said they would help. Tougher consequences are a reasonable professional request and a poor evidence claim. What the data does support is boring: better attendance, fewer dead minutes in a period, and real classroom-management training for early-career teachers.

    Are students less safe at school than they used to be?

    Reported incidents mostly say no; students’ own sense of safety says yes. Bullying at school fell from 28 percent of students ages 12-18 in 2010-11 to 19 percent in 2021-22. Over roughly the same period, the share of high schoolers who skipped school because they felt unsafe rose from 7 percent in 2013 to 13 percent in 2023.

    Sources

    About Clay Shumate

    Clay Shumate is a certified secondary Social Studies teacher in the public schools of West Alabama, with seven years of classroom experience, a B.A. in History, and an M.Ed. in Secondary Education. He writes about project-based learning, student responsibility, respect, and practical ways to hold young people to a higher standard while giving them room to learn from mistakes. He is a member of the Society of Professional Journalists and writes to its Code of Ethics; this site’s editorial standards and corrections policy are published in full. More about Clay.

  • Chronic Absenteeism: What Actually Brings Students Back to Class

    Chronic Absenteeism: What Actually Brings Students Back to Class

    By Clay Shumate

    Chronic absenteeism means missing 10 percent or more of the school year — about eighteen days, excused and unexcused combined — and it’s sitting near a quarter of all U.S. students. Most of that isn’t about your lesson plans: illness and lost sleep outrank boredom by a wide margin. But re-entry, what happens the day a student walks back in, is squarely a teacher’s job, and most classrooms have no plan for it at all.

    Key Takeaways

    • Chronic absenteeism counts a student missing 10 percent or more of enrolled school days, excused and unexcused together — it is not the same thing as truancy, which is specifically about unexcused absences and can trigger legal consequences for a family.
    • The national rate peaked near 28.5 percent in 2022, fell to roughly 23.5–25 percent by 2024, and has stalled — the decline slowed enough in 2024 that a full return to the 15 percent pre-pandemic baseline is no longer guaranteed.
    • When students are asked directly why they missed school, illness and lack of sleep dominate the answers. Boredom and disengagement are real but smaller, and high schoolers actually report fewer disengagement reasons after the pandemic than before.
    • Attendance Works sorts causes into four categories — barriers, aversion, disengagement, and misconceptions — and a classroom teacher has real leverage over only two of them.
    • The best-evidenced classroom-adjacent lever isn’t a lesson plan; it’s what happens on re-entry day, and separately, honest and consistent family communication is one of the few things correlated with meaningfully lower rates.

    What Chronic Absenteeism Actually Means

    Chronic absenteeism is a student missing 10 percent or more of enrolled school days in a year — roughly eighteen days in a standard 180-day calendar, or about two days a month. Every state and most districts now track it because it correlates with weaker outcomes at every level, from third-grade reading to ninth-grade credit accumulation to graduation. The count includes excused and unexcused absences together. A student out with the flu for two weeks, a student with a broken attendance streak from oversleeping, and a student who simply stopped coming all land in the same statistic, and the number alone tells you nothing about which one you’re looking at.

    That combined counting is also what separates chronic absenteeism from truancy, and the two get confused constantly in casual conversation. Truancy is specifically about unexcused absences, and in most states it is a legal category with a defined escalation path — a set number of unexcused absences triggers truant status, repeated truancy can trigger a referral, and in the most severe cases a district attorney can pursue charges against a parent or guardian. Chronic absenteeism carries no such court process on its own. A student who is chronically absent because of documented illness has never been truant a single day. Confusing the two terms is how a school ends up applying a punitive, legal-track response to a problem that is, for most students, not a compliance problem at all.

    How Bad Is It, and Is It Getting Better?

    Nationally, chronic absenteeism held steady around 15 percent through the 2018 and 2019 school years. It jumped to roughly 28.5 percent at its 2022 peak, then eased to about 25.4 percent in 2023 and 23.5 percent in 2024. RAND’s 2024–25 district survey put the most recent figure at approximately 22 percent — nearly 11 million students. The trend line is real improvement, and it is also slowing down. Nat Malkus, who tracks the numbers for the American Enterprise Institute, has written plainly that the deceleration raises “the very real possibility that absenteeism rates might never return to pre-pandemic levels.”

    The average also hides where the actual crisis sits. Low-achieving districts went from about 19 percent chronically absent in 2018 to 35 percent in 2022; high-achieving districts moved from 10 percent to 19 percent over the same stretch — both got worse, but the gap between them widened. RAND found urban districts were five to six times more likely than rural or suburban ones to report extreme chronic absence, meaning 30 percent of students or more. If your school sits in that first group, the national “one in four” statistic is understating your actual room by a wide margin.

    The Four Root Causes — and Which Ones Are Actually Yours

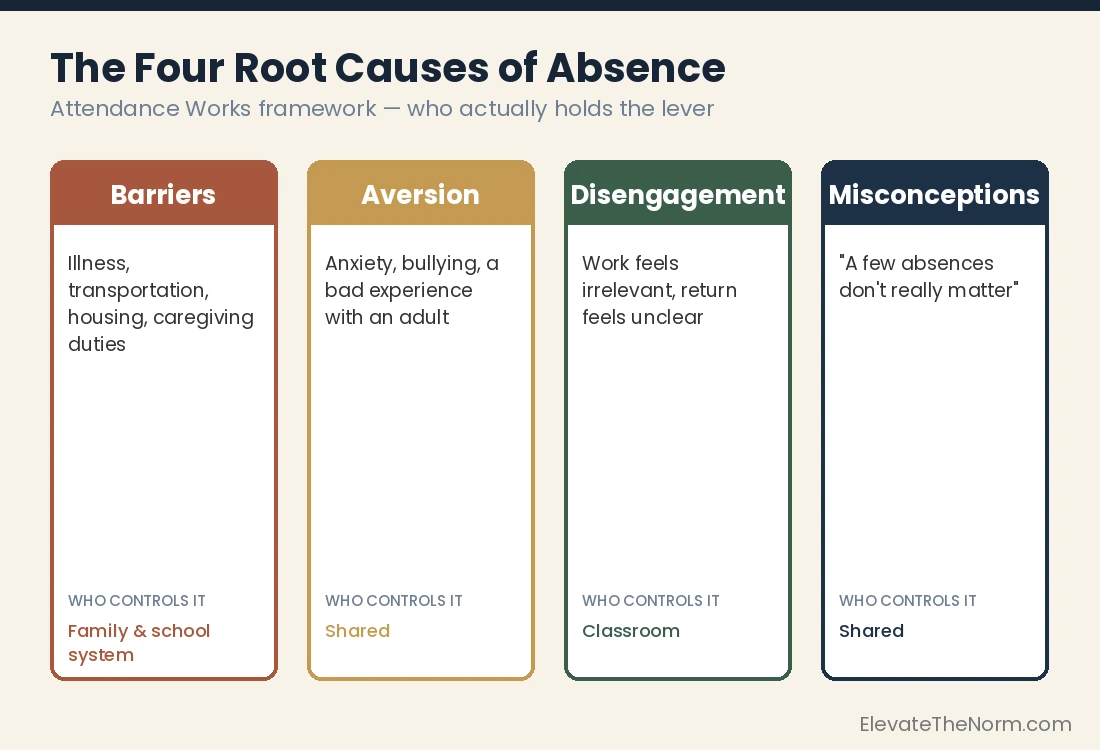
    Attendance Works, the research and policy organization most state departments of education cite on this topic, sorts every reason a student misses school into four categories: barriers, aversion, disengagement, and misconceptions about how much a few absences really matter. It’s a useful framework precisely because it forces an honest answer to the question every overwhelmed teacher eventually asks: which part of this is mine to fix?

    CategoryWhat it looks likeWho actually controls it
    BarriersIllness, unreliable transportation, unstable housing, caregiving duties for a sibling or family memberFamily, school system, community resources — not the classroom teacher
    AversionAnxiety about a specific class or hallway, bullying, a bad experience with a particular adultShared — a teacher can remove one specific aversion, but not the underlying anxiety
    DisengagementThe student sees no point in showing up because the work feels irrelevant or the return is unclearLargely the classroom — relevance, relationship, and clarity are teacher-level moves
    MisconceptionsBelief that a handful of absences “doesn’t really matter” as long as grades hold upShared — a teacher’s re-entry practice and a family’s messaging both shape this
    Four-category chart showing the root causes of chronic absenteeism: barriers, aversion, disengagement, and misconceptions, with who controls each one
    The Attendance Works framework for chronic absenteeism, showing which causes a classroom teacher can actually influence.

    Look at that middle column honestly and the division of labor gets clear fast. Barriers are not solvable from a classroom. No lesson plan fixes a broken car, an undiagnosed illness, or a kid watching a younger sibling because there’s nobody else. Pretending otherwise is how teachers end up carrying blame for outcomes they were never equipped to move, and it’s a big part of why attendance initiatives that live entirely inside individual classrooms tend to disappoint — they’re aimed at maybe half the problem.

    Why Most of It Isn’t About Your Classroom

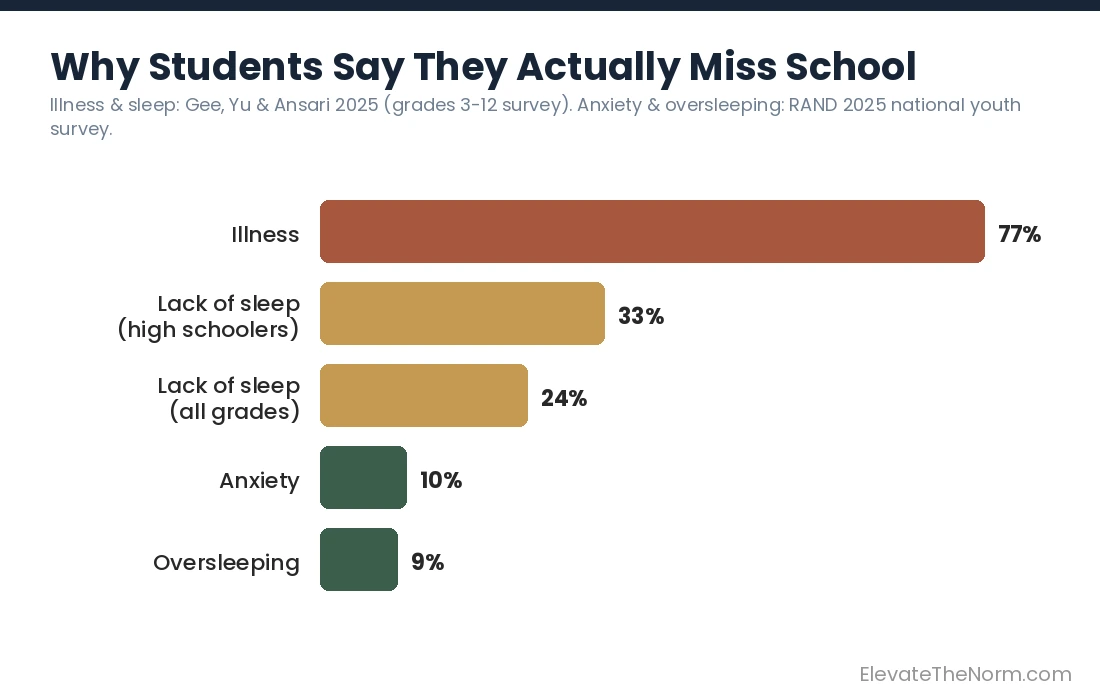
    When you ask students directly why they missed school, the answer that comes back most is not the one teacher-facing advice usually assumes. A 2025 analysis of Rhode Island survey data covering grades 3–12 found illness reported by roughly three-quarters of students both before and after the pandemic — 77 percent post-pandemic specifically. Lack of sleep came in second at 24 percent overall and a striking 33 percent among high schoolers. Boredom and safety concerns did rise after the pandemic, but from a much smaller base, and — this is the finding that should reshape how engagement gets talked about — high school students actually reported fewer disengagement reasons after the pandemic than before it. RAND’s national youth survey landed in the same place: 67 percent sickness, 10 percent anxiety, 9 percent oversleeping.

    Bar chart showing self-reported reasons students miss school: illness 77 percent, lack of sleep 33 percent among high schoolers and 24 percent overall, anxiety 10 percent, oversleeping 9 percent
    Illness and lost sleep outrank boredom by a wide margin in student-reported reasons for absence.

    That doesn’t mean engagement is irrelevant. It means engagement is not the lever most teacher-facing advice on this topic claims it is. If a school’s entire absenteeism strategy is “make class more interesting,” it is aimed at a real but minority slice of the problem, and it will underdeliver — not because the advice is wrong, but because it was never sized to the actual distribution of causes. For the students where disengagement genuinely is the driver, the deeper diagnosis and fix belong in a companion piece on what actually motivates students once rewards and speeches stop working — this page is about the much larger group whose absence has nothing to do with motivation at all.

    What’s Actually Yours: The Four Minutes That Change the Semester

    Here’s the honest, narrower claim. A classroom teacher cannot fix a transportation gap or an untreated illness. What a classroom teacher controls almost completely is what an absence costs a student once they’re back — and that cost is what determines whether eighteen missed days becomes thirty.

    I check the roster before the bell, not after. When I see a student has been out, I already know before they walk through the door — deciding what they need in the doorway, with the rest of the class watching, guarantees a bad decision made badly. If it’s a longer absence, that student gets pulled to the whiteboard table early — the same table I use for regular small-group work, not a separate “catch-up corner.” Low lamp, rug, better chairs. Students already know that table is where you go to be worked with, not managed. That matters more than it sounds like it should: a student coming back from eighteen missed days is highly sensitive to whether re-entry feels like punishment or like being picked back up.

    Reserve the full version of this for absences that actually need it — three or more days, or a pattern, not a single day for a dentist appointment. And none of what follows replaces your school’s required attendance reporting or truancy referral process. If a student’s pattern of absence raises a safety concern — signs of neglect, abuse, homelessness, or anything that meets your district’s mandated-reporting threshold — that goes to your counselor or administrator through the normal protocol immediately, separate from and before any classroom routine. Re-entry is about what a teacher does with the students in front of them; it is not a substitute for the systems built to catch the more serious cases.

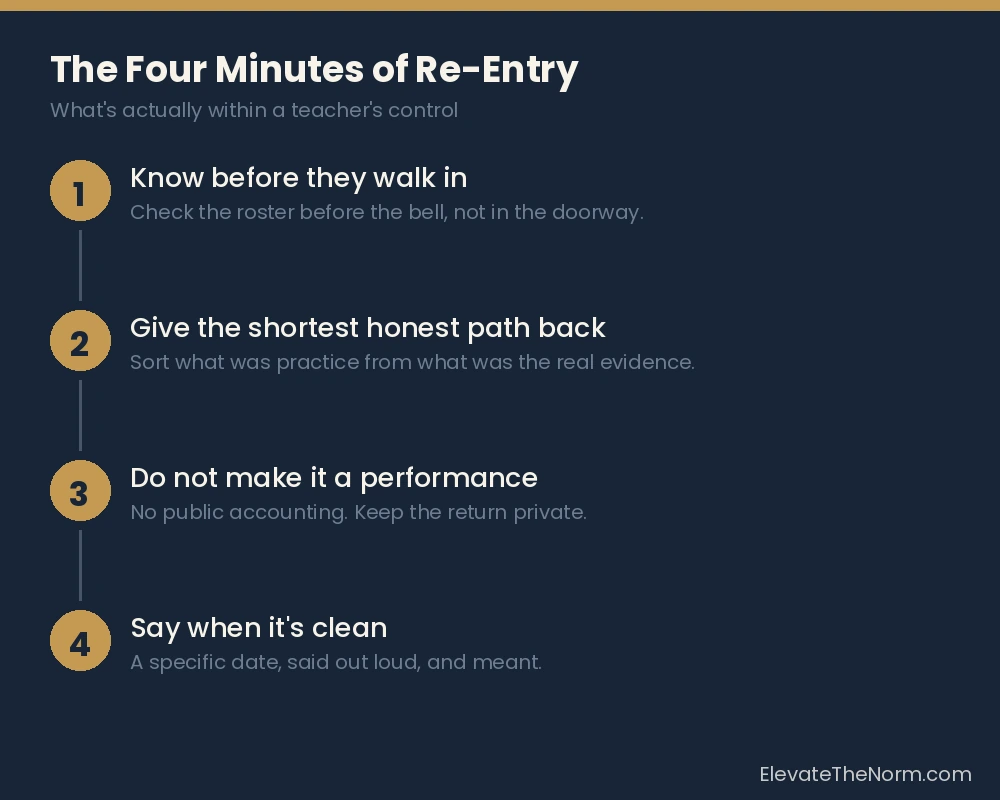
    Four things make re-entry actually work.

    Know before they walk in. Check attendance history before class starts, not during it. A decision made in the doorway, in front of an audience, by a teacher who is also trying to start the lesson, is reliably the worst version of that decision.

    Give the shortest honest path back. Not every missed assignment carries the same weight. Ask yourself which pieces were practice and which ones were the actual evidence that the student learned the standard — the practice can often be waived or condensed; the evidence usually can’t. Sorting the pile down to what genuinely matters is a judgment call only the teacher can make, and it’s the difference between a student who can start today and a student who takes one look at forty backlogged items and shuts down. Better still, ask the student what they think is realistic before you hand them the final list — a plan a student helped build survives contact with a hard week better than one that was simply issued to them. This is student responsibility in its most practical form — the student still owns finishing the list, but the list has to be one a person could actually finish, and building it together is what makes it theirs. For an absence stretching past a week or two, or anything with a doctor’s note attached, loop in a counselor or your 504/IEP team before you finalize the plan alone — some of that catch-up may need to be a formal accommodation, not an informal favor.

    Do not make the return a performance. No public accounting of the absence, no comment in front of the class, no sarcasm at the door, and no requirement that the student explain themselves out loud. Some reasons are private — a medical diagnosis, a family situation, a mental health day — and a teacher doesn’t need the full story to run a fair re-entry process. A teenager who’s been gone is already running the social math on what walking back in will cost. Raise that cost and the cheapest option left is to stay gone. This is the same standard covered in respect in the classroom applied to a specific moment: a student’s absence is not public material, and treating it that way trades a little teacher satisfaction for a much worse attendance problem next month. Apply it the same way to every student, every time — the fastest way to make a re-entry routine feel arbitrary is to run it warmly for some students and coldly for others.

    Say when it’s clean. Give a specific date and a specific list, and when the list is finished, say so out loud and mean it. Open-ended debt is what convinces a student the hole is unclimbable. A defined end is what makes climbing rational.

    In practice this is a thirty-second exchange, not a meeting: “Good to see you back. Here’s what actually matters from the last few days — these three things. Everything else, let it go. Can you have these done by Friday?” That’s the whole script. It names what matters, drops what doesn’t, and ends with a date the student agreed to rather than one you handed down.

    Four-step checklist for helping a student return after an absence: know before they walk in, give the shortest honest path back, do not make it a performance, and say when it is clean
    The four re-entry moves that are genuinely within a classroom teacher’s control after chronic absenteeism.

    None of this is softness. The standard doesn’t move — the work still has to be real and the deadline still has to be a deadline. What moves is how much guesswork a student has to do to find their way back to it, and guesswork is where students who are already behind quietly give up. This is the same logic behind natural consequences instead of punishment: the goal is a consequence that teaches something, not one that simply makes the return more painful.

    Expect it to look worse before it looks better, especially with a student who’s been checked out for a while. A kid who suddenly gets real attention after being invisible will often test whether that attention is real — that’s a normal, predictable phase, not proof the approach isn’t working, and it connects directly to what happens the first few weeks after building a relationship with a student who’s been guarded. Most adults quit right at the point where the testing is actually a good sign.

    What the Research Says Works Beyond Your Classroom

    Honesty about the ceiling matters here too. The best-evidenced attendance interventions in the research aren’t classroom practices — they’re family communication, and the effect sizes are real but modest. Which tool carries that communication matters less than whether families can actually receive it — the questions to ask before adopting a communication app start with reach, not features.

    Rogers and Feller, publishing in Nature Human Behaviour in 2018, tested personalized mailings sent to the parents of 28,080 high-risk K–12 students. The most effective versions reduced chronic absenteeism by 10 percent or more, largely by correcting parents’ underestimates of how many days their child had actually missed — many parents simply didn’t know the number was as high as it was. A smaller trial run by the Regional Educational Laboratory Mid-Atlantic in the School District of Philadelphia found a single October postcard cut absences by a more modest 2.4 percent, with no measurable difference between message variations.

    A 2023 analysis by Harvard researchers Karen Mapp and Todd Rogers, working with Learning Heroes and TNTP across more than 3,000 Illinois schools, found something adjacent and worth taking seriously: schools with strong pre-pandemic family engagement — measured through trust, involvement, and parent influence on school decisions — had chronic absenteeism rates roughly six percentage points lower than similar schools with weak engagement, even after controlling for poverty. Between 2019 and 2022, the strong-engagement schools saw a 39 percent smaller increase in chronic absenteeism than everyone else. This is a correlational finding from one state, not a randomized trial, and the researchers themselves describe it as the first phase of a larger project — it should be read as suggestive, not proof that family engagement alone moves the number. But it lines up with the honest re-entry advice above: families who already trust the school and understand what the classroom is doing are the same families likely to reinforce a re-entry plan rather than fight it. In practice that trust gets built with plain, non-alarmist language rather than a form letter — something closer to “I noticed six absences this month, is there anything the school can help with?” than an automated warning that reads like a legal notice. The first invites a conversation. The second reads like the truancy-court track discussed above, even for a family whose child has never come close to it.

    None of this reaches a transportation gap, an untreated health condition, or a family in crisis, and no classroom teacher should feel responsible for the part of the number that genuinely isn’t theirs. What is genuinely theirs — re-entry, and a habit of honest, non-alarmist communication home — is smaller than the whole problem and still worth doing well, because it’s the piece within reach on a Tuesday afternoon, not a district initiative that takes a year to fund.

    What to Do With This on Monday

    Start with one thing: check the roster before the bell and know, before a returning student walks in, what the shortest honest path back looks like for them. Add the no-performance rule next — it costs nothing and it’s the fastest way to stop making re-entry harder than it needs to be. Everything else on this page — the barriers your school actually controls, the family-communication research, the honest accounting of what disengagement is and isn’t driving — belongs to a bigger conversation about chronic absenteeism than one classroom can solve alone. Your four minutes with a returning student is the part that starts today. For a ready-to-use tool on this, see a printable parent-teacher communication log pack. Absence is also the clearest single thing that got worse since 2019, which is why it sits near the top of our review of whether student behavior is actually getting worse.


    Is chronic absenteeism the same thing as truancy?

    No. Chronic absenteeism counts a student missing 10 percent or more of enrolled school days, whether the absences are excused or unexcused. Truancy is a narrower legal category built specifically from unexcused absences, and in most states it comes with a defined escalation process that can eventually involve a district attorney and consequences for a parent or guardian. A student who is chronically absent because of documented illness has never been truant. Treating the two as interchangeable is how schools end up applying a legal, punitive response to a problem that, for most students, was never about defiance.

    Whose fault is chronic absenteeism — the school, the family, or the student?

    Usually none of the above, at least not in the way the question assumes. National survey data shows the leading reasons students miss school are illness and lost sleep, not defiance or indifference. Framing absence as a fault to assign tends to produce blame instead of a fix. The more useful question is which piece of the problem a given adult actually has leverage over — a classroom teacher, a family, and a school system each control a different slice.

    What can one classroom teacher realistically do about chronic absenteeism?

    Less than district-level interventions, and that’s fine — a teacher’s real leverage is re-entry, not prevention. Checking the roster before class, sorting missed work down to what actually matters, keeping a returning student’s absence private, and giving a clear date when the catch-up is finished are all inside a single teacher’s control and take a few minutes per student. Preventing the absence in the first place usually depends on factors — transportation, health, housing — that sit outside any one classroom.

    Does missing school always mean a student doesn’t care about class?

    No, and the data says the opposite more often than not. When students are asked directly why they were out, illness and lack of sleep dominate the answers, and one national analysis found high schoolers reporting fewer disengagement-related reasons for absence after the pandemic than before it. Assuming apathy is usually wrong, and assuming it out loud to a student who was actually sick or exhausted damages the relationship for no reason.

    How should a teacher handle makeup work without overwhelming a student who’s behind?

    Sort before you hand anything over. Separate what was practice from what was the actual evidence that a student learned the standard, and let most of the practice go. Ask the student what they think is realistic before finalizing the list — a plan they helped build holds up better than one that was simply issued. For anything longer than a week or two, or work tied to a documented medical absence, loop in a counselor or the student’s 504/IEP team rather than solving it alone.

    What if a student’s pattern of absences seems like a sign of something more serious?

    That goes to your school’s counselor or administrator through your normal mandated-reporting and attendance-review process immediately — before, and separate from, any classroom re-entry routine. Signs like a sudden pattern change, indications of neglect or abuse, or signs of homelessness are outside what a classroom-level practice is built to address, and they need the systems your school already has for exactly that purpose.

    Do attendance letters or family outreach actually reduce absences?

    Some forms do, modestly. A large study of personalized parent mailings correcting misperceptions about how many days a child had actually missed reduced chronic absenteeism by roughly 10 percent in its most effective version; a simpler single postcard trial produced a smaller 2.4 percent reduction. The tone matters — plain, non-alarmist language that reads like a conversation (‘is there anything the school can help with?’) is associated with better outcomes than a form letter that reads like a legal warning, even though neither approach comes close to solving the problem on its own.

    What’s a realistic first step for a teacher who wants to get better at this?

    Start with one habit: check attendance before the bell so you already know, before a student walks in, what their shortest honest path back looks like. Add the no-performance rule next — keeping the return private costs nothing and prevents the single most common way teachers accidentally make attendance worse. Everything else on this page is worth knowing, but those two moves are where an ordinary Tuesday actually changes.


    Sources


    About Clay Shumate

    Clay Shumate is a certified secondary Social Studies teacher in the public schools of West Alabama, with seven years of classroom experience, a B.A. in History, and an M.Ed. in Secondary Education. He writes about project-based learning, student responsibility, respect, and practical ways to hold young people to a higher standard while giving them room to learn from mistakes. He is a member of the Society of Professional Journalists and writes to its Code of Ethics; this site’s editorial standards and corrections policy are published in full. More about Clay.

Teacher Emergency Toolkit — practical resources, real classroom support. Shop on TPT.Teacher Emergency Toolkit — practical resources, real classroom support. Shop on TPT.