By Clay Shumate
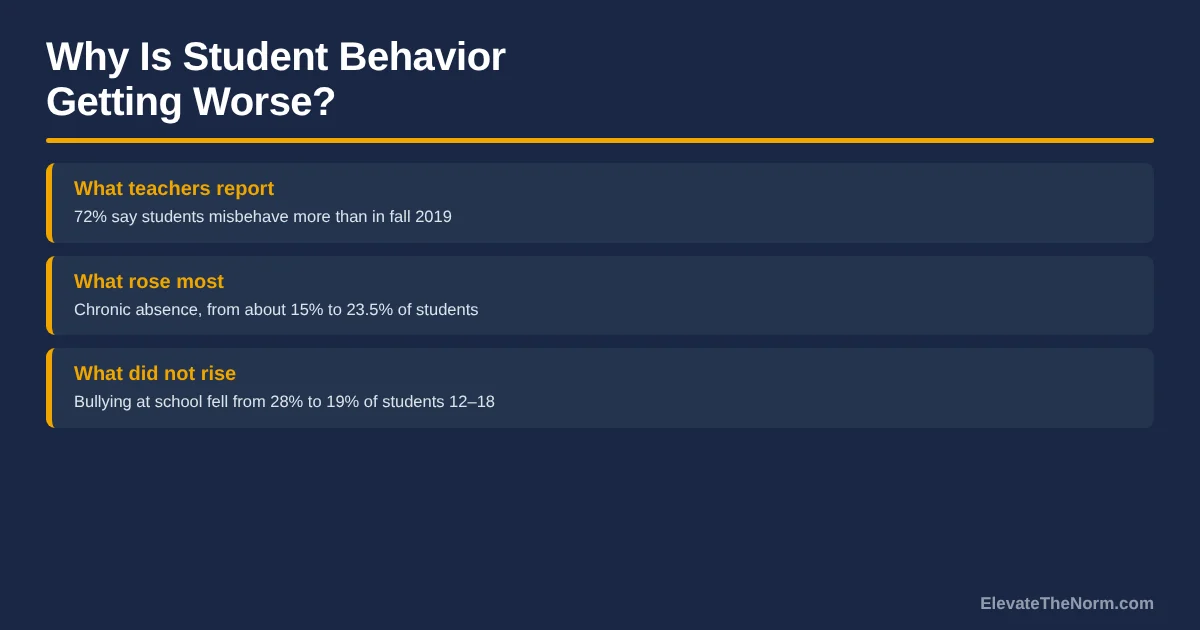
Student behavior is getting worse in the sense that matters most to teachers — attention, attendance, and everyday disrespect — but not in the ways people usually mean. Serious violence and bullying are flat or down over a decade. What rose is low-level disruption, chronic absence, and the number of adults who feel the room has changed.
Key Takeaways
- In a December 2024 EdWeek Research Center survey of 990 educators, 72 percent said students were misbehaving more than in fall 2019, and that share has climbed every year since 2021.
- Federal teacher surveys disagree: the share of public school teachers saying student misbehavior interfered with their teaching was 41 percent in 2011–12 and 43 percent in 2015–16, then fell to 32 percent in 2020–21 — a year with so much remote and hybrid instruction that the comparison is not clean.
- Student-reported bullying at school dropped from 28 percent in 2010–11 to 19 percent in 2021–22, while the share of high schoolers who skipped school because they felt unsafe nearly doubled from 7 percent in 2013 to 13 percent in 2023.
- Chronic absenteeism is the clearest measured worsening: roughly 15 percent of students before the pandemic, 28.5 percent in 2021–22, and still 23.5 percent in 2023–24 — about 57 percent above the pre-pandemic rate.
- No national dataset establishes a cause. Anyone telling you with confidence that it is phones, or parents, or discipline reform, is giving you an opinion wearing a statistic’s coat.
Ask a room full of teachers whether student behavior is getting worse and you will not get a debate. You will get stories. The phone that will not go away. The kid who walks out mid-sentence. The parent email that starts at a ten. Nobody in the building thinks this is the same job it was in 2019.
Then you go look at the national numbers and they do not line up neatly with the stories. Some of them point the other way. That gap is worth understanding, because the version of this question you answer determines what you try to fix.
This article is the evidence, honestly reported, including the parts that cut against the premise. If you want the practical side instead, start with prevention that happens before anything goes wrong or what to do with the students who take the most out of you.
Why is student behavior getting worse, according to teachers?
Teachers overwhelmingly report that behavior is worse than before 2020, and the share saying so keeps rising. In the EdWeek Research Center’s December 2024 survey of 990 educators, 72 percent said students misbehave more than they did in fall 2019 — 48 percent said a lot more. Only 9 percent said students misbehave less.
What makes that finding hard to wave off is the direction of travel. The same organization asked a version of this question in 2021 and got 66 percent. In early 2023 it was 70 percent. By late 2024 it was 72 percent, and the share saying behavior was about the same as 2019 had fallen from 24 to 20 percent. If this were a pandemic shock wearing off, the line would be going the other way.
It has not. In an EdWeek Research Center survey of more than 1,000 educators fielded between April and June 2026, student behavior was the single most commonly named challenge for the coming school year, at 75 percent — ahead of student engagement at 70 percent and well ahead of budget uncertainty at 42 percent. Half of respondents expected behavior to get worse again.
Federal data on schools says something similar, in flatter language. The National Center for Education Statistics’ School Pulse Panel surveyed 1,714 public schools in May 2024. Eighty percent said the pandemic was still negatively affecting students’ behavioral development. Twenty-six percent said lack of focus or inattention was having a severe negative impact on learning — the single highest-rated problem on the list, above classroom disruption at 19 percent and academic unpreparedness at 21 percent. Thirty-six percent reported disrespect toward staff at least weekly.
What does the data say that cuts against this?
Several of the longest-running federal measures of student behavior show flat or improving trends, not worsening ones. That does not make teachers wrong. It means the thing teachers are describing is not the thing those surveys measure.
Start with the measure closest to the claim. NCES asks public school teachers directly whether student misbehavior interfered with their teaching. In 2011–12, 41 percent said yes. In 2015–16, 43 percent. In 2020–21, 32 percent. By that measure, teacher-reported interference dropped by about a quarter.
Before anyone uses that to tell teachers they are imagining things: 2020–21 was the year of remote and hybrid instruction. A teacher looking at a grid of muted squares is not managing a hallway. That reading is badly confounded, and a newer comparable figure is what the field actually needs. The honest statement is that the most direct federal trend line on this question ends at a year nobody can interpret cleanly.
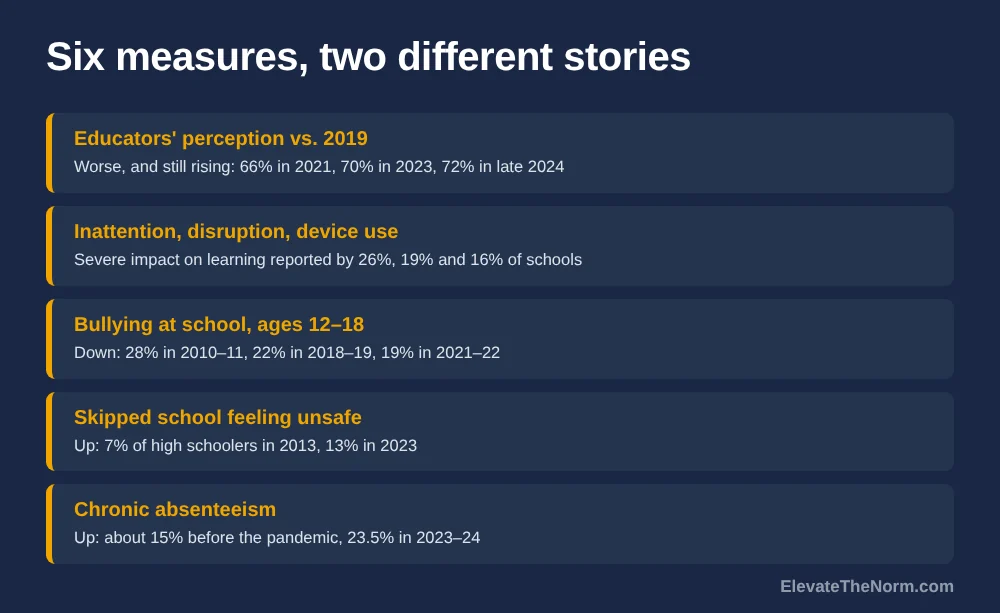
The student-reported measures are less ambiguous and still mixed. In the Department of Justice’s School Crime Supplement, the share of students ages 12 to 18 who said they were bullied at school fell from 28 percent in 2010–11 to 22 percent in 2018–19 to 19 percent in 2021–22. NCES cautions that the 2021–22 survey changed and that there was no consistent trend across the period, so do not treat that as a clean slope — but it is not a rise.
The CDC’s Youth Risk Behavior Survey, which collected 20,103 usable questionnaires from high school students in 2023, tells the same split story. Being bullied at school went from 20 percent in 2013 to 19 percent in 2023, which CDC scores as a decrease overall — though it jumped from 15 percent in 2021 to 19 percent in 2023, which is the kind of two-year move that feels like a trend from inside a building. Meanwhile two things got clearly worse: being threatened or injured with a weapon on school property rose from 7 to 9 percent, and skipping school because of safety concerns rose from 7 to 13 percent.
Why do teacher reports and student data disagree?
They measure different things. The national surveys count discrete, nameable events — a fight, a bullying incident, a weapon. Teachers are describing the texture of a class period: attention that will not hold, work that does not get started, a reply that would have been unthinkable six years ago. None of that generates an incident report.
That is why the School Pulse Panel finding is the most useful one in this whole article. The top-rated problem was not violence. It was inattention. The second was classroom disruption. Sixteen percent of schools said unpermitted device use was severely hurting learning. These are the low-floor, high-frequency behaviors that never show up in a crime statistic and consume an entire career’s worth of patience.
| What’s being measured | Source | Direction | What it actually tells a teacher |
|---|---|---|---|
| Educators’ perception of misbehavior vs. 2019 | EdWeek Research Center, Dec 2024, 990 educators | Worse, and still rising (66% → 70% → 72%) | The adults in buildings are not adjusting to a new normal. They think it is still moving |
| Teacher-reported interference with teaching | NCES NTPS/SASS, 2011–12 to 2020–21 | Down, 41% → 43% → 32% | Confounded by remote instruction; needs a post-2021 reading before anyone leans on it |
| Inattention, disruption, device use | NCES School Pulse Panel, May 2024, 1,714 schools | Severe impact reported by 26% / 19% / 16% | The real complaint, and the one no violence statistic captures |
| Bullying at school | DOJ School Crime Supplement, ages 12–18 | Down, 28% (2010–11) → 19% (2021–22) | Schools got better at this. It is worth saying out loud |
| Skipped school over safety fears | CDC YRBS, high school, 2013 vs 2023 | Up, 7% → 13% | Students feel less safe even where incidents did not rise |
| Chronic absenteeism | AEI analysis of 44 states + DC, 2025 | Up, ~15% → 23.5% | The clearest, largest, best-documented worsening on this list |
What actually got measurably worse?
Attendance. It is not close. Chronic absenteeism — missing at least 10 percent of the school year — sat at roughly 15 percent before the pandemic. It hit 28.5 percent in 2021–22, fell to 25.4 percent in 2022–23, and was still 23.5 percent in 2023–24 across the 44 states and the District of Columbia that reported. That is about 57 percent above the pre-pandemic rate, and the rate of improvement slowed in the most recent year.
This belongs in a behavior article because it is upstream of most of what teachers are describing. A student who misses a day a week is behind, and a student who is behind has every reason to avoid the work, refuse the task, or get removed from the room instead of failing in front of people. If you only have the energy to fix one thing this year, what actually brings students back to class will buy you more than any behavior system will.
The second clear worsening is the subjective one, and it is real even though it is a feeling: students are more likely to say they stayed home because they did not feel safe. Thirteen percent in 2023, against 7 percent in 2013. A school can have a falling incident rate and a rising fear rate at the same time, and the fear is its own problem.
So what is causing it?
Nobody knows, and that answer is more useful than a confident wrong one. None of the datasets above are designed to identify causes. They count things. Every causal story on offer right now is a hypothesis with some supporting correlation and no national test behind it.
Here is what gets proposed, and what each claim is actually standing on.
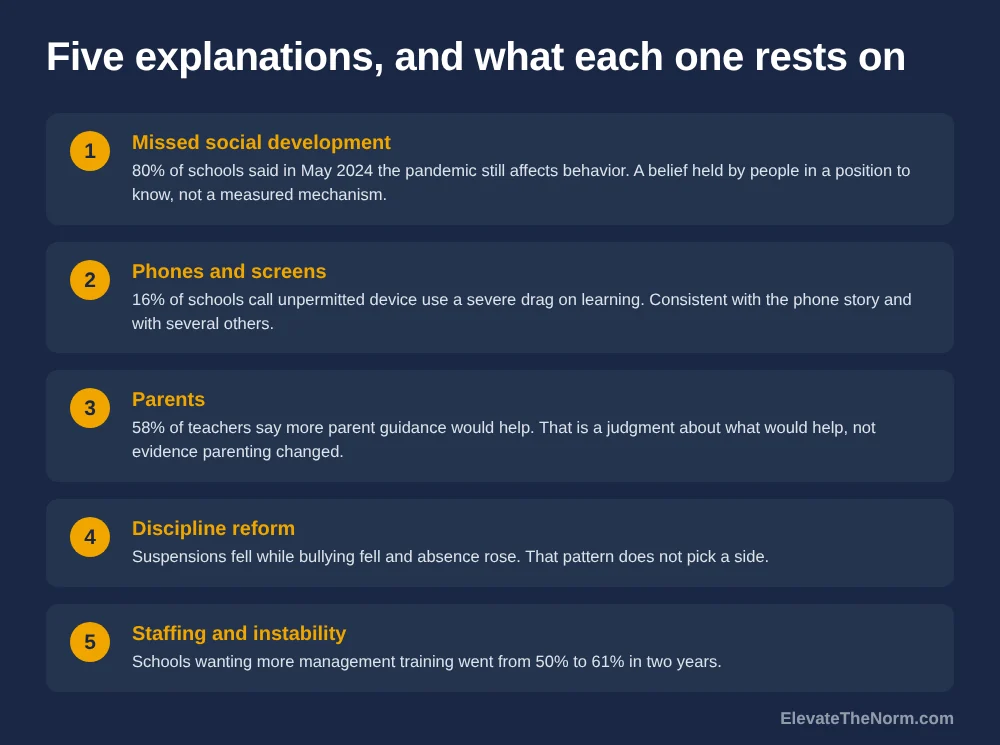
- Missed social development during the shutdowns. The most widely held explanation, and the one schools themselves endorse: 80 percent of schools told the School Pulse Panel in May 2024 that the pandemic was still negatively affecting students’ behavioral development. That is a belief held by people in a position to know. It is not a measurement of the mechanism.
- Phones and screens. Sixteen percent of schools called unpermitted device use a severe drag on learning, and inattention topped the list. That is consistent with a phone story and also consistent with several others. The honest treatment of the evidence here is in our piece on cell phones in the classroom, which does not claim more than the studies support.
- Parents. Educators increasingly name this one, and in an EdWeek Research Center survey of more than 5,800 teachers fielded between August and November 2025, 58 percent said more guidance from parents on behavior would help — the most-chosen answer. Worth noting what that is: teachers’ judgment about what would help, not evidence that parenting changed.
- Discipline reform. Commonly blamed, rarely evidenced in the direction claimed. Suspension rates fell in many districts over the same period that bullying fell and absenteeism rose, which is not a pattern that picks a side. Our review of what the restorative practices research actually shows includes the findings that do not flatter it — including that half-implemented programs are barely distinguishable from no program at all.
- Staffing and instability. Sixty-one percent of schools told NCES in 2024 they needed more classroom-management training, up from 50 percent two years earlier. A building with more new teachers has more rooms where behavior is being learned on the job. Among teachers with three or fewer years of experience, 36 percent reported misbehavior interfering with teaching, against 30 percent of those with 20 or more years.
Most likely all five are doing some work and the mix differs by building. What should make you suspicious is any version of this argument that explains everything and predicts nothing.


Is it worse in some schools than others?
Yes, and the pattern is the one you would guess. Districts serving more disadvantaged students had higher absenteeism both before and after the pandemic, according to the AEI analysis. The relative increase was similar across district types, though — meaning the shock hit everybody and landed on top of an existing gap. In the federal teacher data, 36 percent of teachers in city schools reported misbehavior interfering with teaching, against 29 to 33 percent elsewhere.
Two things follow from that, and they pull in opposite directions. A district average hides a lot; the building with the worst numbers needs a different response from the building at the mean, and a single district-wide behavior initiative will be over-built for one and under-built for the other. But a gap in a behavior statistic is not a statement about the students in the higher-number building. It describes attendance, staffing stability, and how many first-year teachers are learning to run a room in September — all of which are distributed unevenly on purpose.
One more caution on the numbers in this article, because it matters for a grades 6–12 reader. The School Pulse Panel and the federal teacher surveys cover K–12 and report elementary, middle and high schools together unless broken out. The CDC survey is high school only, and the School Crime Supplement covers ages 12 to 18. Where a figure is specific to secondary students, this article says so; where it is a K–12 average, treat it as the direction rather than your number.
What can one teacher actually do about it?
Stop trying to solve a national trend inside a 50-minute period, and spend the effort on the three or four things that are genuinely inside your control. None of this is new. It is just more load-bearing than it used to be.
- Fight for attendance before you fight for compliance. The student in the seat can be redirected. The student who is not there cannot. Track who is drifting toward a day a week and intervene while it is still three absences, not thirteen.
- Design the period so inattention has nowhere to sit. Inattention is the top-rated problem in the federal data, and it grows in the gaps — the dead four minutes at the start, the ten minutes after the work is finished. Routines and procedures are an attention strategy before they are a discipline strategy.
- Handle disrespect privately and immediately. Thirty-six percent of schools report disrespect toward staff weekly. Handled in front of an audience it becomes a contest the student cannot afford to lose. Handled quietly, at the desk or at the door, it is usually over in thirty seconds.
- Keep the consequence proportional and keep the kid in the room. Removal that buys escape from work rewards the behavior it is meant to punish. Consequences that teach rather than humiliate are harder to run and they do not hand the student a reason to come back angrier.
- Do what you said you would do, every single time. This is the whole thing. Teenagers calibrate on follow-through, not on tone. A teacher whose stated consequence arrives on schedule has a quieter room than a teacher with a louder voice and a flexible memory.
How would you know any of this is working?
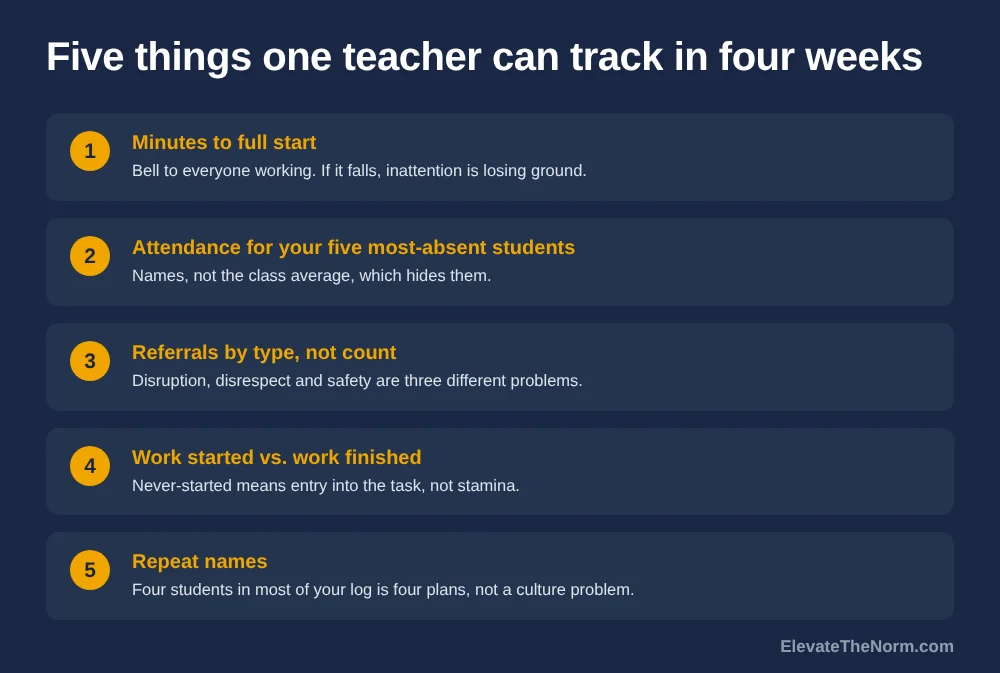
Pick measures you can actually read in four weeks, not a climate survey in May. Five that a single teacher can track without extra software:
- Minutes to full start. Time from the bell to the point where everyone is working. If that number falls, inattention is losing ground. If it holds at six minutes, nothing else you changed matters much yet.
- Attendance for your five most-absent students. Not the class average, which hides them. Five names, days present per week, updated Friday.
- Referrals by type, not count. Split them into disruption, disrespect, and safety. A falling total that is all one category is a different story from a falling total across the board.
- Work started versus work finished. If most of your incompletes are never-started rather than half-done, the problem is entry into the task, not stamina.
- Repeat names. If the same four students account for most of what you log, you have four plans to make, not a class-wide culture problem.
And one thing worth telling families straight when they ask whether behavior has gotten worse: the honest answer is that attendance and attention have, that serious incidents mostly have not, and that the school is working on the first two. Over-claiming a crisis makes parents more anxious than the data supports. Denying the change makes teachers feel unheard. Neither helps.
What should a school do instead of a crackdown?
Pick one measurable problem and resource it properly, rather than launching a program on every problem at once. The evidence that half-implemented behavior initiatives barely outperform doing nothing is the most consistent finding in this literature, and most buildings are running three of them.
Two candidates stand out from the data in this article. Attendance, because the gap between 15 percent and 23.5 percent is the largest documented change and it feeds everything downstream. And classroom-management support for early-career teachers, because schools themselves asked for it — the share wanting more training jumped from 50 to 61 percent in two years — and because the experience gradient in the federal data is real.
What the data does not support is a tougher-consequences push sold as evidence-based. Fifty percent of teachers in the 2025 EdWeek survey said tougher consequences would help, and that is a legitimate thing for a profession to ask for. It is not the same as a study showing it works.
Clay’s take: the question is wrong, and it costs us
“Is student behavior getting worse” is a question about teenagers. Almost everything actionable in the data above is a question about adults instead. Specifically, about whether students came to school, whether anybody noticed when they stopped, whether the new teacher in room 12 ever got taught how to run a room, whether the period had dead space in it.
I do not think a kid can wreck a class period that badly on their own. If it happened, something upstream was already broken, and the student is the place it finally showed. That is not an excuse for the behavior and it does not mean the consequence goes away. It means the consequence is the smallest part of the fix.
The other thing worth saying plainly: students who are poorer or further behind are not a different species with different needs. They need the same clarity, the same follow-through, and the same assumption of competence — and the research on what high expectations actually are is a lot more modest than the posters suggest. Treat the behavior data as information about your building’s systems. It is a poor description of the kids.
What should you do next?
Pull your own numbers before you accept anyone else’s narrative. Count how many of your students missed ten percent of the days so far this semester. Count how many of your referrals last month were inattention and low-level disruption rather than anything that would appear in a safety report. If your building looks like the national data, the first number will be larger than you expect and the second will be most of the list.
Then fix the period before you fix the policy. Start with the prevention side of classroom management, and if attendance is where your numbers are worst, go straight to the absenteeism piece.
Frequently Asked Questions
Is student behavior actually getting worse, or does it just feel that way?
Both, depending on which behavior. Educators report worsening consistently and the share saying so has risen every year since 2021, reaching 72 percent in a December 2024 EdWeek Research Center survey. But long-running student-reported measures of bullying and violence are flat or down over a decade. The honest answer is that low-level disruption, inattention and absence got worse while serious incidents did not.
What is the single biggest measured change in student behavior since 2019?
Chronic absenteeism. It ran around 15 percent of students before the pandemic, peaked at 28.5 percent in 2021-22, and was still 23.5 percent in 2023-24 across 44 states and the District of Columbia. That is roughly 57 percent above the pre-pandemic rate, and the pace of improvement slowed in the most recent year of data.
Do phones explain the rise in classroom disruption?
Phones are a plausible contributor, not a proven cause. In May 2024, 16 percent of public schools told federal surveyors that unpermitted device use was severely hurting learning, and inattention was the top-rated problem at 26 percent. Those figures are consistent with a phone explanation and also with several others. No national dataset isolates the effect.
Why does federal data show teacher-reported misbehavior going down?
Because the most recent federal reading is from 2020-21, a year of widespread remote and hybrid instruction. Teachers reported misbehavior interfering with their teaching at 41 percent in 2011-12 and 43 percent in 2015-16, then 32 percent in 2020-21. A drop measured during school closures is not evidence that classrooms improved, and a newer comparable figure is what the field needs.
Is middle school or high school worse for behavior?
Middle school, by the federal numbers, though the gap is not huge. In 2020-21, 37 percent of middle school teachers said misbehavior interfered with teaching, against 27 percent of high school teachers. High school leads on a different measure: 45 percent of high school teachers said tardiness and class cutting interfered, against 34 percent in middle school.
Would tougher consequences fix this?
There is no national evidence that they would, though half of teachers surveyed in 2025 said they would help. Tougher consequences are a reasonable professional request and a poor evidence claim. What the data does support is boring: better attendance, fewer dead minutes in a period, and real classroom-management training for early-career teachers.
Are students less safe at school than they used to be?
Reported incidents mostly say no; students’ own sense of safety says yes. Bullying at school fell from 28 percent of students ages 12-18 in 2010-11 to 19 percent in 2021-22. Over roughly the same period, the share of high schoolers who skipped school because they felt unsafe rose from 7 percent in 2013 to 13 percent in 2023.
Sources
- Will, M. (2025, January 8). Is student behavior getting any better? What a new survey says. Education Week. EdWeek Research Center survey of 990 educators — 134 district leaders, 97 school leaders and 759 teachers — fielded December 12–19, 2024.
- 75% of educators expect student behavior to be a challenge this year. What else? (2026, August). Education Week. EdWeek Research Center survey of more than 1,000 teachers and administrators fielded April 29 to June 22, 2026; also reports an August–November 2025 survey of more than 5,800 teachers.
- Institute of Education Sciences. (2024, July). About one-quarter of public schools reported that lack of focus or inattention from students had a severe negative impact on learning in 2023–24. School Pulse Panel, 1,714 public K–12 schools in all 50 states and DC, collected May 14–28, 2024.
- National Center for Education Statistics. Teachers’ views on managing classroom behavior. Condition of Education. Public school teacher responses from the Schools and Staffing Survey (2011–12) and the National Teacher and Principal Survey (2015–16, 2020–21).
- Centers for Disease Control and Prevention. (2024). Youth Risk Behavior Survey data summary and trends report 2013–2023. Nationally representative survey of high school students; 20,386 questionnaires completed in 155 schools, 20,103 usable after editing.
- National Center for Education Statistics. Student bullying. Condition of Education. School Crime Supplement to the National Crime Victimization Survey, students ages 12–18 in grades 6–12. NCES notes the 2021–22 survey changed and advises caution in comparing it with earlier years.
- Malkus, N. (2025, June 12). Lingering absence in public schools: Tracking post-pandemic chronic absenteeism into 2024. American Enterprise Institute. State-reported chronic absenteeism from 44 states plus the District of Columbia; the report is internally inconsistent on whether 44 or 45 states reported 2024 data.