By Clay Shumate
Project based learning science means students investigate a real phenomenon — something that happens that they cannot yet explain — and build an evidence-backed answer for someone who will use it. The lab comes before the explanation, not after it. Done well, students figure something out. Done badly, it is a poster about photosynthesis with a hot-glue volcano next to it.
Key takeaways
- Science has better high-school evidence than most subjects. A randomized trial across 61 schools in two states found a project-based chemistry and physics curriculum beat business-as-usual by about 0.20 standard deviations. The authors also report attrition that exceeded federal evidence standards. Both things are true.
- Start with a phenomenon, not a topic. “Why does the river downstream of the plant smell different in August?” is a project. “Water quality” is a chapter.
- If the data could be looked up, it is not an investigation. Students should generate or wrestle with data that does not have an answer key.
- Safety is a design constraint, not an afterthought. Three of the failure modes below are safety problems, and one of them is the reason districts quietly ban student-designed chemistry.
- Engineering projects need a failure budget. If a design has to work the first time, students will play it safe and learn nothing.
Free Download · 2-page PDF
Science Project Planner and Safety Sheet
The anchoring-phenomenon test, a three-dimensions map, the data test, a safety plan to complete before students start, the four shutdown risks and a failure budget.
Free. No email address required. Designed for grades 6–12. Browse every printable in Your Free Library.
What makes a science project actually project based learning?
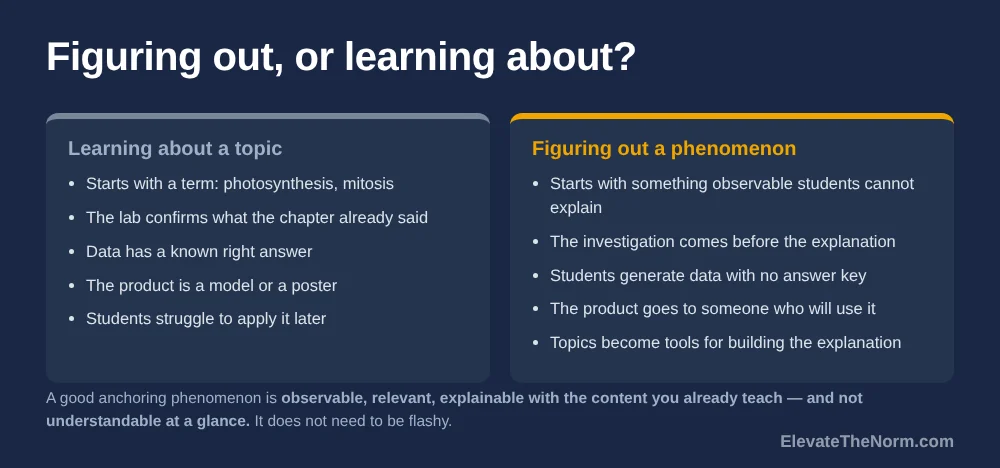
Students have to be figuring something out, not learning about something. That distinction comes straight out of the NGSS-aligned design literature, and it is the most useful sentence in this whole article. STEM Teaching Tool #42 puts it plainly: traditional instruction teaches general ideas like photosynthesis or mitosis as isolated topics students then struggle to apply, while phenomenon-based instruction centers on “figuring out why or how something happens,” and the topics become tools for building that explanation.
So the test for a science project is not whether students did something with their hands. It is whether there was a question on the board that the class could not answer on Monday and could defend an answer to by Friday. A volcano does not pass that test. Neither does a cell model. Both are “learning about.” That is the same line that separates authentic work from work that only looks real, and science is the subject where it is easiest to cross.
What makes a good anchoring phenomenon
The same source gives criteria worth keeping on a sticky note. A good anchoring phenomenon is an observable occurrence, not an explanation or a scientific term — a sunburn, not “ultraviolet radiation.” It is relevant or consequential to the students in front of you. It can be explained using the disciplinary core ideas you have to teach anyway. Students cannot understand it immediately, so they make sense of it across a sequence of investigations. And it should not require prior knowledge of the target content, because explaining it is how they acquire that content.
One more line from that tool that saves teachers a lot of wasted searching: the phenomenon does not need to be flashy. Everyday phenomena work well when the teacher helps students notice the limits of what they can currently explain. You do not need an eclipse. You need a puddle that dries faster on one side of the parking lot.
What the research says about project based learning in science
This is the subject where the secondary evidence is strongest, and it still comes with caveats the researchers published themselves.
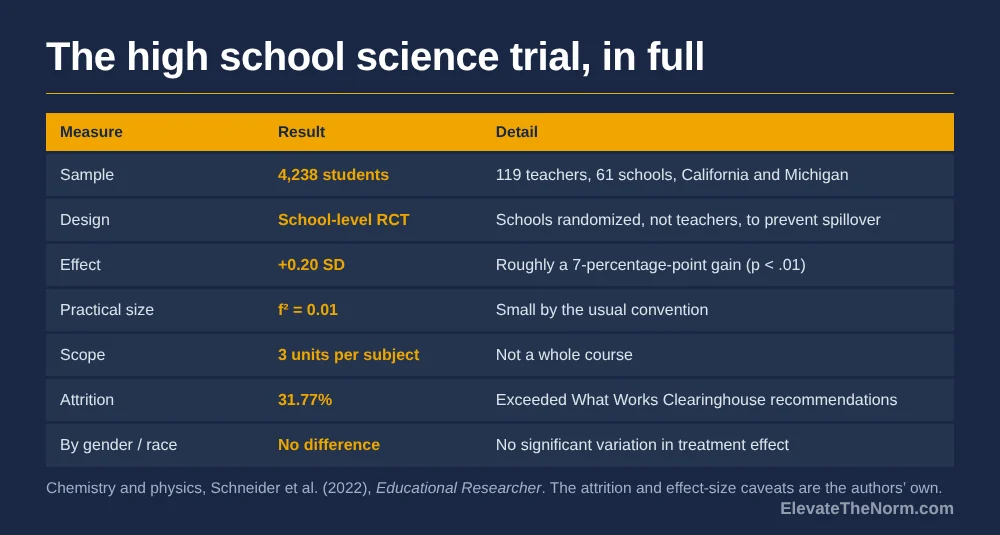
Schneider and colleagues ran a randomized controlled trial of a project-based high school chemistry and physics curriculum in California and Michigan, randomizing schools rather than teachers to prevent spillover. The analytic sample was 4,238 students across 119 teachers and 61 schools. Students in the project-based condition scored about 0.20 standard deviations higher on a summative assessment modeled on Michigan’s 11th-grade science test — roughly a 7-percentage-point gain (Schneider et al., 2022, Educational Researcher).
What the same paper also reports, and what you should know before quoting it in a department meeting:
- Student attrition was 31.77%, with a 9.18-point gap between treatment and control. The authors state plainly that this exceeded What Works Clearinghouse recommendations.
- The practical effect is modest. Cohen’s f² was 0.01 — small by the usual convention.
- The intervention was three units per subject, not a whole course. The authors say longer exposure might have produced larger effects, or might have hit a saturation point.
- Teachers’ self-reported PBL use did not significantly mediate the effect. Students’ reported use of modeling accounted for about 28% of it, and that was significant only at the .10 level.
- No significant differences by gender or race/ethnicity — which is a genuinely good sign, and worth saying.
There is a second line of evidence worth knowing. A school-level randomized trial of a project-based AP Environmental Science and AP U.S. Government curriculum across five urban districts found 44.8% of exam-takers earned a qualifying score of 3 or higher against 37.2% in the comparison group (Saavedra et al., 2021). Those authors are equally candid: the full-sample gap was smaller, unadjusted year-one estimates were near zero, and 83% of the effect came in the year teachers had the most external coaching.
The honest summary: two randomized trials, both in high school science or a science-adjacent AP course, both finding real but modest gains, both reporting attrition problems their own authors flag. That is better evidence than almost any instructional trend has, and it is not a promise. If a vendor tells you project based learning science curricula produce large achievement gains, ask which study and then read its limitations section.
25 project based learning science projects for grades 6–12
Each one starts with a phenomenon or a decision, requires data students generate or interrogate themselves, and ends with a product someone outside the room can use. Times assume a standard period. Where a project has a safety constraint that would stop it in most buildings, I have said so in the row rather than leaving you to find out in week two.
Life science and biology (1–5)
| # | Project | Driving question / phenomenon | Grades | Time | Product and audience |
|---|---|---|---|---|---|
| 1 | Schoolyard biodiversity survey | Which part of our campus supports the most life, and what makes the difference? | 6–10 | 2–3 weeks | Species inventory and planting recommendation to the groundskeeper |
| 2 | Hand-contact microbe map | Which surfaces in this building actually carry the most growth? | 7–12 | 2 weeks | Findings memo to custodial staff. Plate cultures sealed, never opened — many districts restrict this; check first. |
| 3 | Seed germination trial | What single variable most changes how fast these seeds germinate? | 6–9 | 3 weeks | Controlled-experiment poster and protocol for next year’s class |
| 4 | Local pollinator watch | Which pollinators visit here, and when did they show up this year? | 6–12 | 4 weeks | Observations submitted to a citizen-science database |
| 5 | Cafeteria food-waste audit | What gets thrown away untouched, and what would change it? | 6–12 | 2 weeks | Weighed data and proposal to the cafeteria manager |
Why these are PBL: none of the answers are in a textbook, because they are about this campus. Project 5 is the one that most reliably produces action, because the data is a number on a scale and nobody can argue with a scale.
Earth and environmental science (6–10)
| # | Project | Driving question / phenomenon | Grades | Time | Product and audience |
|---|---|---|---|---|---|
| 6 | Urban heat island mapping | Why is one side of our town measurably hotter than the other? | 7–12 | 3 weeks | Temperature map and shade-tree recommendation to a city office |
| 7 | Stream health index | Is this creek healthier than it was upstream, and how would we know? | 8–12 | 3–4 weeks | Water-quality report to a watershed group. Requires a supervised site and permission. |
| 8 | Storm drain trace | Where does the water from our parking lot actually end up? | 6–10 | 2 weeks | Annotated watershed map posted at the school entrance |
| 9 | Soil compaction and runoff | Why does this field flood and that one does not? | 7–11 | 2 weeks | Infiltration data and a drainage recommendation |
| 10 | Local air-quality log | How does air quality here change across a week, and what drives it? | 8–12 | 3 weeks | Data brief with sourced comparison to regional monitors |
Why these are PBL: each generates a dataset the class owns. Project 6 is the strongest entry point I know for a first attempt, because cheap infrared thermometers make the data collection trivial and the result is always surprising enough to argue about.
Physical science, chemistry and physics (11–16)
| # | Project | Driving question / phenomenon | Grades | Time | Product and audience |
|---|---|---|---|---|---|
| 11 | Insulation test rig | Which cheap material keeps a drink cold longest, and why that one? | 6–10 | 1–2 weeks | Tested recommendation with cost per degree retained |
| 12 | Classroom energy audit | Where does this building waste the most electricity? | 8–12 | 3 weeks | Costed proposal to the facilities director |
| 13 | Bridge load investigation | What geometry carries the most load per gram of material? | 7–11 | 2 weeks | Tested design with load data and a failure analysis |
| 14 | Sound mapping the building | Which spaces are too loud to learn in, and what would fix it? | 7–12 | 2 weeks | Decibel map and treatment recommendation to administration |
| 15 | Water filtration challenge | Can we clear this water using only materials under five dollars? | 6–10 | 2 weeks | Documented design and cost analysis. Turbidity only — never present filtered water as potable. |
| 16 | Reaction rate investigation | What actually controls how fast this reaction runs? | 9–12 | 2 weeks | Lab report defended in a peer review session. Teacher-approved reagents only; no student-designed chemistry. |
Why these are PBL: each has a constraint that forces a tradeoff — cost, mass, materials, time. A tradeoff is what turns an activity into engineering. Project 11 is the cheapest real one on this list and it works in a room with no lab at all.
Engineering and design (17–21)
| # | Project | Driving question / phenomenon | Grades | Time | Product and audience |
|---|---|---|---|---|---|
| 17 | Assistive device for a real user | What small problem does one person we know actually have? | 8–12 | 4 weeks | Prototype delivered to the user, with their feedback documented |
| 18 | Redesign one school space | Why does this hallway jam at the same time every day? | 6–12 | 3 weeks | Observation data and a scaled redesign proposal |
| 19 | Low-cost sensor build | Can we measure something the school currently guesses at? | 9–12 | 4 weeks | Working sensor plus calibration documentation |
| 20 | Packaging that survives the drop | What design protects this object at the lowest material cost? | 6–9 | 1–2 weeks | Tested package with iteration log |
| 21 | Emergency plan stress test | Does our posted evacuation route actually work from this room? | 8–12 | 2 weeks | Timed findings to administration. Walk-through only, never during a real drill. |
Why these are PBL: they fail. That is the point. Project 17 is the best project in this article and the hardest to run, because a real user will tell a fifteen-year-old that the thing they built does not work, and the revision after that conversation is where the learning lives.
Data, health and scientific argument (22–25)
| # | Project | Driving question / phenomenon | Grades | Time | Product and audience |
|---|---|---|---|---|---|
| 22 | Claim-evidence audit of a viral post | Does this health claim survive contact with the study it cites? | 8–12 | 2 weeks | Published explainer tracing the claim to its source |
| 23 | Sleep and schedule data study | What does our own data say about start times and sleep? | 9–12 | 3 weeks | Anonymous survey report with a limitations section. No individual health data; aggregate only. |
| 24 | Replication of a simple study | Does a published classroom-scale result hold up when we run it? | 9–12 | 3 weeks | Replication report, including a null result if that is what happens |
| 25 | Science in the local news | Did this story represent the research accurately? | 7–12 | 1–2 weeks | Letter to the editor or annotated correction |
Why these are PBL: project 24 teaches something no lab write-up ever will. Students who run a replication and get nothing learn that a null result is a finding, which is the single most useful idea in science education and almost never gets taught, because school labs are designed to work.
Safety, standards and the things that get projects shut down
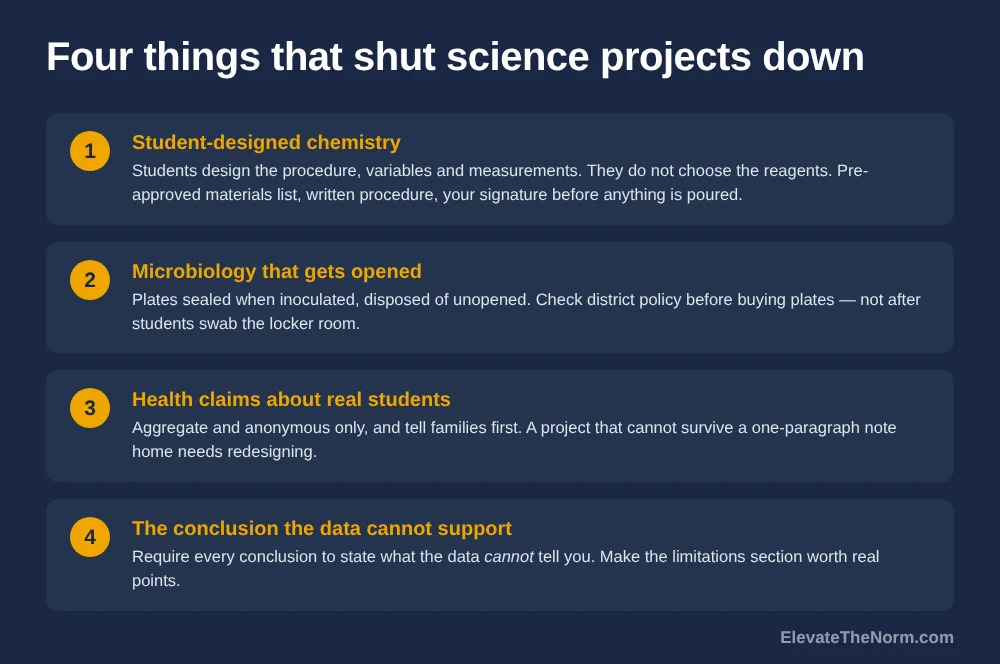
Science has a constraint social studies does not: a badly designed project can hurt somebody. These are the four that come up most, and the first two are the reason some districts have quietly banned whole categories of student investigation.
1. Student-designed chemistry
“Design your own experiment” and “choose your own reagents” are two different sentences, and only one of them is safe. Students can absolutely design the procedure, the variables, the controls and the measurements. They should not be choosing what goes in the beaker. Give a pre-approved materials list, require the procedure in writing before anything is poured, and sign off on it yourself. This costs you one planning period and it is the difference between an inquiry course and an incident report.
2. Microbiology that gets opened
Culture plates from human and building surfaces grow whatever is there, which can include organisms you did not plan for and cannot identify. The rule in most districts is that plates are sealed when inoculated and autoclaved or disposed of unopened. Check your district’s policy before you buy the plates, not after students have swabbed the locker room. If the answer is no, project 2 becomes a literature-based claim-evaluation project instead and still works.
3. Health claims about real students
Sleep studies, fitness data, diet logs and anything resembling a health survey can collect information about identifiable minors. Keep it aggregate, keep it anonymous, and tell families what you are doing before you do it. A one-paragraph note home prevents nearly every complaint, and a project that cannot survive that note is a project that should be redesigned. Project 23 is written to be the safe version: anonymous, aggregate, and reported with a limitations section.
4. The conclusion the data does not support
This is the academic failure mode and it is nearly universal. Students run three trials, get a messy result, and write “this proves that…” in the conclusion. The fix is mechanical: require every conclusion to state what the data cannot tell you, next to what it can. Make the limitations section worth real points. Students who have to name their own sample size and measurement error stop over-claiming within about two projects, and they carry that habit into every subject.
A note on standards
Three-dimensional standards make this easier to justify than it used to be. A project that asks students to explain a phenomenon is already pulling in a science and engineering practice, a disciplinary core idea and a crosscutting concept at the same time — which is exactly what the standards ask for and what a worksheet cannot do. Write the three dimensions on your plan before you launch. It takes ten minutes and it is the document that answers an administrator’s question before they ask it.
How to run your first project based learning science unit
Pick a phenomenon from a unit you already teach, and keep the first one under two weeks. The research above is the argument for modesty: the Michigan and California trial replaced three units per subject, not a whole course, and still produced a measurable effect. You do not have to rebuild the year.
- Find the phenomenon. Something observable on your campus or in your town that the unit’s content explains. Not a topic — an event.
- Check it against the criteria. Observable, relevant, explainable with the content you must teach, and not understandable at first glance.
- Decide what data students will generate. If every number could be looked up, redesign it. The driving question examples page has a revision formula that works for science questions too.
- Write the safety plan before the lesson plan. Materials list, approval step, disposal, and the one thing that would stop the project.
- Build in a failure budget. Tell students the first design is expected to fail and that the iteration log is graded. Otherwise they build the safe thing.
- Score the reasoning, not the finish. A clean poster with an unsupported claim should score lower than a messy one with an honest limitations section. The PBL rubric template keeps presentation from swallowing the science.
If you teach a second subject or trade units with a colleague, the same structure carries over — the companion piece on project based learning in social studies uses the same spine with primary sources in place of data, and the seven-step sequence is subject-neutral.
What to do next
Walk your campus once this week and write down three things you cannot immediately explain. One of them is your anchoring phenomenon. Then name the person who will receive the finished work — the facilities director, the groundskeeper, the watershed group, the cafeteria manager — and send them one email asking if they would read a student report.
That is the whole setup. The content you already know how to teach. What changes is that students spend the unit answering something instead of being told it, and somebody outside the room is waiting for the answer.
Before you go: grab the free Science Project Planner and Safety Sheet (PDF) — ElevateTheNorm.com branded, printable, no email required.
Frequently Asked Questions
What is project based learning in science?
Students investigate a phenomenon they cannot yet explain, generate or interrogate real data, and build an evidence-backed answer for someone who will use it. The investigation comes before the explanation. A lab that confirms what the chapter already said is a verification exercise, not project based learning.
Does project based learning actually work in science?
The best evidence says yes, modestly. A randomized trial of a project-based high school chemistry and physics curriculum across 61 schools and 4,238 students in California and Michigan found a gain of about 0.20 standard deviations, roughly 7 percentage points, with no significant differences by gender or race. The authors also report 31.77% student attrition, which exceeded What Works Clearinghouse recommendations, and a small Cohen’s f² of 0.01. Both the result and the caveat are real.
What is an anchoring phenomenon and how do I pick one?
An anchoring phenomenon is an observable occurrence — a sunburn, a puddle that dries unevenly — rather than a scientific term or an explanation. Good ones are relevant to your students, explainable with the content you already have to teach, and not understandable at a glance. It does not have to be flashy; everyday phenomena work well when you help students see the limits of what they can currently explain.
Can students design their own experiments safely?
Students can design the procedure, variables, controls and measurements. They should not choose their own reagents. Give a pre-approved materials list, require the written procedure before anything is mixed, and sign off yourself. That one step is the difference between an inquiry course and an incident report.
What if I have no lab, no budget and no equipment?
Most of the twenty-five projects here need a thermometer, a scale, a phone and a clipboard. Urban heat mapping needs a cheap infrared thermometer. Insulation testing needs cups and water. Food-waste auditing needs a bathroom scale. The expensive part of project based learning science is planning time, not equipment.
How do I grade a science project fairly when results are messy?
Score the reasoning, not the outcome. A student whose design failed and who can explain why, with data, has demonstrated more than one whose project worked by luck. Make the limitations section worth real points, and grade content knowledge individually even when the product is a group one.
How long should a science project take?
One to three weeks for your first. Fieldwork and engineering projects with a real user run three to four. The randomized trial above replaced three units per subject rather than a whole course and still found an effect — you do not need to rebuild the year to get something out of this.
How does this fit three-dimensional science standards?
A project that asks students to explain a phenomenon pulls a science and engineering practice, a disciplinary core idea and a crosscutting concept together at once, which is what three-dimensional standards ask for and what a worksheet structurally cannot do. Write the three dimensions on your plan before you launch; that document answers an administrator’s question before it is asked.
Sources
- Schneider, B., Krajcik, J., Lavonen, J., Salmela-Aro, K., Klager, C., Bradford, L., Chen, I.-C., Baker, Q., Touitou, I., Peek-Brown, D., Dezendorf, R. M., Maestrales, S., & Bartz, K. (2022). Improving science achievement—Is it possible? Evaluating the efficacy of a high school chemistry and physics project-based learning intervention. Educational Researcher. Read the limitations section: the authors report attrition that exceeded What Works Clearinghouse recommendations. https://journals.sagepub.com/doi/10.3102/0013189X211067742
- Saavedra, A. R., Liu, Y., Haderlein, S. K., Rapaport, A., Garland, M., Hoepfner, D., Morgan, K. L., & Hu, A. (2021, February 22). Knowledge in Action Efficacy Study Over Two Years. USC Dornsife Center for Economic and Social Research. https://files.eric.ed.gov/fulltext/ED616435.pdf
- STEM Teaching Tools. (2016, September). Using Phenomena in NGSS-Designed Lessons and Units (Practice Brief #42). https://stemteachingtools.org/assets/landscapes/STEM-Teaching-Tool-42_Using_Phenomena_in_NGSS_23.pdf
- Saavedra, A. R., & Rapaport, A. (2021, November). Project-based learning in AP classrooms: Lessons from research. Phi Delta Kappan. https://kappanonline.org/research-project-based-teaching-and-learning-saavedra-rapaport/
- College Board / Lucas Education Research. Project-Based Learning Boosts Student Achievement in AP Courses (research brief). https://apcentral.collegeboard.org/media/pdf/project-based-learning-boosts-student-achievement-in-ap-courses.pdf