A 1–4 standards-based grading scale reports how well a student has met a standard, not how many points they accumulated. Four means beyond the standard, three means meeting it, two means approaching it, one means not yet. Three is the target, not four — which is the single thing most families and a fair number of teachers have wrong about it.
The scale itself is not hard. What is hard is the part nobody puts on the poster: turning those numbers back into a letter grade, because almost every school that adopts a four-point scale still has to file a percentage at the end of the term.
This page covers what each level means, why four levels rather than a hundred, and the conversion problem — including why the neat conversion chart your district hands out is a convention rather than a measurement.
Key Takeaways
- 3 is proficient and it is the goal. A 4 is not “an A” — it is work beyond the grade-level standard, and a student can have an excellent year without many of them.
- Four levels exist because a hundred do not work. Asked to grade one paper, 90 trained high-school teachers produced scores from 50 to 96.
- Nearly two-thirds of a 100-point scale describes failure. That is an accident of arithmetic nobody designed on purpose.
- The zero is the clearest case. Recovering from one zero in a percentage system takes perfect scores on at least nine other assignments.
- There is no validated conversion from 1–4 to letters. Every chart is an institutional convention, and they disagree with each other.
- Do not average the levels. Averaging reintroduces exactly the precision the scale was built to remove, and it punishes students who improved.
- Decide what a 3 means before September, in writing, with the department. Most scale arguments are definition arguments wearing a number.
Free Download · Printable PDF
1–4 Scale and Conversion Sheet
The four level descriptors in student-facing language, three conversion approaches side by side, the decision rules that beat averaging, and a one-page explainer you can send home.
Free. No email address required. Designed for grades 6–12. Rubric templates are on the standards-based grading rubrics page.
What Each Level on the 1–4 Scale Means
There is no national definition, which is worth saying out loud before anyone quotes one at you. Schools write their own descriptors, and they vary. The shape is consistent though, and this family-facing version from Gateway Public Schools is about as standard as it gets:
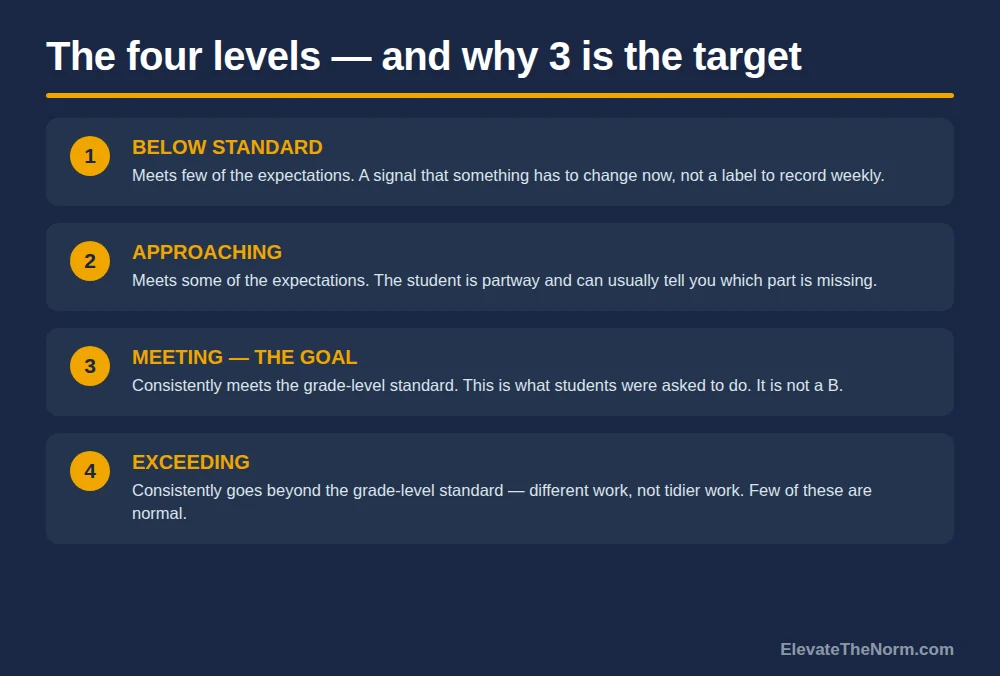
A 4 “consistently exceeds expectations” for skills and understanding. A 3 consistently meets them. A 2 meets some of them. A 1 meets few.
Read the word consistently in the first two. It is doing more work than the numbers. A student who produced one brilliant analysis in October and nothing like it since is not a 4, and a student who has hit the standard on the last three attempts is a 3 even if the first attempt was dreadful. The scale is a claim about where a student is now, not a summary of everything they have ever handed in.
The 4 causes most of the trouble at home, because families read four levels and assume A/B/C/D. It is not that. A 4 is work that goes past the grade-level standard — a different kind of task, not a tidier version of the same one. A student can meet every standard in your course, be entirely successful by any honest account, and collect very few 4s. If your reporting language does not say that plainly, you will spend October explaining it one parent at a time.
Why Four Levels and Not a Hundred
Because nobody can tell the difference between an 84 and an 86, and pretending otherwise has a cost.
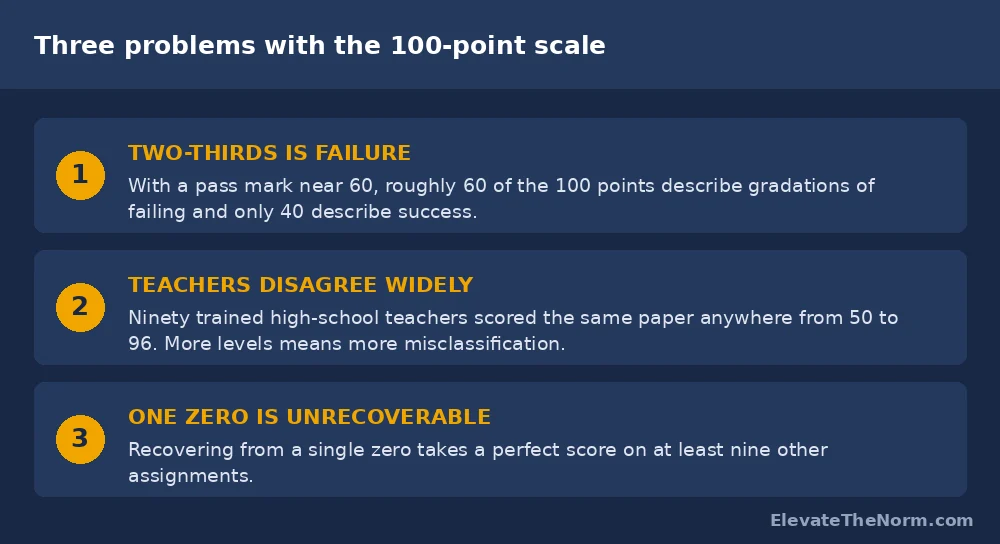
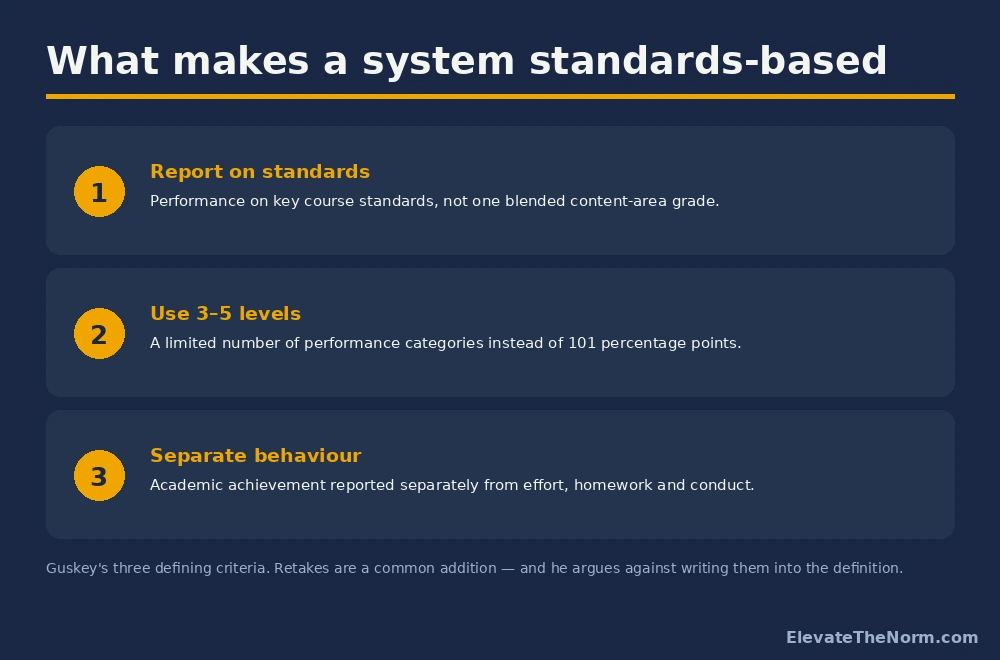
Thomas Guskey has made this case more carefully than anyone. In The Case Against Percentage Grades he points out that with a pass mark around 60, nearly two-thirds of the percentage scale describes levels of failure — sixty-odd gradations of failing and about forty of succeeding. No one chose that. It is what happens when you inherit a scale and never ask what it is for.
On reliability he cites a 2011 replication of a study first run in 1912. Ninety high-school teachers, given twenty hours of training, scored the same paper. The scores ranged from 50 to 96. More levels do not produce more accuracy; Guskey’s phrase for it is the illusion of precision, and his point is that with more levels more students are simply misclassified.
Then the zero, which is the cleanest arithmetic in the whole argument. To recover from a single zero in a percentage system, a student must earn a perfect score on at least nine other assignments. On a 0–4 scale the same missing piece of work costs about what it should. Guskey recommends integer scales for exactly this reason, and notes they line up with the GPA scale and with state assessment levels that already use four.
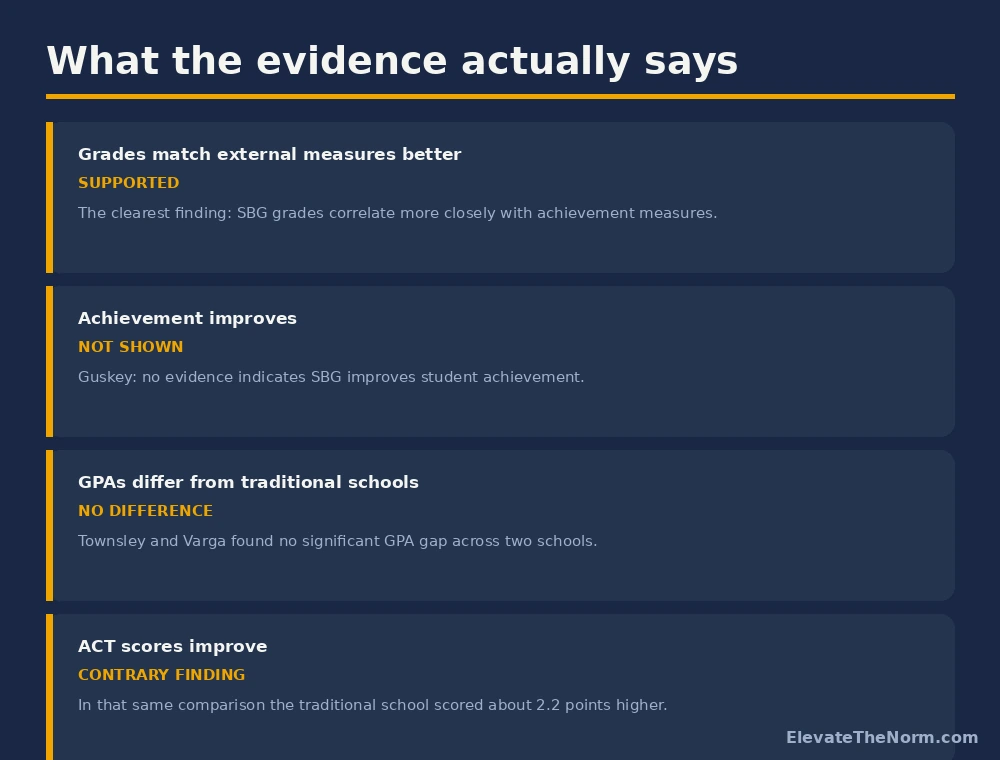
Worth being honest about what this evidence is. It is an argument about measurement and reliability, not a trial showing that four-point scales raise achievement. What the outcome evidence on standards-based grading actually shows is a separate and more mixed question. The case for four levels is that the number you report means something. That is a real benefit and it is not the same as a test-score claim.
The Conversion Problem
Here is the part the training day skips. Almost every school running a 1–4 scale still has to produce a letter grade, a GPA, or a transcript percentage — and there is no validated way to get from one to the other.
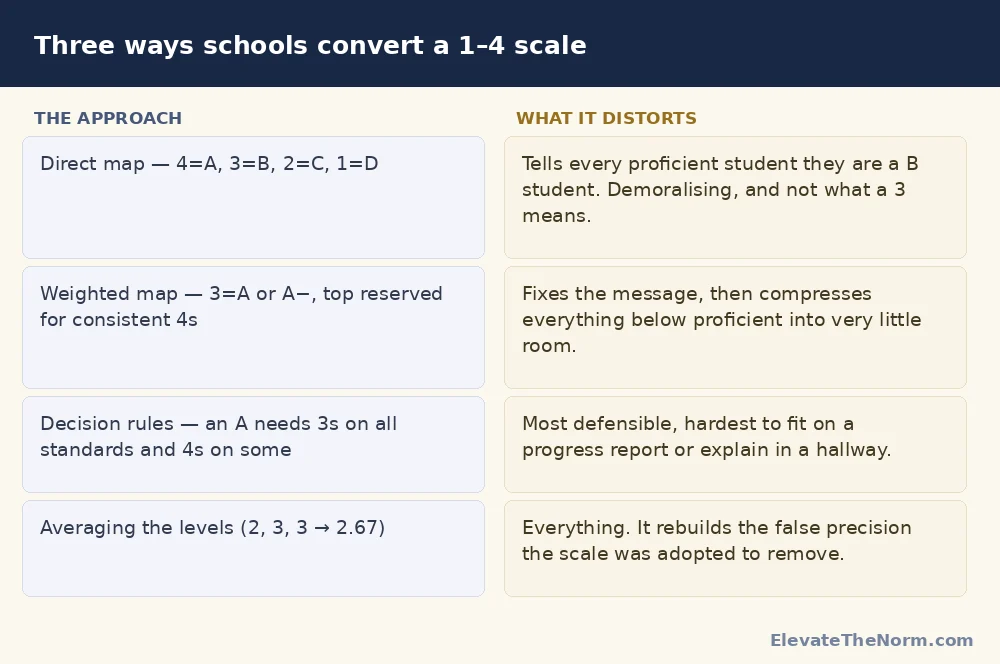
Districts generally pick one of three approaches. A direct map assigns a letter to each level: 4 is an A, 3 a B, and so on. It is simple and it quietly tells every proficient student they are a B student, which is both demoralising and false. A weighted map puts 3 at an A or A− and reserves the top only for consistent 4s, which fixes the message and compresses everything below into very little room. A decision-rule approach sets conditions instead of arithmetic — an A requires 3s on all standards and 4s on some, a B requires 3s on nearly all — which is the most defensible and the hardest to explain on a progress report.
None of those is discovered. They are all chosen. If you are looking for the correct conversion chart, stop: what you are actually choosing is what your school wants a letter grade to mean, and the arithmetic follows from that decision rather than producing it.
The question underneath the family anxiety is usually GPA, and it deserves a straight answer. A transcript still has to carry letters or a grade point, so the conversion your district picks is the thing that reaches a college — not your levels. A direct map that makes proficient students into B students will pull a GPA down relative to a neighbouring district doing it differently, and that is a real consequence rather than a misunderstanding to be explained away. If your school is adopting a four-point scale, someone should model what it does to the GPA distribution before it goes live, and should be able to tell families the answer. “It all works out” is not an answer.
Which is why the one genuinely portable rule is a negative one.
Do not average the levels
Averaging is the default in every gradebook and it undoes the scale. Three reasons, in order of how much damage they do.
It reintroduces false precision. A student with levels of 2, 3 and 3 averages to 2.67, and 2.67 is not a thing. The scale has four values because four is roughly what professional judgement can reliably distinguish. Producing two decimal places from it is the exact error the scale was adopted to stop.
It punishes the students who improved. A student who goes 1, 2, 3, 3 has learned the thing. Their average says 2.25 — approaching. Their most recent evidence says 3. One of those numbers is a description of a student and the other is a description of their history, and only one of them is what a grade is supposed to report.
It hides the pattern that matters. Two students both averaging 2.5 — one going 3, 3, 2, 2 and one going 2, 2, 3, 3 — need opposite conversations. The average erases the only information that would tell you which is which.
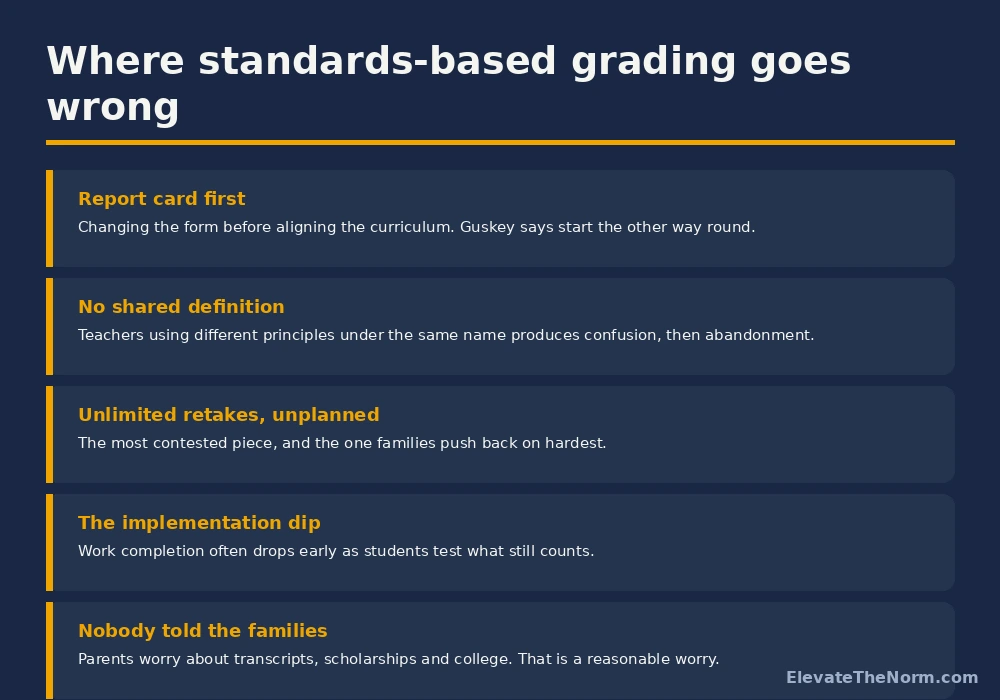
The usual alternatives are the most recent evidence, the mode, or professional judgement with the pattern in front of you. All three are defensible; all three require you to be able to say why. That is a feature, and it is also why this works far better when a department agrees the rule together rather than each teacher inventing one, which is the same failure mode as most of the ways standards-based grading goes wrong.
Two practical warnings. The first is that your gradebook will fight you: most systems average by default, several will not store a non-numeric level at all, and a few will happily average your levels behind the scenes while displaying something else. Find out which yours does before you trust a term’s worth of data to it.
The second is about the scale’s own reliability, and it would be dishonest to leave out. Fewer levels reduce disagreement between teachers; they do not remove it. Two teachers in the same department, marking the same essay against the same descriptors, will still hand back a 2 and a 3 often enough to matter to the student sitting between them. The fix is not a better rubric, it is moderation — a department periodically marking the same three pieces of work and arguing until the descriptors mean the same thing to everyone. An hour a term does more for grading accuracy than any conversion chart.
Let Them Argue Their Own Level
The most useful thing I do with this scale is not marking with it. It is making students say a number out loud and defend it.
In a project check-in the question is not how is it going — that gets you fine. The question is which level the work is currently at and what would move it up one. They have the descriptors. They have their own draft. They have to make the case, and I get to hear the reasoning rather than guess at it.
What happens is consistently more interesting than the grade. Students undersell by about a level and can usually name precisely what is missing, which means the gap was never that they did not know — it was that nobody had asked them to say it. A student who can tell you they are at a 2 because their evidence is thin in the second section has just written their own next step, and they will do it because it was theirs.
It also does something to the scale itself. A number a student has argued for is a number they understand. A number that arrives on a report card is a verdict, and teenagers treat verdicts the way anyone does — as something to contest or absorb, but not as information. If you want a structure for this rather than an improvised conversation, a short self-assessment form does most of the work.
One thing the scale should never become is a label. A 1 or a 2 is a statement about a piece of work at a point in time and it is supposed to trigger something — a re-teach, a conference, a second attempt that actually counts. If a student sits at 2 for six weeks and the only consequence is that the 2 keeps being recorded, the scale has stopped doing its job and become a slower way of writing a D. The number is a prompt for the adult, not a verdict on the child.
If Your District Requires Percentages Anyway
Most teachers reading this do not get to choose the reporting system. That is fine and the scale is still worth using; you just have to keep the two jobs separate.
- Assess in levels, report in whatever they require. The conversion happens once, at the end, as a deliberate act rather than a running total.
- Keep the level in front of students all term. They should see 1–4 on returned work even if the portal shows a percentage, because the level is the part they can act on.
- Write your conversion rule down before you need it and give it to students and families in September. A rule published in advance is a policy; the same rule produced in May is an argument.
- Never convert a single assignment. Convert the body of evidence for a standard, once. Converting each task and then averaging the percentages is the worst of both systems.
- Expect the first term to be rough and say so. Families are fluent in percentages and your scale is new to them.
And if you are the person choosing the system rather than living inside it, the honest brief is: a four-point scale buys you numbers that mean something and costs you a conversion argument you will have every year. That is usually a good trade. It is not a free one, and schools that present it as free are the ones that abandon it in year two.
Before you go: grab the free 1–4 Scale and Conversion Sheet (PDF) — ElevateTheNorm.com branded, printable, no email required.
Frequently Asked Questions
What does each number mean on a 1–4 standards-based grading scale?
4 means the work consistently goes beyond the grade-level standard, 3 means it consistently meets the standard, 2 means it meets some expectations, and 1 means it meets few. There is no national definition — schools write their own descriptors and they vary — but that shape is close to universal. The word doing the most work is “consistently”: the level describes where a student is now, across recent evidence, not an average of everything they have ever submitted.
Is a 3 a B?
Only if your district decided it is, and that decision is a convention rather than a measurement. A 3 means the student has met the standard, which in most schools’ own language is exactly what they were asked to do. Mapping that to a B tells every proficient student they are second-tier, which is both discouraging and inaccurate. Schools that think it through usually land on 3 as an A or A−, with the very top reserved for consistent 4s.
Should I average standards-based grading scores?
No. Averaging 2, 3 and 3 into 2.67 manufactures a precision the scale exists to avoid, and it penalises exactly the students who improved — a student who went 1, 2, 3, 3 has learned the material, whatever the mean says. Use the most recent evidence, the mode, or professional judgement with the whole pattern visible. Whichever you pick, agree it with your department and publish it before the term starts.
Why not just use percentages?
Because they are less accurate than they look. With a pass mark near 60, roughly two-thirds of a 100-point scale describes gradations of failure, and reliability research is unkind: asked to score one paper, 90 trained high-school teachers produced marks from 50 to 96. Then there is the zero — recovering from a single zero requires a perfect score on at least nine other assignments, which is a punishment nobody consciously designed.
How do I explain the 1–4 scale to parents?
Lead with the fact that 3 is the goal, because that is the misunderstanding underneath almost every worried email. Say plainly that a 4 is work beyond the grade-level standard rather than a better version of the same work, and that a student can be entirely successful with few 4s. Send it in writing in September, before any scores exist — the same explanation lands very differently once a family is looking at a number they do not like.
What if a student improves a lot at the end of the term?
Then their level should reflect that, which is the main practical advantage of the scale over a running average. A student who finishes the term demonstrating proficiency has demonstrated proficiency; a system that averages away their improvement is reporting their history rather than their learning. The check worth running is whether the recent evidence is genuinely consistent rather than one good day.
Does standards-based grading hurt my child’s GPA?
It depends entirely on the conversion your district chose, which is a decision rather than a property of the scale. A direct map where a 3 becomes a B will produce lower grade points than a weighted map where a 3 is an A−, for identical work. Since a transcript still carries letters or grade points, that choice is what actually reaches a college. It is a fair question to ask your school, and the right form of it is specific: what does a 3 convert to, and what happened to the GPA distribution the year you adopted this?
Does a 1–4 scale improve student achievement?
That is a different and much less settled question than whether it measures more honestly. The case for four levels is a measurement argument — fewer levels mean fewer misclassifications and a number that means something. The evidence on whether standards-based grading as a whole moves outcomes is genuinely mixed, and anyone selling it as a proven achievement intervention is going past what the research supports.
Sources
- Guskey, T. R. The Case Against Percentage Grades. Read the paper (PDF) — source for the two-thirds-of-the-scale-is-failure point, the 2011 replication in which 90 trained high-school teachers scored one paper from 50 to 96, the nine-assignments-to-recover-from-one-zero figure, and the recommendation to use integer 0–4 scales. This is an argument from measurement and reliability research; it is not a trial of student outcomes, and it should not be cited as one.
- Gateway Public Schools. Grading and the four-point scale: an overview for families. Read the overview (PDF) — source for the level descriptors quoted above. One school’s definitions, used here because they are clearly written and representative; there is no national standard, and your district’s wording governs in your building.
Every link above was checked on September 17, 2026. The three conversion approaches described in this article are common practice observed across published district policies, not findings from a study — there is no validated conversion between a four-point scale and letter grades, which is precisely the argument this page is making.