The Elevate Blog banner: Real Classrooms. Practical Ideas. Higher Expectations. Three students climb a rocky ridge at sunrise, each pulling the next one up, toward a teacher reaching down to help.

Tag: grading

  • Test Corrections: How to Make Them Teach Instead of Hand Back Points

    Test Corrections: How to Make Them Teach Instead of Hand Back Points

    By Clay Shumate · Updated October 24, 2026

    Test corrections are a structured second pass in which a student identifies why an answer was wrong and produces a correct one. The research on learning from errors is strong and supports the practice. The research on what students actually do with error feedback is much less flattering, and it is the part that determines whether your version works.

    Done well, a test correction is the most efficient reteaching you will ever get: the student already knows what they missed. Done badly, it is twenty minutes of copying answers off a neighbor’s paper for half the points back.

    Key Takeaways

    • Making errors and then correcting them beats avoiding errors. A review in the Annual Review of Psychology concluded that error avoidance “appears to be the rule in American classrooms” and that errorful learning followed by corrective feedback produces better retention.
    • Feedback is not optional — it is the whole mechanism. In one lab study, errors were corrected on a later test about 70% of the time with feedback and roughly 4% of the time without it.
    • Your most confident wrong answers are the ones most likely to get fixed. That is the hypercorrection effect, and it means the student who argues with you about question 14 is the student most likely to remember the right answer in May.
    • When corrections are optional, most students skip them. Across 20,058 assessments from 2,826 students in grades 5–11, students opened the detailed error feedback in only 44% of cases — and the students with the lowest scores were the least likely to look.
    • A reflection form on its own does nothing. A randomized study of “exam wrappers” found no effect on exam scores, final grades, or measured metacognition. The structure has to force the thinking, not just ask for it.

    Free Download · PDF

    The Test Correction Sheet and Policy Card (2 pages)

    Page 1 is the student sheet — three blocks of the four-box correction, with the reasoning box that makes copying an answer useless. Page 2 is a policy card to fill in and staple to the first test of the term, plus a sorting sheet for reading a class set in five minutes.

    Download the free PDF

    Free. No email address required. Designed for grades 6–12. Browse every printable in Your Free Library.
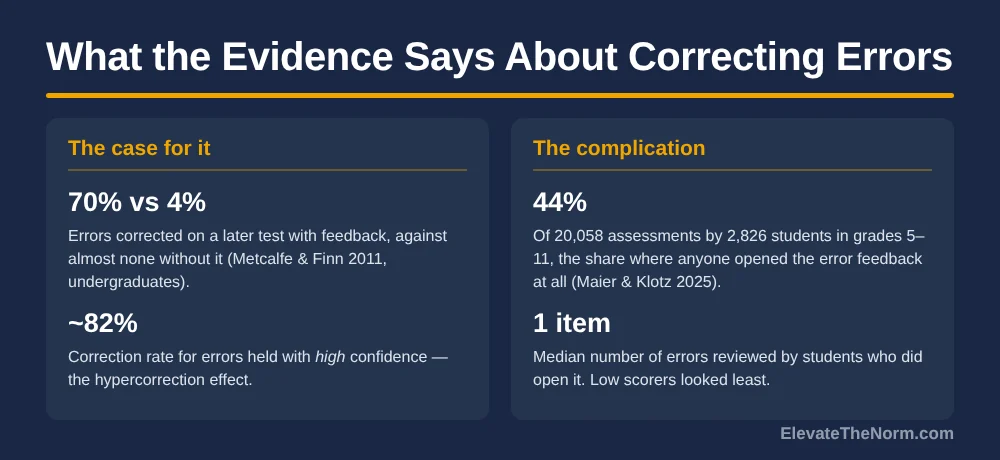
    Two-column graphic on test corrections evidence: 70 percent versus 4 percent correction rates with and without feedback and roughly 82 percent for high-confidence errors on one side, a 44 percent feedback open rate and a median of one error reviewed on the other
    The case for corrections and the complication, side by side.

    What Are Test Corrections?

    A test correction is a required second pass over a returned assessment in which the student states what the right answer is and why their first one was wrong. That second clause is the whole practice. Without it you have a transcription exercise.

    Two versions run in American schools under the same name, and they produce opposite results.

    Version one: hand back the test, let students fix wrong answers, give half credit back. Most look at the answer key, write the right letter, hand it in. Nobody learns anything, the grade goes up, and the next test looks exactly like the last one.

    Version two: the student has to name the error — not the answer, the error. What did I think was true that was not? That version is slower, harder to grade, and is the one with research behind it.

    If you only take one thing from this article: the credit is not the intervention. The credit is the thing that gets students to do the intervention. Confusing the two is how a good practice turns into grade inflation with extra steps.

    Does the Research Actually Support Learning From Mistakes?

    Yes, and more strongly than most teachers assume. Janet Metcalfe’s review “Learning from Errors,” published in the Annual Review of Psychology in 2017, surveys the laboratory evidence and reaches a blunt conclusion: error avoidance “appears to be the rule in American classrooms,” and it is the wrong rule. Errorful learning followed by corrective feedback produces better retention than carefully steering students around mistakes.

    Her recommendation is that teachers should “allow and even encourage students to commit and correct errors while they are in low-stakes learning situations rather than to assiduously avoid errors at all costs,” precisely because the goal is performance later, when the stakes are high.

    The crucial qualifier is the phrase followed by corrective feedback. Metcalfe is explicit that the feedback, “including analysis of the reasoning leading up to the mistake,” is what makes the error productive. A wrong answer left wrong is just a wrong answer. Same logic that makes formative assessment worth the class time: information is only worth collecting if something happens next.

    Why Your Most Confident Students Gain the Most

    Students correct the errors they were most sure about more reliably than the ones they guessed at. That is the hypercorrection effect, and it is counterintuitive enough that it is worth stating twice.

    Janet Metcalfe and Bridgid Finn tested it directly in a 2011 paper in the Journal of Experimental Psychology: Learning, Memory, and Cognition. Participants answered general-knowledge questions, rated their confidence, received corrective feedback on their errors, and were tested again later. Errors held with high confidence were corrected on the final test around 82% of the time. Overall recall after feedback was about 70%. Without feedback, correction rates fell to roughly 4%.

    Two things follow. First, the gap between 70% and 4% is the clearest number in this entire literature, and it says the thing teachers most need to hear: returning a graded test without a correction process is close to doing nothing. Second, the student who comes up after class and argues that question 14 was unfair is not being difficult. High confidence plus a wrong answer is the configuration most likely to produce durable learning. Argue back, with evidence.

    Stated honestly: these were college undergraduates, in a lab, answering trivia. Samples ran from 25 to 45 people per experiment. The mechanism is about confidence and attention rather than age, so it is reasonable to expect it to transfer to a fifteen-year-old and a unit test. The exact percentages are not yours to quote as classroom results.
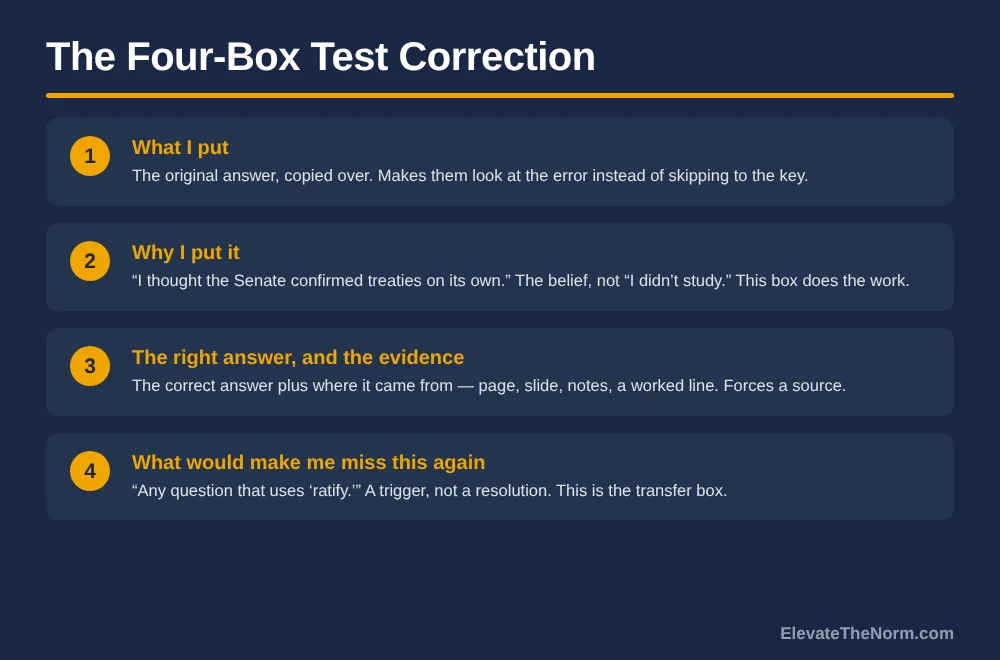
    Four numbered boxes of a test correction form: what I put, why I put it, the right answer and where it came from, and what would make me miss this again
    Box 2 is the one that makes copying an answer off a neighbour useless.

    So Why Don’t Test Corrections Always Work?

    Because when looking at the feedback is optional, most students don’t — and the ones who need it most are the least likely to. This is the finding that should change what you build, and it comes from the largest secondary-school sample in this article.

    Ulrich Maier and Christian Klotz analyzed log data from a digital formative assessment system used in German schools, published in Contemporary Educational Psychology in 2025. The scale is unusual: 2,826 students across 182 secondary classrooms in grades 5 through 11, covering 20,058 formative assessment cases collected between 2020 and 2024. After each assessment the system offered a detailed error feedback page explaining what went wrong.

    What students did with it:

    • They opened the error feedback page in only 44% of cases. In the majority of assessments, nobody looked at the explanation at all.
    • Among those who opened it, the median number of error items reviewed was one. The average was 1.74, roughly half of the errors available to them.
    • Prior knowledge was by far the strongest predictor of whether a student looked. Higher scorers were dramatically more likely to seek feedback. The authors state the paradox plainly: low-achieving students tend to ignore elaborated feedback, despite being the group most likely to benefit from it.
    • Students who thought they had passed were more likely to open the feedback than students who thought they had failed — even when the confident ones had actually failed.

    That is a digital platform rather than a paper test, and German secondary schools rather than American ones, so the exact rates will not be yours. But the shape of it will be. Optional reflection is self-selecting, and it selects for the students who already understand the material. Any correction process you design has to assume the student who most needs it will skip it unless the structure does not permit skipping.

    The Reflection Sheet Is Not the Intervention

    A form that asks students to reflect does not, on its own, produce reflection. There is a direct test of this.

    Raechel Soicher and Regan Gurung studied “exam wrappers” — short reflection sheets students complete after a returned exam about how they studied and what they will change. Published in Psychology Learning & Teaching in 2017, the study randomly assigned 86 students to three conditions: real exam wrappers with metacognitive instruction, sham wrappers with no instruction, or a control group. There were no improvements in exam performance, final grades, or measured metacognitive ability. Scores on the Metacognitive Awareness Inventory rose over the semester in every condition, including the control, which is a reminder of what happens to an uncontrolled before-and-after comparison.

    The authors suggest the effect may require use across multiple courses rather than one. Fair. But the practical lesson for a secondary teacher is immediate: if your test correction process is a sheet of reflection prompts stapled to the front, you have bought the packaging and not the thing. The questions that produce learning are about the specific item — this question, this error, this misconception — not about study habits in general.

    A Four-Part Test Correction That Produces Thinking

    Each wrong answer gets four boxes. Not three, and not six. This is the smallest structure that makes transcription impossible.

    BoxWhat the student writesWhy it is there
    1. What I putThe original answer, copied over.Makes them look at the error rather than skipping straight to the key. Takes five seconds.
    2. Why I put it“I thought the Senate confirmed treaties on its own.” A sentence naming the belief, not “I didn’t study.”This is the box that does the work. It is also the one students resist, because it requires admitting what they believed.
    3. The right answer, and the evidenceThe correct answer plus where it came from — page, slide, notes, a worked line.Forces a source. A student who cannot find it does not understand it yet, and now you both know.
    4. What would make me miss this again“Any question that uses ‘ratify.’” A trigger, not a resolution.Transfer. The point is the next question of this type, not this question.

    Box 2 is the one people cut when they are short on time, and it is the only one that distinguishes this from an answer key. “Careless mistake” is not an acceptable entry in box 2 more than once per test; if a student writes it three times, the pattern is the finding and it is worth a two-minute conversation.

    For a free-response or math item, box 3 becomes “the first line where it went wrong,” which is more useful than reworking the whole problem and usually faster.
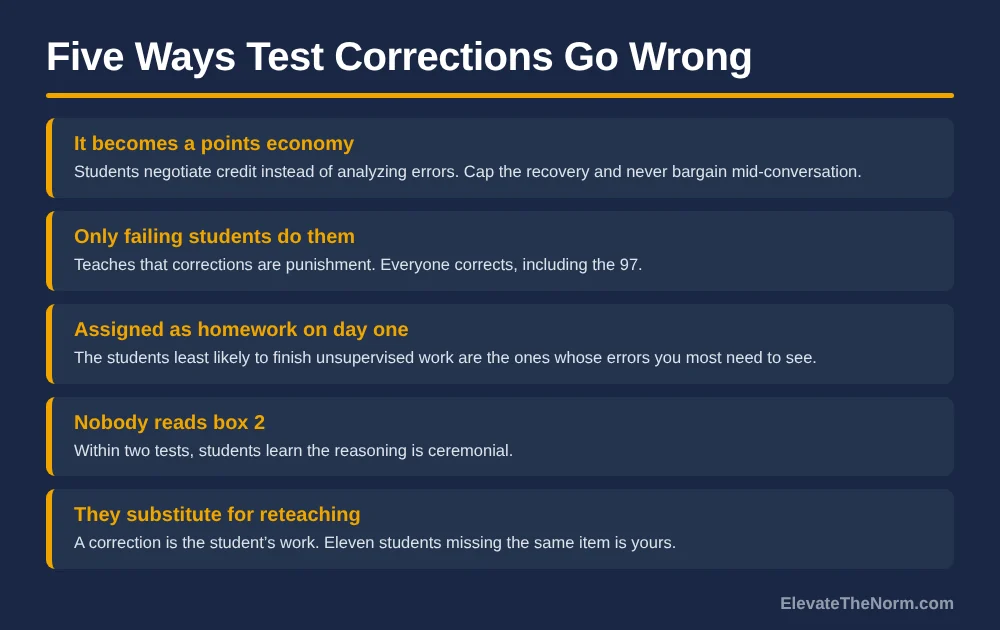
    List of five ways test corrections go wrong, including becoming a points economy and only failing students completing them, each with a fix
    Each of these turns a correction into paperwork.

    How Much Credit Should Test Corrections Be Worth?

    Enough that students do them, little enough that the grade still means something. Half the missed points back is the common answer and it is defensible. So is a flat cap — corrections can move a score up to a 79 and no further. Credit for corrections holds up for the same reason most extra credit arrangements do not — the points still measure the learning the grade claims to report.

    Three things to settle before you announce it:

    1. Check your district’s grading policy first. Many boards have adopted language about reassessment, grade replacement, and minimum scores. A teacher-invented points-back scheme that conflicts with board policy is a problem that has nothing to do with pedagogy, and you will lose that argument in March rather than in September.
    2. Write it down and hand it out. Parents are reasonable about a policy that exists and furious about one that appears to change by student. “Up to half the missed points, corrections due within one week, box 2 must be completed” fits on an index card.
    3. Decide whether a correction can raise an A. The honest answer is yes. A student who got a 97 has three errors worth understanding, and excluding the strongest students from the only reteaching structure in the class is backwards. If credit is the only incentive you have, offer the strongest students the thing they actually want: the correction counts, and it gets read.

    A note on what this does to your gradebook. If corrections replace scores rather than adding points, you are most of the way to standards-based grading already, and you should read the honest case against it before you commit, because the implementation problems there are real.

    Test Corrections or a Retake — Which One Do You Need?

    A correction analyzes the test the student already took. A retake is a new assessment of the same material. They answer different questions and they are not substitutes.

    If the retake half is the part you are still arguing about, the evidence on whether students should be allowed to retake tests — including where it cuts against the practice — is worked through separately, with a policy you can hand to an administrator.

    • Use corrections when the errors are scattered. A 71 made of eleven different small mistakes is a diagnosis problem. Corrections surface the pattern.
    • Use a retake when the student did not know the material. A 44 does not have a pattern to find. It has a hole, and corrections on a test you did not understand is just copying.
    • Use both, in order, when the stakes are real. Corrections first, as the price of admission to the retake. It is a reasonable gate and it stops the retake from being a free second roll of the dice.

    Sequencing them that way also solves a fairness problem administrators raise: if a retake is available to anyone who asks, the students who ask are the students whose families know to ask. Requiring the correction makes the path the same for everybody.

    What About the Student Who Just Copies the Right Answer?

    Assume this will happen and build so it does not pay. Box 2 is most of the defence — you cannot copy someone else’s misconception off their paper, because it was not your misconception.

    Beyond that the answers are ordinary. Do corrections in class, not as homework, at least the first few times — so you see the thinking happen and so students without a quiet place to work are not disadvantaged. Spend two of those minutes circulating and asking one student per row to explain box 2 out loud.

    The Grading Burden, Honestly

    If you teach 150 students and read four boxes on every missed item, you will stop doing this by October. Anyone who tells you otherwise has not graded a stack of 150.

    Three ways to make it survivable:

    • Cap it. Students correct their five worst items, not all of them. Five is plenty for a pattern and it bounds your reading.
    • Score box 2 only, and score it pass/fail. A complete, specific sentence gets the credit. A blank or “I didn’t study” does not. You can do that at a glance.
    • Read them as a class set, not as individual papers. Sort the box-2 responses into piles by misconception. Five minutes of sorting tells you what to reteach tomorrow, which is the only reason to collect them at all.

    That last one is also the answer to a coach’s question: the evidence of learning is not the corrected test. It is what you teach differently on the next item of that type, and whether the same misconception shows up again on the unit after this one. If it does, the corrections were decoration. The habit of asking that question after an assessment is the same one behind any serious approach to checking for understanding.

    What Does This Look Like From a Student’s Seat?

    It looks like being asked to write down, on paper, in your own handwriting, the thing you were wrong about. That is harder than it sounds at fifteen, and it is worth naming out loud the first time you assign it.

    Say the thing directly: this is not a punishment, everyone does it including the people who scored highest, and nobody is reading box 2 to laugh at you. Then make that true. A correction process where the teacher reads a student’s misconception back to them in front of the class is a process that will be filled in with nothing real by Thanksgiving.

    Students should also be able to argue. If a student’s box 2 says “I put B because the question says ‘primarily,’ and both A and B are true,” they may be right and the item may be bad. Give points back when they are. A correction process in which the teacher is never wrong is one the students will correctly read as theatre.

    And handle accommodations through the plan, not through the policy. A student with extended time or a scribe on the test has the same entitlement on the correction. A student with a processing or writing accommodation can answer box 2 out loud to you in ninety seconds; the requirement is the thinking, not the handwriting. The plan governs, and designing the correction so that honoring it looks ordinary is easier than making an exception every time.

    Where Test Corrections Go Wrong

    • They become a points economy. Students negotiate credit instead of analyzing errors. Fix: cap the recovery and never bargain over it mid-conversation.
    • Only failing students do them. Which teaches that corrections are what happens when you mess up, rather than what everyone does with a returned test. Fix: everyone corrects, including the 97.
    • They are assigned as homework on day one. The students least likely to complete unsupervised work are the students whose errors you most need to see — the same self-selection Maier and Klotz measured.
    • Nobody reads box 2. If the teacher never responds to the reasoning, students learn within two tests that the reasoning is ceremonial.
    • They substitute for reteaching. A correction is the student’s work. If eleven students missed the same item, that is your work.

    What to Do Next

    Take the next test you are about to hand back and do three things. Require corrections from every student, not just the ones who failed. Make box 2 — why I put it — mandatory for credit, and refuse “careless mistake” as a repeat answer. Then sort the box-2 responses into piles before you plan tomorrow, because that pile is the most honest data you will get all unit.

    The deeper argument here is not about points. It is that a test handed back and filed away teaches a teenager that a wrong answer is a verdict, and a test corrected teaches them it is information. That is the same case the site makes about learning from mistakes everywhere else, and it is the reason a correction belongs in the student’s hands rather than the gradebook — which is also the argument for student self-assessment as a routine rather than an event.

    Corrections only work if the student can check an answer against something, which is why I would not run them on a test without a key. The midterm library at Mid-Terms.org has 200 free printable exams for grades 6–12, every one with an answer key, across Social Studies, ELA, Math and Science.

    Test corrections are retrieval practice after the fact. Running the same mechanism before the test is cheaper, and the study skills research explains why a few minutes of closed-notes recall beats an hour of rereading.

    Before you go: grab the free The Test Correction Sheet and Policy Card (2 pages) (PDF) — ElevateTheNorm.com branded, printable, no email required.

    Frequently Asked Questions

    What are test corrections?

    Test corrections are a required second pass over a returned test in which the student states the right answer and explains why their first answer was wrong. Naming the error, not just the answer, is the whole practice. Without that explanation, corrections become a transcription exercise that raises the grade without reteaching anything.

    Should test corrections be optional?

    No. When reviewing errors is optional, most students skip it, and the lowest scorers skip it most. In one study of 20,058 assessments from 2,826 students in grades 5 to 11, students opened the detailed error feedback in only 44 percent of cases. A correction process has to be built so the students who need it cannot quietly opt out.

    Do test corrections actually work?

    The underlying mechanism is well supported. Metcalfe’s 2017 review in the Annual Review of Psychology concludes that errorful learning followed by corrective feedback beats error avoidance, and in one lab study errors were corrected on a later test about 70% of the time with feedback against roughly 4% without it. The complication is compliance. In a study of 20,058 assessments by 2,826 students in grades 5–11, the error feedback page was opened in only 44% of cases. Corrections work. Optional corrections mostly do not.

    How much credit should test corrections be worth?

    Enough that students do them and little enough that the grade still means something. Half the missed points back is the common answer and it is defensible; so is a flat cap that lets corrections raise a score to a 79 and no further. Check your district’s grading and reassessment policy before you announce anything, write the policy down, hand it out, and do not vary it by student.

    What is the difference between test corrections and a retake?

    A correction analyzes the test the student already took. A retake is a new assessment of the same material. Use corrections when the errors are scattered — a 71 made of eleven small mistakes is a diagnosis problem. Use a retake when the student did not know the material, because corrections on a test you did not understand is just copying. When the stakes are real, use both in order and make the completed correction the price of admission to the retake.

    How do I stop students from just copying the right answer?

    Require a box that asks why they put what they put — the belief, not "I didn’t study." You cannot copy somebody else’s misconception off their paper, because it was not your misconception. Beyond that, do the first few rounds in class rather than as homework so you can see the thinking happen, and ask one student per row to explain that box out loud.

    Should students who got an A do test corrections?

    Yes. A student who scored 97 has three errors worth understanding, and excluding your strongest students from the only reteaching structure in the class is backwards. It also fixes a dignity problem: if only failing students correct, corrections become what happens when you mess up rather than what everybody does with a returned test.

    How do I grade test corrections for 150 students?

    Cap it at the five worst items per student, score only the reasoning box and score it pass/fail at a glance, and read the set as a class rather than as individual papers — sort the responses into piles by misconception. Five minutes of sorting tells you what to reteach tomorrow, which is the only real reason to collect them. If you are reading four boxes on every missed item for 150 students, you will stop doing this by October.

    Is there a free test corrections template?

    Yes — the two-page PDF linked on this page. Page 1 is the student sheet with three blocks of the four-box correction. Page 2 is a policy card to fill in and staple to the first test of the term, plus a sorting sheet for reading the set as a class. Free, printable, no email address required.

    What should a student actually write in the "why I put it" box?

    A sentence naming the belief that produced the wrong answer — "I thought the Senate confirmed treaties on its own" rather than "I rushed" or "careless mistake." Careless mistake is acceptable once per test. Written three times it is itself the finding, and worth a two-minute conversation. Students should also be allowed to argue: if the box says the item was ambiguous and they are right, give the points back. A correction process in which the teacher is never wrong is one students will correctly read as theatre.

    Sources

    1. Metcalfe, Janet. “Learning from Errors.” Annual Review of Psychology, vol. 68, 2017, pp. 465–489. Review concluding that error avoidance “appears to be the rule in American classrooms” and that errorful learning followed by corrective feedback is beneficial; that corrective feedback “including analysis of the reasoning leading up to the mistake” is crucial; and recommending that educators allow students to commit and correct errors in low-stakes situations. A review of laboratory evidence, not a classroom trial. https://www.annualreviews.org/content/journals/10.1146/annurev-psych-010416-044022
    2. Metcalfe, Janet, and Bridgid Finn. “People’s Hypercorrection of High-Confidence Errors: Did They Know It All Along?” Journal of Experimental Psychology: Learning, Memory, and Cognition, vol. 37, no. 2, 2011, pp. 437–448. Three experiments, 25–45 participants each. High-confidence errors corrected at roughly 82% on the final test; overall recall with feedback about 70%; correction without feedback roughly 4%. College undergraduates answering general-knowledge questions in a laboratory, not secondary students on a unit test. https://pmc.ncbi.nlm.nih.gov/articles/PMC3079415
    3. Maier, Ulrich, and Christian Klotz. “Students Ignore Their Mistakes: Elaborated Error Feedback Processing in a Digital Learning System.” Contemporary Educational Psychology, vol. 82, 2025, article 102395. Observational log analysis of 20,058 formative assessment cases from 2,826 students across 182 secondary classrooms, grades 5–11, 2020–2024. Error feedback opened in 44% of cases; median one error item reviewed; 51% of available errors reviewed on average; prior knowledge the strongest predictor of feedback seeking. Observational, German secondary schools, a digital grammar application rather than a paper test. https://www.sciencedirect.com/science/article/pii/S0361476X25000608
    4. Soicher, Raechel N., and Regan A. R. Gurung. “Do Exam Wrappers Increase Metacognition and Performance? A Single Course Intervention.” Psychology Learning & Teaching, 2017, pp. 64–73. 86 students randomly assigned to exam wrappers, sham wrappers, or control. No improvement in exam performance, final grades, or Metacognitive Awareness Inventory scores; MAI rose in all conditions including control. University students, single course. https://liberalarts.oregonstate.edu/biblio/do-exam-wrappers-increase-metacognition-and-performance-single-course-intervention
    5. Rice, Bethany S. “How Extra Credit Quizzes and Test Corrections Improve Student Learning While Reducing Stress.” ASEE 127th Annual Conference & Exposition, 2020. Average exam scores rose 5% (2018) and 3% (2019) when corrections were offered; 80% of students participated; survey responses strongly favourable. Cited as a descriptive classroom report, not a controlled study: no comparison group, 31 survey respondents, university engineering technology students. https://peer.asee.org/how-extra-credit-quizzes-and-test-corrections-improve-student-learning-while-reducing-stress.pdf
    6. McDade, Margaret. “Using Test Corrections as a Learning Tool.” Edutopia, George Lucas Educational Foundation. A high school math teacher’s small-group correction routine, with retesting for full credit rather than partial credit on corrections. Cited as practice knowledge: the article reports a teacher’s own method and cites no studies. https://www.edutopia.org/article/test-corrections-high-school-math/
    About Clay Shumate

    Clay Shumate is a certified secondary Social Studies teacher in the public schools of West Alabama, with seven years of classroom experience, a B.A. in History, and an M.Ed. in Secondary Education. He writes about project-based learning, student responsibility, respect, and practical ways to hold young people to a higher standard while giving them room to learn from mistakes. He is a member of the Society of Professional Journalists and writes to its Code of Ethics; this site’s editorial standards and corrections policy are published in full. More about Clay.

  • Late Work Policy: What the Evidence Supports After the Famous Study Was Retracted

    Late Work Policy: What the Evidence Supports After the Famous Study Was Retracted

    By Clay Shumate

    A late work policy decides two separate things: what happens to the grade, and what happens to the student. Most policies collapse those into one number and then stop working. The evidence does not hand you a clean answer, and the study most often quoted in these arguments was retracted in September 2026 — which is the first thing anybody writing a policy this year should know.

    Below is what the research actually supports, what it does not, and a six-part policy you can write on one page and still defend in a parent meeting.

    Key Takeaways

    • The famous deadline study is gone. Ariely and Wertenbroch’s 2002 paper on spaced deadlines was retracted on 2 September 2026. A 124-person replication found no effect of deadline condition on any outcome measure.
    • Loosening grading has not been shown to help students. Students assigned to stricter-grading teachers scored higher in math — in that class and in later ones — across every subgroup studied.
    • Removing late penalties has a measured cost. In one high school chemistry class, homework completion fell by more than a third.
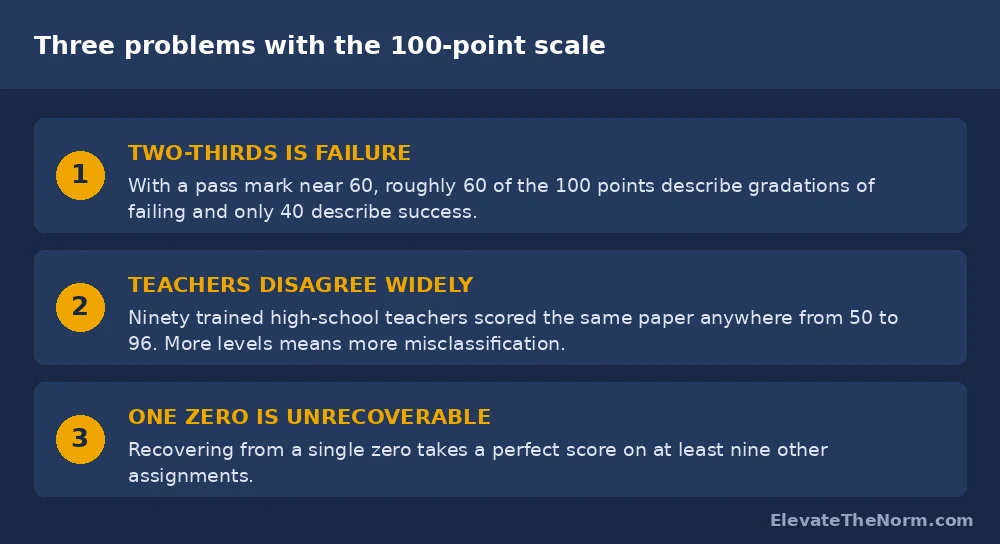
    • The zero is a math problem before it is a policy problem. On a 100-point scale, the gap between passing grades is 10 points and the gap from D to F is 60.
    • The deeper issue is the scale and the averaging, not the zero. Research supports grading scales with four to seven levels for reliability; the 100-point scale invents precision that is not there.
    • Separate the grade from the behavior. Report lateness as conduct and let the grade report what the student knows. That one move resolves most of the argument.

    Free Download · PDF

    The One-Page Late Work Policy and Window Log (2 pages)

    Page 1 is the six-part policy to fill in, the practice-versus-assessment split, and the sentence to give a parent. Page 2 is the window log that turns the policy into information, plus the honest cost of all three common policies.

    Download the free PDF

    Free. No email address required. Designed for grades 6–12. Browse every printable in Your Free Library.

    Why Is a Late Work Policy So Hard to Get Right?

    Because a grade is being asked to do two jobs at once, and they conflict.

    Job one is reporting what a student knows and can do. Job two is enforcing a deadline. A 10-percent-per-day deduction does job two by corrupting job one: after five days the number on the report card is half knowledge and half calendar, and nobody reading it — not the next teacher, not a parent, not the student — can tell which half is which.

    A zero does job two harder and job one worse. And the people on the other side of the argument are not making a soft case. The claim that deadlines do not matter has a measured cost attached, which is the part that usually goes missing in articles about this.

    So the honest version of the problem is not “should kids face consequences.” It is: how do you keep the deadline real without making the grade lie?

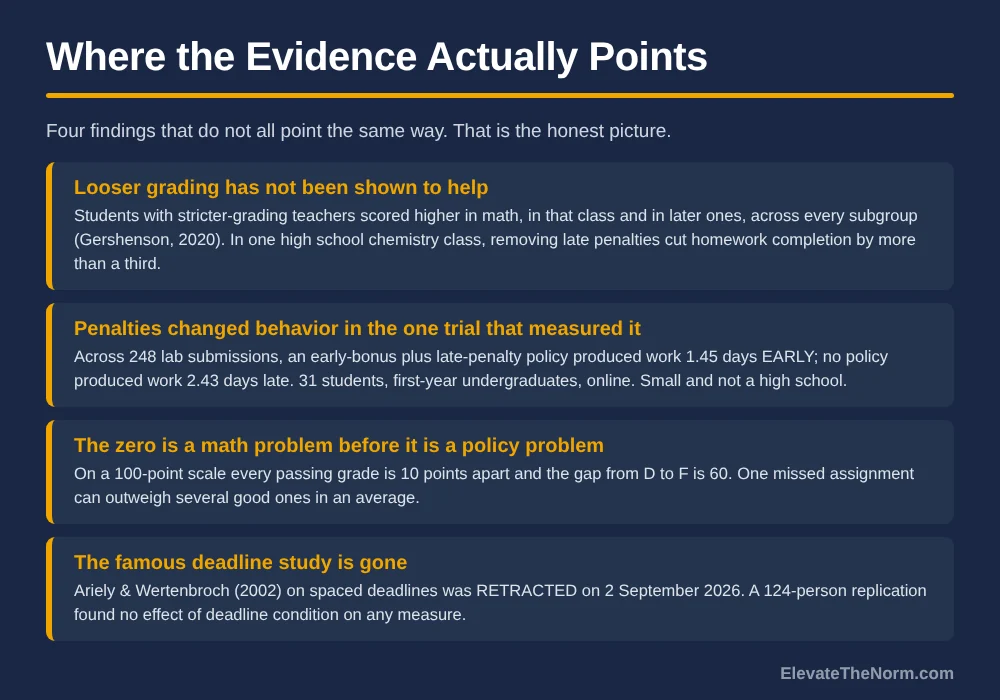
    Four evidence findings on late work policy: stricter grading linked to higher math scores and a one-third drop in homework completion when late penalties were removed, a small undergraduate trial where an early-bonus plus late-penalty policy produced work 1.45 days early, the arithmetic problem of a zero on a 100-point scale, and the September 2026 retraction of the Ariely and Wertenbroch deadline study
    Four findings that do not all point the same way. That is the honest picture.

    What Does the Research Actually Say About Deadlines?

    Less than you have been told, and one widely quoted finding has been formally withdrawn.

    For twenty years, the standard citation for “students do better with evenly spaced interim deadlines” has been Ariely and Wertenbroch (2002) in Psychological Science. You have probably read it quoted in a PD slide deck. It was retracted on 2 September 2026.

    The retraction is not a technicality. Data Colada’s analysis of Study 2 found eighteen of twenty participants in one condition had exact duplicates across all three tasks, correlations that should have been strong were absent, and self-reported times showed almost none of the rounding that real human responses show. Their conclusion was that the data were “severely tampered with or fabricated.” Coauthor Klaus Wertenbroch stated that “much or all of the data — and therefore the results — are false.”

    A pre-registered replication by Hyndman and Bisin, published in 2025 with 124 participants across three deadline conditions, found no statistical evidence that performance was influenced by the deadline condition on any of three measures — errors found, days late, or payment, all p > 0.1. The original had reported all differences significant at p < 0.01. The replication authors concluded that the received wisdom about spaced deadlines limiting procrastination is “possibly false.”

    Two things follow. First, if your department’s late work policy was built on that study, it needs a different foundation. Second — and this is the part worth holding onto — the retraction says nothing about whether deadlines matter in a classroom. It says one famous laboratory result about self-imposed versus imposed deadlines cannot be relied on. Interim checkpoints on a long project may still be good practice. They just are not evidence-backed in the way everyone has been saying.

    Does Removing Late Penalties Hurt Students?

    There is real evidence that looser grading costs something, and it deserves to be stated as plainly as the case for reform usually is.

    Gershenson’s work on high school math found that students with tougher-grading teachers scored higher in math, both in that teacher’s class and in subsequent math courses, and that this held across every student subgroup. Figlio and Lucas found the same direction at elementary level: students assigned to stricter graders showed greater test-score growth in reading and math. In one high school chemistry class where late penalties were removed, homework completion dropped by more than a third.

    The strongest single trial on late policies specifically is small and not from a high school. Korpusik, Freitas and Dionisio compared four late policies across 248 lab submissions in an introductory programming course. Work came in 2.43 days late under no policy, 4.71 days late under an early-completion bonus alone, 0.44 days late under a late penalty, and 1.45 days early under a combined early bonus and late penalty — which also produced the highest grades. Their read was that late penalties externally regulate students who have not yet regulated themselves.

    Size that evidence honestly before you use it: 31 students who consented to the analysis, mostly first-years, taught online during the pandemic. It is a signal, not a mandate. But it points the same direction as the grading-strictness work, and a teacher who ignores both because the conclusion is unfashionable is doing the thing this site complains about when it goes the other way.

    Does It Matter What the Assignment Was For?

    More than any other question here, and most policies never ask it.

    If the work was practice — a problem set, a draft, a reading check whose job was to tell you what to reteach — then late is a timing failure with a real instructional cost, because the information arrived after you needed it. The honest response is to collect it, use it, and record the lateness as conduct. Scoring it down does not recover the information.

    If the work was the assessment — the essay, the project, the unit test — then the deadline is doing something different. It is the point at which you are claiming to know what the student can do. Here a window still makes sense, but a narrow one, and after it closes the student demonstrates the standard some other way rather than handing in the same artifact in December. What that other way should be, and whether a second attempt at the assessment itself belongs in the policy, is a separate decision with its own evidence behind it.

    Running one blanket rule over both is why so many late work policies feel wrong in practice. A missing formative check and a missing final project are not the same event and should not get the same sentence.

    So Why Not Just Give Zeros?

    Because of arithmetic, not sentiment.

    Reeves laid this out in Phi Delta Kappan. On a standard 100-point scale with letter grades at 10-point intervals, every passing grade sits 10 points from its neighbor — and the interval between D and F is not 10 points but 60. A single zero therefore carries roughly six times the weight of any other failing mark in an average. Reeves’s point is that if an F is one interval below a D, the mathematically consistent value is 50, not 0. On a 4-point scale nobody hesitates: missing work gets a 0, exactly one point below a 1. The same logic on a 100-point scale would require a –6, which no one would give. What happens when a school turns that argument into a standing rule — and the five conditions that decide whether it works — is covered in the policy built on top of this arithmetic.

    Guskey, Fisher and Frey take that further in Educational Leadership, and their version is the one to carry into a faculty meeting: “The true problem is not the zero; it’s the use of the 100-point percentage grading scale and the practice of averaging scores.” They point out that the problems with percentage scales have been documented since Starch and Elliott in 1913, and that research supports scales with four to seven levels for optimal reliability and discrimination. A 101-level scale manufactures precision nobody can actually defend.

    That reframing matters for a late work policy because it tells you where the real fix is. Arguing about whether a missed assignment is a 0 or a 50 is arguing about a symptom. If your gradebook averages percentages across a semester, a single missed assignment distorts the picture no matter which number you put in the box.

    If this is live at your school, the fuller version of that argument is in the standards-based grading guide, and the honest case against it is in why standards-based grading doesn’t work. Both are worth reading before anyone proposes a schoolwide change. For the conversion math, see the 1-4 grading scale chart with percentages.

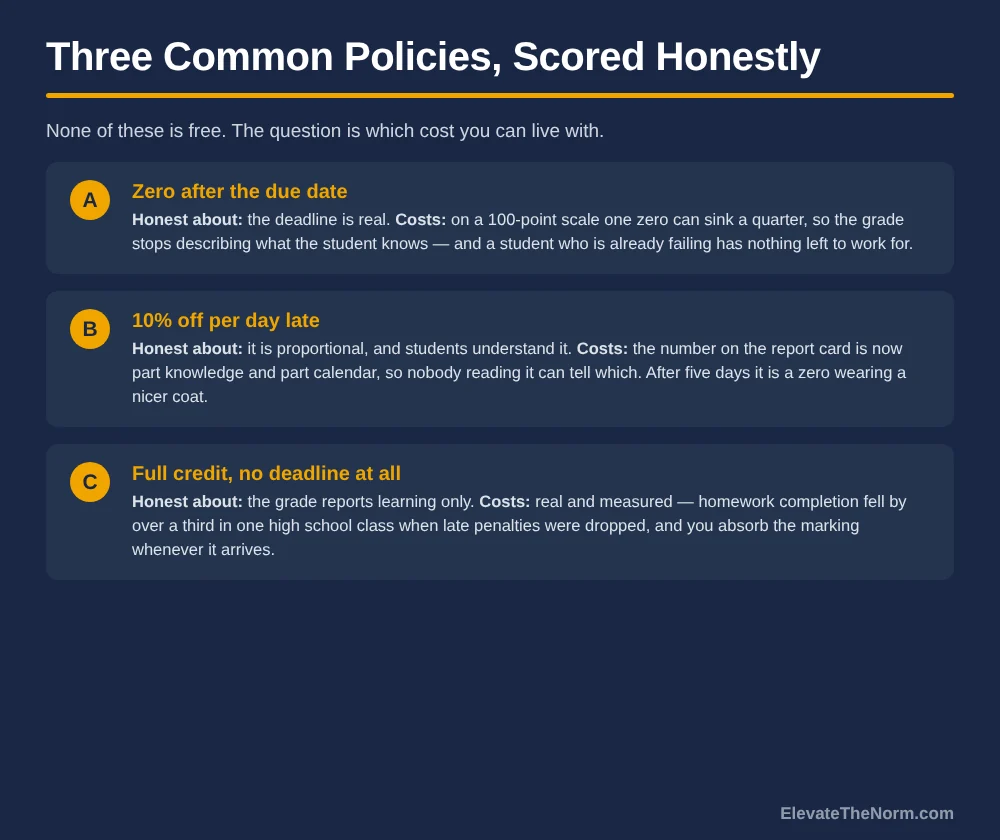
    Comparison of three common late work policies with honest costs: a zero after the due date, ten percent off per day late, and full credit with no deadline, each listed with what it is honest about and what it costs
    None of these is free. The question is which cost you can live with.

    What Does a Workable Late Work Policy Look Like?

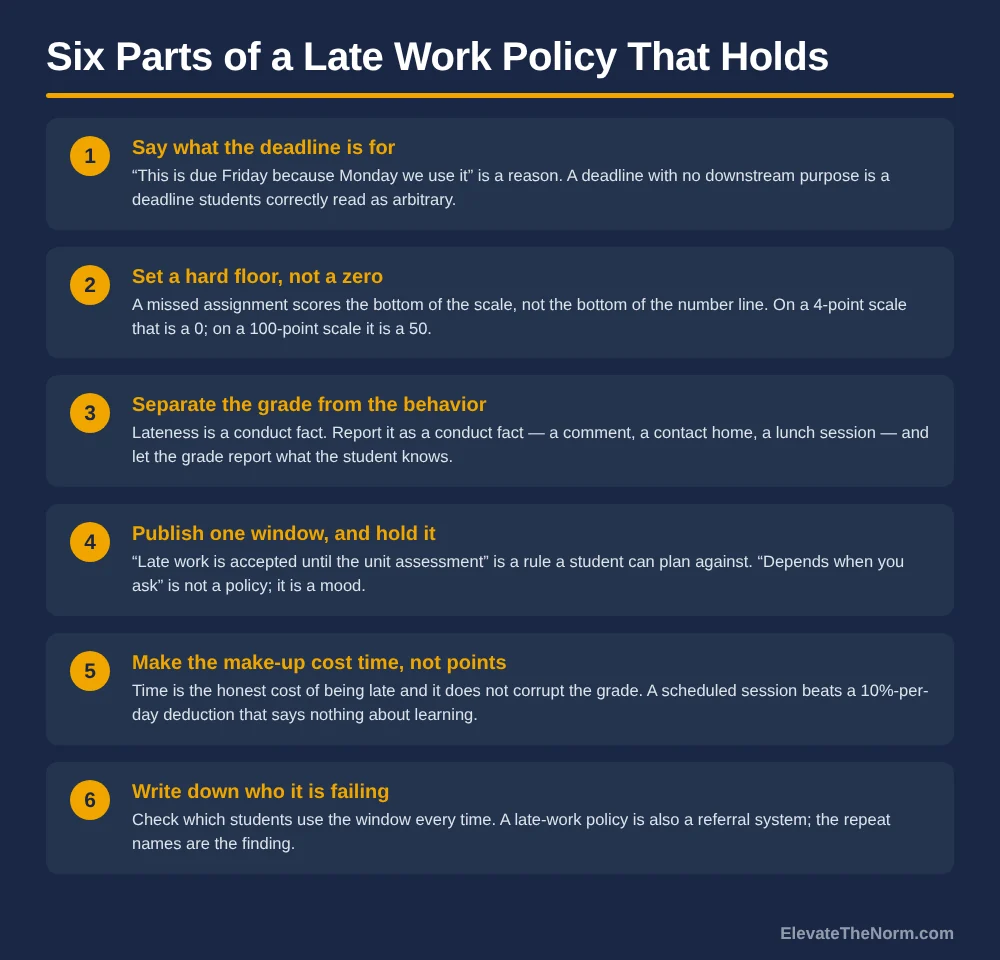
    Six parts. It fits on one page, and every part of it survives a parent asking why.

    Six numbered components of a workable late work policy: state what the deadline is for, set a hard floor instead of a zero, separate the grade from the behavior, publish one window and hold it, make the make-up cost time rather than points, and record which students keep using the window
    Six parts, and the sixth one turns the policy into information.

    1. Say what the deadline is for

    “This is due Friday because on Monday we build on it” is a reason. “Because I said Friday” is not, and teenagers are unusually good at telling the difference. A deadline with a downstream purpose gets taken seriously by more students than a deadline without one, and it also tells you which deadlines you should actually defend. If nothing depends on Friday, Friday was arbitrary and you should stop pretending otherwise.

    2. Set a hard floor, not a zero

    A missed assignment scores the bottom of the scale, not the bottom of the number line. On a four-point scale that is a 0. On a 100-point scale it is a 50. The point is not generosity; it is that the floor should be one interval below the lowest passing mark, which is what every other grade boundary already is.

    3. Separate the grade from the behavior

    This is the move that resolves most of the argument, and it costs nothing. Lateness is a conduct fact. Report it as one — a comment on the report, a contact home that happens the same week, a scheduled session — and let the grade report what the student knows. A parent who is told “she understands this material and she has turned in four assignments late” has two usable pieces of information. A parent told “she has a 61” has none.

    4. Publish one window and hold it

    “Late work is accepted until the unit assessment” is a rule a fourteen-year-old can plan against. “Depends when you ask me” is not a policy, it is a mood, and students read inconsistency as unfairness faster than they read strictness as unfairness. Pick a window, write it in the syllabus, and then do exactly what you said — which is the whole of respecting students in practice rather than on a poster.

    5. Make the make-up cost time, not points

    Being late should cost something. Time is the honest currency: a scheduled session at lunch, before school, or during an intervention block. It is a real cost, students feel it, and it leaves the grade intact. A ten-percent-per-day deduction costs them something too — the accuracy of the transcript.

    6. Write down who keeps using the window

    Keep a list. Not to punish with — to read. Three students using the late window every single time is not a late work problem, it is a signal about workload, home, organization, or something nobody has asked about yet. A policy that generates that list is doing a second job for free. A policy that just applies a deduction tells you nothing you did not already know. This is the same logic as treating attendance data as a referral system rather than a compliance record. The same read applies to arrival times, where a tiered response sorts the one-off from the pattern in a way a blanket deduction never will.

    One cost this policy does carry, and it should be named rather than buried: an open window produces a flood at the end of it. If the window closes at the unit assessment, expect a stack the night before, and expect it to arrive in the same week you are marking the assessment itself. Two things keep that survivable. Cap what comes back — late work gets a score and a one-line comment, not the full written feedback a punctual draft gets, and say so in advance. And put the make-up session mid-unit rather than at the end, so the work trickles in instead of arriving at once. A policy that quietly doubles your marking in the last week of a unit is a policy you will abandon by Thanksgiving, which is its own kind of unfairness. The workload side of this is not a side issue; it decides whether the policy still exists in March.

    What Does This Look Like From the Student’s Side?

    Clear, and askable in advance. Those are the two things students actually want from a late work policy, and neither is the same as lenient.

    Clear means they can find it. Not buried in a syllabus they signed in August — posted, in nine words, where the due dates are. A student should be able to answer “what happens if I turn this in Monday” without asking you.

    Askable in advance means the policy has a front door. A fifteen-year-old working a closing shift, or watching younger siblings, or without reliable internet at home, usually knows on Tuesday that Friday is not going to happen. Right now most classrooms give that student nothing to do with that knowledge except apologize on Friday. Say out loud, more than once, that asking before a deadline is a different conversation than explaining after one — and then make it true, which means the student who asks on Tuesday gets a straight answer rather than a lecture.

    That is not softness. It is the difference between treating a teenager as someone managing competing obligations, which they are, and treating them as someone who needs catching out. The deadline does not move for the student who never asks. It is just that the student who plans ahead gets something for planning ahead, which is the behavior the whole policy claims to be teaching.

    How Do You Explain This to a Parent Who Thinks It Is Too Soft?

    Lead with what did not change, because something did not.

    The work is still required. The deadline is still real. There is still a consequence, and it is time rather than points. What changed is that the report card now tells you what your child knows instead of telling you a blend of what they know and when they handed it in.

    That sentence survives most objections because it is not a concession, it is a clarification. And it is worth having ready in writing — in the syllabus and in the first message home — rather than improvised on the phone in October. Parents who object to no-zero policies are usually objecting to the version where nothing is required; the fastest way to settle it is to show this is not that version.

    There is a fair version of the objection too, and it should not be waved off. If a student can turn anything in whenever they like, some will discover that and use it, and a policy that pretends otherwise is not being honest. That is precisely why parts 4, 5 and 6 exist: a published window, a real cost in time, and somebody actually watching the list.

    What Does This Mean for a Department or a School?

    Consistency across a hallway matters more than the specific policy chosen.

    A student with six teachers running six different late policies cannot plan, and the student least able to absorb that is the one the policy was supposed to help. If a department can agree on a window and a floor, that is worth more than any individual teacher’s preferred version of either.

    Two cautions for anyone proposing this above the classroom level. A policy that requires teachers to accept unlimited late work without additional marking time is a workload decision disguised as a grading decision, and it will be abandoned by March. And a schoolwide floor applied on top of a 100-point averaging gradebook is, by Guskey, Fisher and Frey’s argument, treating the symptom — worth doing, but not worth calling a reform.

    Two constraints sit above everything on this page, and both of them outrank it.

    Your district may already have a grading policy with the force of board approval. A teacher who unilaterally sets a 50 floor in a district whose policy says otherwise has a problem that has nothing to do with pedagogy. Read the policy before writing yours, and if the two conflict, that is a conversation with an administrator rather than a decision to make quietly in a gradebook.

    And an IEP or 504 plan governs. If a student’s plan includes extended time or modified deadlines, the plan is the policy for that student, full stop — no classroom rule and no research finding on this page overrides it. Build your policy so that honoring a plan looks like the ordinary case rather than a visible exception, which mostly means making the window generous enough that nobody has to be singled out to use it.

    What to Do Next

    Write the policy on one page before the next unit starts. One window. One floor. One sentence saying lateness is reported as conduct, not deducted from the grade. One line about what the make-up session is and when it runs.

    Then put it in the syllabus and in a message home the first week, so that the first time a family hears about it is not after a missed assignment.

    And keep the list. At the end of the first unit, look at who used the window and how often. That list will tell you more about your classroom than the policy itself does. When the missing work has already pushed a student into a failing grade, the next move is the conversation itself — private, specific, and built around one task with a date on it.

    Before you go: grab the free The One-Page Late Work Policy and Window Log (2 pages) (PDF) — ElevateTheNorm.com branded, printable, no email required.

    Frequently Asked Questions

    Is it true that the study everyone quotes about deadlines was retracted?

    Yes. Ariely and Wertenbroch’s 2002 paper in Psychological Science on spaced deadlines and procrastination was retracted on 2 September 2026, after analyses found duplicated observations, missing expected correlations and implausible response patterns in Study 2. One of the coauthors stated that “much or all of the data — and therefore the results — are false.” A 2025 replication with 124 participants found no significant effect of deadline condition on any outcome. If a PD session or a department policy still cites that study, it needs a new basis. It does not mean deadlines are useless — it means that one famous laboratory result cannot be used as evidence.

    Is giving a 50 for work that was never done just a gift?

    It is a scale decision, not a generosity decision. On a 100-point scale every passing grade sits 10 points from the next, and the gap from D to F is 60 — so a zero carries about six times the weight of any other failing mark in an average. A floor at 50 makes the F one interval below the D, which is what every other boundary already is. The work is still missing, the student still has not demonstrated the standard, and the grade still shows a failure. What changes is that one missing assignment can no longer outweigh several completed ones.

    Can a teacher set a 50 floor if the district grading policy says otherwise?

    No, and this should be checked before anything on this page is implemented. Many districts have a board-approved grading policy, and a teacher who quietly overrides it in a gradebook has created a problem that is not pedagogical. Read the policy first. If it conflicts with what you believe is right, that is a conversation to have with an administrator, and the argument from grading-scale reliability is a strong one to bring to it — but it is a conversation, not a unilateral change.

    How does a late work policy interact with an IEP or 504 plan?

    The plan governs, without exception. If a student’s plan provides extended time or modified deadlines, that is the policy for that student and no classroom rule overrides it. The practical design point is to build the general policy so that honoring a plan looks ordinary rather than exceptional — a window generous enough that a student using it is not visibly marked out. If you are unsure how a plan applies to a specific assignment, ask the case manager before the deadline rather than after.

    Should practice work and assessments have the same late policy?

    No, and running one rule over both is why many late policies feel wrong in practice. Practice work — problem sets, drafts, reading checks — exists to tell you what to reteach, so when it arrives late the instructional cost is already paid and scoring it down recovers nothing. Collect it, use it, record the lateness as conduct. An assessment is different: the deadline is the point at which you claim to know what a student can do. Keep a window there too, but a narrow one, and after it closes have the student demonstrate the standard another way rather than submitting the same artifact months later.

    Won’t accepting late work bury me in grading?

    It can, and a policy that ignores that will not survive to March. Two things keep it manageable. Cap what comes back: late work gets a score and a one-line comment rather than the full written feedback a punctual draft earns, and say so in advance so it reads as a stated rule and not as neglect. And schedule the make-up session mid-unit rather than at the window’s close, so work trickles in instead of landing as a stack the night before the unit assessment.

    Does removing late penalties actually hurt students?

    There is real evidence that it costs something, and it should not be waved away. In one high school chemistry class, homework completion fell by more than a third when late penalties were removed. Separately, students assigned to tougher-grading teachers scored higher in math — in that class and in later courses, across every subgroup studied. None of this proves zeros are correct, and none of it is a randomized trial of a specific late policy. What it does say is that “no deadline, no consequence” is a position with measured costs, which is why the policy described here keeps a real cost and moves it from points to time.

    What should a student do if they know in advance they cannot meet a deadline?

    Ask before it, not explain after it — and the teacher’s job is to make that worth doing. A student working a closing shift or caring for siblings usually knows on Tuesday that Friday will not happen. Most classrooms give them nothing to do with that information. Say out loud, more than once, that a request made before a deadline gets a different conversation than an apology made after one, then honor it: a straight answer rather than a lecture. The deadline does not move for the student who never asks. Planning ahead is the behavior the policy claims to be teaching, so it should get something.

    Sources

    1. Retraction notice: Ariely, D., & Wertenbroch, K. (2002), “Procrastination, Deadlines, and Performance: Self-Control by Precommitment,” Psychological Science. Retracted 2 September 2026. The notice cites a replication study and Data Colada analyses that “raised questions about the underlying data” and “called into question the veracity of the overall findings.” Coauthor Wertenbroch is quoted: “much or all of the data — and therefore the results — are false.” https://retractionwatch.com/?p=135929
    2. Data Colada, post 138, on Study 2 of Ariely & Wertenbroch (2002). Eighteen of twenty participants in the Last Day Deadline condition had exact duplicates across all three proofreading tasks, with ID numbers ten positions apart; expected correlations were absent (original task-performance correlations +.03 to +.27 against +.74 to +.90 in replication); self-reported times showed 11.7% rounding against 85% in the replication. Conclusion: the data “were severely tampered with or fabricated.” https://datacolada.org/138
    3. Hyndman, K., & Bisin, A. (2025). Replication of Ariely & Wertenbroch (2002). 124 participants, three randomly assigned deadline conditions (none, evenly spaced, self-imposed), three proofreading tasks over three weeks. No statistically significant effect of deadline condition on errors found (F = 0.181), days late (F = 0.353) or payment (F = 0.215), all p > 0.1. https://bpb-us-e1.wpmucdn.com/wp.nyu.edu/dist/c/16384/files/2025/09/Ariely_Replication-1.pdf
    4. Korpusik, M., Freitas, J., & Dionisio, J. D. N. (2022). “Impact of Late Policies on Submission Behavior and Grades.” ASEE Annual Conference. Loyola Marymount University, introductory programming lab, 248 submissions, 31 students consenting to analysis, mostly first-years, taught online during the pandemic. Average submission timing: no policy +2.43 days, early incentive +4.71, late penalty +0.44, combined −1.45 days (early). Grades 94.2% / 96.6% / 97.1% / 99.5% respectively. Undergraduates, not grades 6–12 — the mechanism may transfer, the numbers do not. https://people.csail.mit.edu/korpusik/asee22.pdf
    5. Guskey, T. R., Fisher, D., & Frey, N. “The Unwinnable Battle Over Minimum Grades.” Educational Leadership (ASCD). Argues minimum-grade floors treat a symptom: “The true problem is not the zero; it’s the use of the 100-point percentage grading scale and the practice of averaging scores.” Cites Starch and Elliott (1913) on percentage-scale problems and Lozano et al. (2008) and Preston and Colman (2000) on four-to-seven-level scales producing optimal discrimination, validity and reliability. https://www.ascd.org/el/articles/the-unwinnable-battle-over-minimum-grades
    6. Reeves, D. B. (2004). “The Case Against the Zero.” Phi Delta Kappan, 86(4). The arithmetic argument: on a 100-point scale the interval between passing grades is 10 points while “the interval between the D and F is not 10 points but 60 points,” making the mathematically consistent value of an F 50 rather than 0. https://www.researchgate.net/publication/285846142_The_Case_against_the_Zero
    7. Thomas B. Fordham Institute. “Think Again: Does ‘equitable’ grading benefit students?” Cited as a review, not as the primary studies. This is where the grading-strictness findings above come from: Gershenson (2020) on high school math students with tougher-grading teachers scoring higher in that class and in later courses across all subgroups; Figlio and Lucas (2004) on elementary test-score growth; and the high school chemistry case in which removing late penalties cut homework completion “by more than one-third.” The review’s own position is that there is no hard evidence that more lenient grading benefits students long term — a contested claim, and presented here as the strongest version of the case against loosening a late work policy. https://fordhaminstitute.org/national/research/think-again-does-equitable-grading-benefit-students

    About Clay Shumate

    Clay Shumate is a certified secondary Social Studies teacher in the public schools of West Alabama, with seven years of classroom experience, a B.A. in History, and an M.Ed. in Secondary Education. He writes about project-based learning, student responsibility, respect, and practical ways to hold young people to a higher standard while giving them room to learn from mistakes. He is a member of the Society of Professional Journalists and writes to its Code of Ethics; this site’s editorial standards and corrections policy are published in full. More about Clay.

  • Socratic Seminar Rubric: A Four-Criterion Version for Grades 6–12

    Socratic Seminar Rubric: A Four-Criterion Version for Grades 6–12

    By Clay Shumate · Updated October 24, 2026

    A Socratic seminar rubric should score four things: preparation, use of the text, how a student treats other people’s ideas, and what they wrote afterward. It should not score how many times somebody spoke. The full rubric is below, free, on this page, with no email to give — and a printable version at the bottom if you want one.

    It comes with an argument, because a rubric that counts talking turns is worse than no rubric at all — and because the research on rubrics is more qualified than the phrase “research-based rubric” suggests.

    Key Takeaways

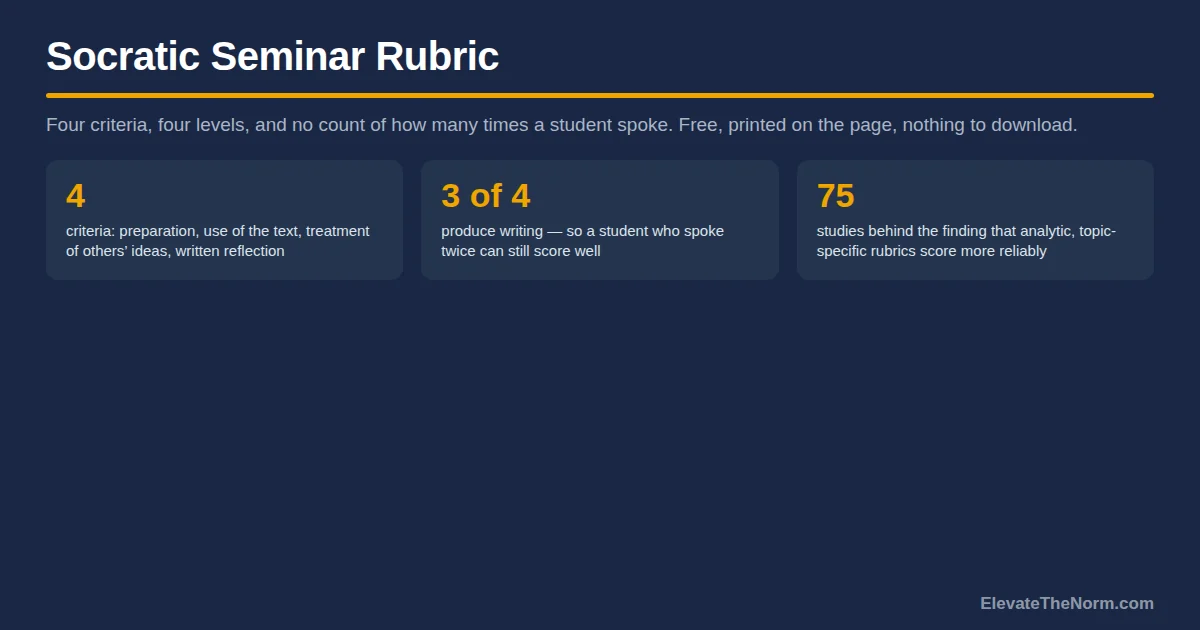
    • Four criteria, four levels, and none of them is participation frequency. Counting comments rewards volume and punishes the students who most need the practice.
    • Most of the score comes from writing, not talking. Preparation before and reflection after are visible, gradeable, and fair to a student who spoke twice.
    • Analytic beats holistic on reliability. A review of 75 studies found scoring agreement improves with analytic, topic-specific rubrics plus exemplars or rater training.
    • Rubrics are not automatically valid. The same review is explicit that a rubric improves agreement between scorers without guaranteeing you are measuring the right thing.
    • You cannot facilitate and score thirty students at once. Anyone who says otherwise is describing a checklist, not an assessment.

    Free Download · PDF

    Socratic Seminar Rubric (Four Criteria)

    The same four-criterion rubric printed above, laid out to print and cut, plus the scoring rotation for thirty students and a student self-score half-sheet.

    Download the free PDF

    Free. No email address required. Designed for grades 6–12. Browse every printable in Your Free Library.

    What Should a Socratic Seminar Rubric Measure?

    The things a student controls, that leave evidence, and that you would still care about if the student were quiet. That test eliminates most of what standard seminar rubrics score.

    Four criteria survive it.

    1. Preparation. Did they read it, mark it, and bring a written question? This is visible before anyone speaks and it is the single best predictor of whether the seminar works.
    2. Use of the text. When they did speak or write, did they point at a specific place in the text, or at a general impression?
    3. Treatment of other people’s ideas. Did they build on, question, or directly respond to a classmate — or deliver a prepared statement into the middle of the circle and stop?
    4. Reflection afterward. Can they name what changed in their thinking and whose comment did it? This one is only answerable by a student who was listening, which is why it is the hardest to fake.

    If your gradebook is standards-based, those four map cleanly onto speaking-and-listening standards without inventing a category: preparation and use of the text are evidence standards, treatment of others’ ideas is a collaborative-discussion standard, and the reflection is usually assessable under both. You do not need a “participation” line item, and if the gradebook has one, these are what should feed it.

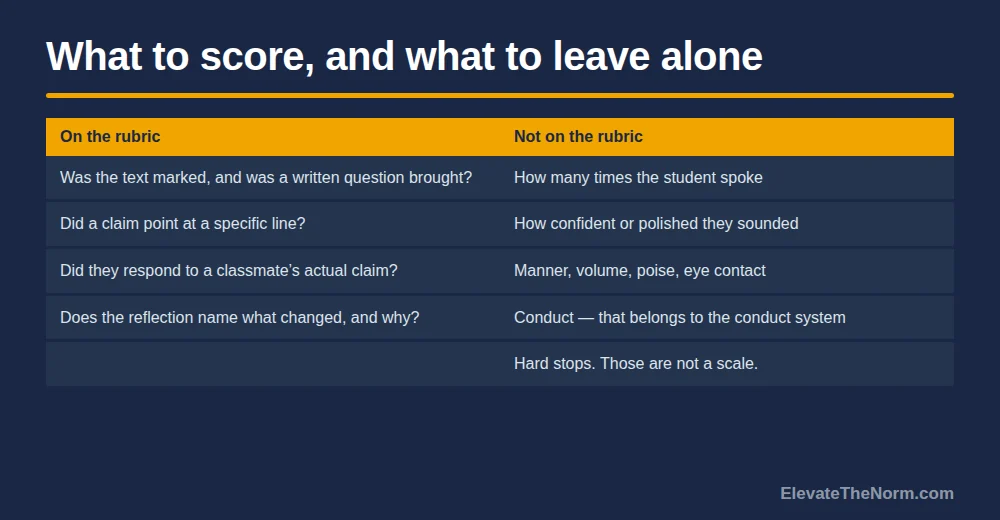
    One caution on the third criterion, and it is the one I would want a department to talk through before adopting any seminar rubric. Norms about interrupting, turn length, directness and how openly you disagree are not universal — they vary by family, by community, and by what a student has been taught is respectful. A rubric that scores “treatment of others’ ideas” can quietly encode one conversational style as the correct one. Keep the descriptors pointed at what the student did with the idea — responded to it, questioned it, built on it — and away from manner, volume and poise. If a descriptor could be satisfied by a confident student who said nothing of substance, it is scoring style.

    Three of those four produce writing. That is deliberate. A rubric whose evidence is mostly written is a rubric you can actually apply after the period ends, and it is a rubric a student who said very little can still score well on.

    The Socratic Seminar Rubric

    Four criteria, four levels, no participation count. Copy it, cut it, change the language to match your school’s scale. It is free, it is printed in full right here, and there is a printable version at the bottom of this page.

    One framing worth saying to students before you hand it over: the level-one column describes something that happened on one day, not a kind of person. A student who arrived without the text marked is a student who arrived without the text marked. If a descriptor reads to a fourteen-year-old like a verdict on their character, rewrite it — that costs nothing and it changes whether they look at the rubric again.

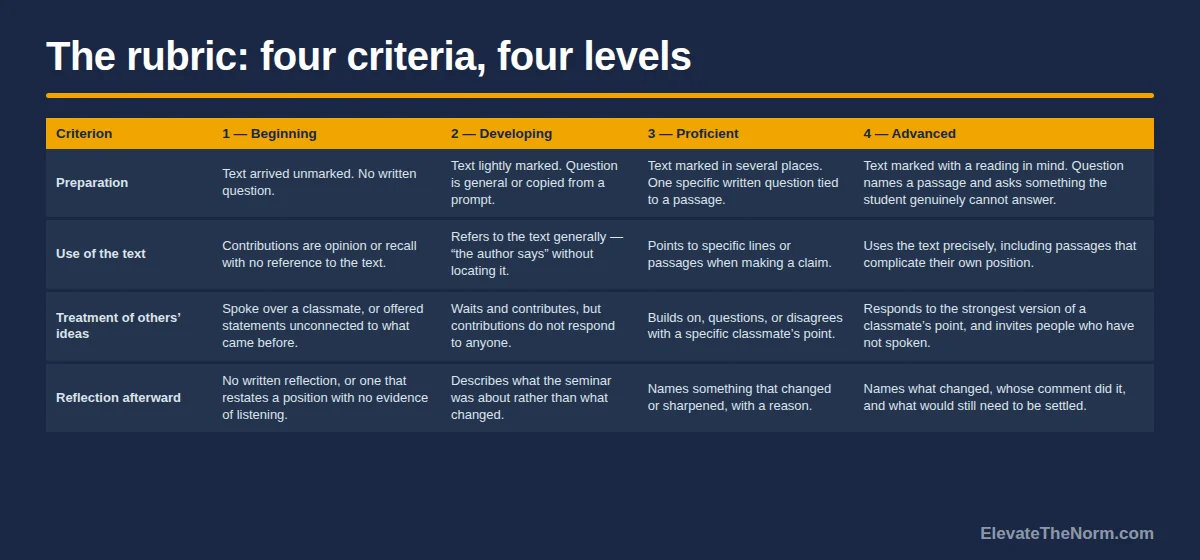
    Four by four Socratic seminar rubric table with criteria for preparation, use of the text, treatment of others' ideas and reflection afterward, each described at beginning, developing, proficient and advanced levels
    The full rubric. The same table is written out below so you can copy it.
    Criterion1 — Beginning2 — Developing3 — Proficient4 — Advanced
    PreparationText arrived unmarked. No written question.Text lightly marked. Question is general or copied from a prompt.Text marked in several places. One specific written question tied to a passage.Text marked with a reading in mind. Question names a passage and asks something the student genuinely cannot answer.
    Use of the textContributions are opinion or recall with no reference to the text.Refers to the text generally — “the author says” without locating it.Points to specific lines or passages when making a claim.Uses the text precisely, including passages that complicate their own position.
    Treatment of others’ ideasSpoke over a classmate, or offered statements unconnected to what came before.Waits and contributes, but contributions do not respond to anyone.Builds on, questions, or disagrees with a specific classmate’s point.Responds to the strongest version of a classmate’s point, and invites people who have not spoken.
    Reflection afterwardNo written reflection, or one that restates a position with no evidence of listening.Describes what the seminar was about rather than what changed.Names something that changed or sharpened, with a reason.Names what changed, whose comment did it, and what would still need to be settled.
    Free to copy, cut and rewrite. No email address. A printable version is linked below.

    Why This Rubric Does Not Count How Often You Spoke

    Because a participation count measures confidence and rewards it, and confidence is not the skill you are teaching. The moment students know comments are scored, you get performances of the right length at the right frequency, and the conversation stops being about the text.

    Two column table contrasting what belongs on a Socratic seminar rubric with what does not, including how many times a student spoke, manner and poise, and conduct
    If a descriptor could be met by a confident student who said nothing of substance, it is scoring style.

    There is a second reason, and it is about who pays. A qualitative study of quiet students — ten undergraduates, so treat it as a description rather than a finding about your seventh period — found that nine of the ten struggled with instructor expectations for verbal participation, and six reported physical reactions when speaking aloud: trembling, blushing, stuttering. One described planning out what they wanted to say before speaking. A frequency count charges those students a fee the loud ones never pay, for a behavior that is not the learning objective.

    Related, and worth checking against your district’s grading policy: criterion three has to stay academic. “Responded to a classmate’s specific claim” is an academic behavior. “Was respectful” is conduct, and in a lot of districts conduct is not permitted inside an academic grade — for good reason. If a student’s behavior in a seminar is a problem, that is the conduct system’s job, handled the way you would handle it on any other day, and not something you fold into a score for a speaking standard.

    This also gives you a clean answer when a parent asks. A quiet student can earn full marks here, because three of the four criteria are about preparation, precision and listening, and none of them requires their child to perform in front of the class. Say that in the same sentence you send the rubric home, before anyone has to ask.

    If your school requires a participation grade, pull it from criteria one and four — both of which are written, both of which are about preparation and listening, and neither of which requires a student to perform. Then say out loud to the class that talking is not scored. The first seminar after they believe you is a different conversation.

    One thing that belongs nowhere on a rubric: the behaviors that are not a continuum. In my room, making fun of how unusual somebody’s name is is a hard stop — not a criterion where a student can earn a 2. A rubric is for things that improve by degrees. Hard stops are a different category, and putting them on a scoring scale quietly suggests there is an acceptable amount.

    Do Rubrics Actually Help?

    They reliably help scoring agreement. Their effect on learning is real, mixed, and badly confounded — and the honest version is more useful than the sales version.

    Jonsson and Svingby reviewed 75 empirical studies on rubrics. Their finding on reliability is clear: scoring “can be enhanced by the use of rubrics, especially if they are analytic, topic-specific, and complemented with exemplars and/or rater training.” Their finding on validity is the one people skip — rubrics do not by themselves make an assessment judgement valid. Two teachers agreeing on a score is not the same as the score measuring the thing you care about.

    Panadero and Jonsson then reviewed 21 studies on using rubrics formatively. Some reported large effects on performance — effect sizes from 0.99 to 1.6 — and others reported little or nothing. The authors are direct about why that range is not as impressive as it looks: “most studies reporting on such improvements have combined the use of rubrics with other instructional interventions.” The rubric usually arrived alongside self-assessment, peer assessment or extended instruction, so the rubric’s own contribution is hard to isolate. They also note that positive effects were more likely in higher education, in interventions lasting several weeks or longer, and when rubrics were paired with metacognitive work.

    What they identify as the mechanism is worth keeping, because it tells you how to use the thing: rubrics work by making expectations transparent, which reduces anxiety, supports feedback, and lets students plan. Students in those studies described using a rubric “much like a recipe or a map.”

    The practical conclusion: hand the rubric out before the seminar, not after. A rubric used as a scoring instrument is a grading tool. A rubric used as a description of what good looks like, given to students in advance, is the version with evidence behind it.

    Analytic or Holistic?

    Analytic, if you want two teachers to agree. That is the clearest single recommendation in the rubric literature, and the rubric above follows it — four separate criteria scored separately rather than one overall impression.

    Jonsson and Svingby list four things that improve scoring agreement, and it is worth reading them as a to-do list rather than a finding: analytic design, topic-specific criteria, exemplars, and rater training. The first two are free and you did them by choosing this rubric. The third costs one seminar — keep two reflections, one strong and one thin, and show students both. Anonymised means actually anonymised — names and identifying details stripped, and the student asked first. A class can usually recognise its own handwriting and its own arguments, and “this is the weak one” is not a thing to do to a student by accident. The fourth matters only if more than one adult is scoring.

    “Topic-specific” is the one worth acting on. A rubric that says “uses evidence effectively” is generic and every scorer fills in their own meaning. Rewriting that row to name what evidence looks like in this text — a line number, a date, a specific claim — takes two minutes and does more for consistency than any amount of descriptor polishing. The same principle runs through the site’s approach to rubrics generally: specific beats elegant.

    How Do You Score Thirty Students in One Period?

    You do not, and the sooner you stop trying the better your seminars get. Facilitating and scoring are two jobs. Doing both means doing the first one badly, and the first one is the one that makes the seminar work.

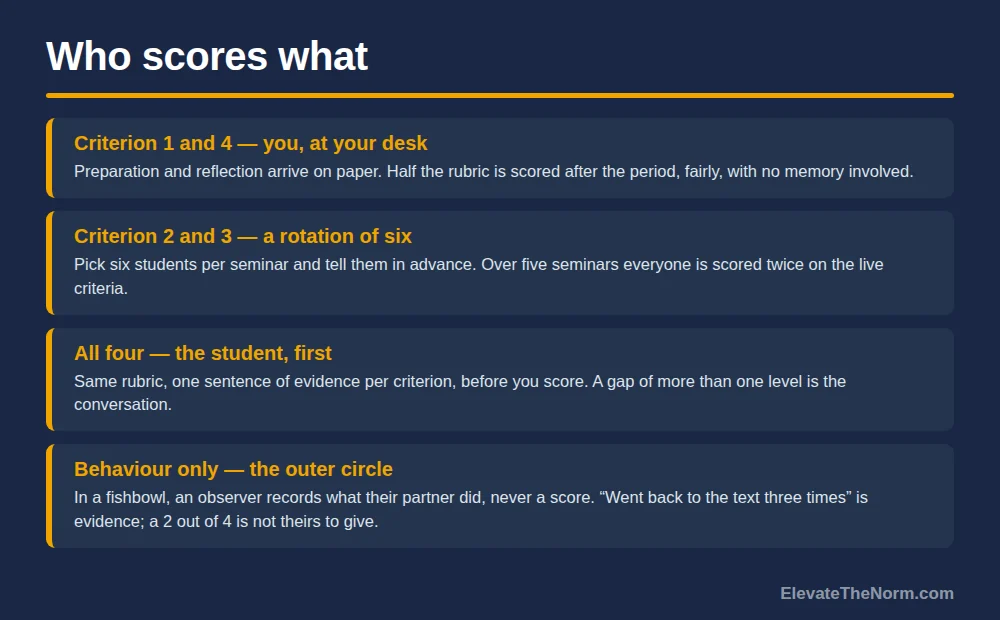
    Four rows describing who scores which rubric criteria: the teacher scores preparation and reflection from paper, a rotating group of six is scored on the live criteria, students self-score first, and outer-circle observers record behaviour only
    Facilitating and scoring are two jobs.

    Three ways out, in order of how much I trust them.

    1. Score the writing, not the room. Criteria one and four are collected on paper. That is half the rubric done at your desk, after school, fairly, with no memory involved.
    2. Score a rotation. Pick six students per seminar for criteria two and three and tell them in advance. Over five seminars everyone gets scored twice on the live criteria. Telling them beforehand is not cheating — it is the transparency the research says is doing the work.
    3. Use the fishbowl. If half the class is in an outer circle already, give each observer one partner and one behavioral thing to record. Their notes are not the grade, but they are evidence you did not have to generate while running the conversation.

    Check one thing before you adopt any of this: if a student has an IEP or 504 plan that addresses oral participation, the live criteria may need to be replaced rather than adapted for that student. Ask the case manager rather than improvising a workaround, and note that this rubric already makes that easy — half the score is written, so substituting the other half costs you less than it would on most discussion rubrics.

    On time, honestly: four criteria for twenty-eight students is about twenty minutes if you are scoring the written half from paper and six students on the live half. It is not nothing. It is roughly the cost of grading a set of exit tickets, and it is the reason the rotation exists.

    What I would not do is score from memory at the end of the period. Twenty minutes after a good seminar, what you remember is who was interesting, and “interesting” correlates with confident far more than it correlates with prepared.

    Who Should Do the Scoring?

    Students first, on the same rubric, before you score anything. This is the change that makes the rubric an instructional tool rather than a grading one, and it costs four minutes.

    Hand out the rubric before the seminar. Afterward, have each student score themselves on all four criteria and write one sentence of evidence for each. Then score them yourself. Where you disagree by more than one level, that is your conversation — and it is a better conversation than any comment you would have written unprompted.

    Two guards on this. The student’s self-score is not the grade; it is information, and the moment it becomes the grade you have taught them to inflate it. And peer scoring should stay behavioral: what a classmate did, not how well they did it. A fifteen-year-old can honestly record “went back to the text three times.” A fifteen-year-old should not be handing another fifteen-year-old a 2 out of 4 on how they treat people’s ideas. This is the same line the site draws around having students judge their own work: the judgement is real, and it does not become the record.

    What to Do With the Score

    Use it to decide what to teach next, and put as little of it in the gradebook as your school allows. A seminar rubric’s best use is diagnostic.

    Look down the columns rather than across the rows. If twenty of twenty-eight students scored low on use of the text, that is not twenty-eight individual grades — that is one lesson about citing a line, and you should teach it before the next seminar instead of recording twenty low scores. If preparation is the weak column, the problem is upstream of the seminar entirely and no amount of facilitation will fix it.

    If the scores do go in the gradebook, weight them low and tell students the weight. A seminar is a practice format. Grading practice heavily is how you get students who will not risk a wrong reading out loud, which is the one behavior the whole format exists to produce.

    What to Do Next

    Take the rubric above, rewrite the use of the text row so it names what evidence looks like in the specific text you are teaching, and hand it to students the day before — not the day after. Score criteria one and four from the paper they turn in. Pick six students for the live criteria and tell them who they are.

    Then run it twice before you judge either the rubric or your class. If you need the rest of the format, it is in the guide to running a Socratic seminar, and the questions that make one worth scoring are in the seminar question bank.

    Before you go: grab the free Socratic Seminar Rubric (Four Criteria) (PDF) — ElevateTheNorm.com branded, printable, no email required.

    Frequently Asked Questions

    What are the levels on a Socratic seminar rubric?

    This rubric uses four levels for each of its four criteria: 1 — Beginning, 2 — Developing, 3 — Proficient, and 4 — Advanced. Each criterion (preparation, use of the text, treatment of others’ ideas, and reflection afterward) is scored separately, which is what makes it an analytic rubric rather than a single overall impression.

    Does this Socratic seminar rubric work for middle school?

    Yes. It is written for grades 6–12. For younger students, rewrite any level-one descriptor that reads like a verdict on a person rather than a description of one day, and rewrite the use-of-the-text row to name what evidence looks like in the specific text. If a student has an IEP or 504 plan addressing oral participation, ask the case manager about replacing the live criteria.

    What should a Socratic seminar rubric include?

    Four criteria: preparation, use of the text, treatment of other people’s ideas, and written reflection afterward. Three of the four produce writing, which means you can score them after the period rather than while facilitating, and a student who spoke twice can still score well. What it should not include is a count of how many times a student spoke.

    Should you grade a Socratic seminar at all?

    Grade the preparation and the reflection, and weight the whole thing lightly. A seminar is a practice format, and grading practice heavily produces students who will not risk a wrong reading out loud — which is the behavior the format exists to create. If a participation grade is required, take it from the written criteria and say plainly that speaking is not scored.

    Why shouldn’t a rubric count how many times a student speaks?

    Because it measures confidence and charges a fee to students who find speaking aloud genuinely hard. A study of quiet students found most struggled with verbal participation expectations and several reported physical symptoms — trembling, blushing, stuttering — when speaking in class. Frequency is also easy to game: three short comments at the right moments will beat one student who prepared thoroughly and spoke once.

    Is an analytic or holistic rubric better for a seminar?

    Analytic, if you want consistency. A review of 75 rubric studies found scoring reliability improves when rubrics are analytic and topic-specific and are paired with exemplars or rater training. Holistic rubrics are faster and less consistent, and with something as fuzzy as discussion quality, consistency is exactly what you are short of.

    Do rubrics actually improve student learning?

    The evidence is genuinely mixed. A review of 21 studies of formative rubric use found effects ranging from very large to nothing, and noted that most studies combined rubrics with other interventions, so the rubric’s own contribution is hard to isolate. What the authors identify as the mechanism is transparency — which means handing the rubric out before the seminar rather than attaching it to the grade afterward.

    How do you score thirty students during one seminar?

    You do not. Facilitating and scoring are two jobs, and doing both means doing the facilitation badly. Score the two written criteria from paper afterward, and score the two live criteria for a rotating group of about six students per seminar, told in advance. Over five seminars everyone gets scored twice on the live criteria.

    Should students score themselves on the seminar rubric?

    Yes, before you score them, using the same rubric with one sentence of evidence per criterion. Where your score and theirs differ by more than one level, that gap is the conversation worth having. Keep the self-score as information rather than as the grade — the moment it becomes the grade, students learn to inflate it.

    Is this Socratic seminar rubric free to use?

    Yes. It is printed in full on this page and there is a free printable version too, with no email address to hand over, and you are welcome to copy it, cut criteria, or rewrite the language to match your school’s scale. Rewriting the use-of-the-text row so it names what evidence looks like in your specific text is the single change that will do the most for consistency.

    Rubrics like this one are the kind of thing I share in Bell to Bell, a free weekly newsletter for grades 6–12 teachers. Every other issue includes a printable classroom resource, and a new issue lands each Wednesday.

    Sources

    1. Jonsson, Anders, and Gunilla Svingby. “The Use of Scoring Rubrics: Reliability, Validity and Educational Consequences.” Educational Research Review, vol. 2, no. 2, 2007, pp. 130–144. Review of 75 empirical studies; reliable scoring “can be enhanced by the use of rubrics, especially if they are analytic, topic-specific, and complemented with exemplars and/or rater training”; rubrics do not by themselves guarantee valid judgements. https://eric.ed.gov/?id=EJ796733
    2. Panadero, Ernesto, and Anders Jonsson. “The Use of Scoring Rubrics for Formative Assessment Purposes Revisited: A Review.” Educational Research Review, vol. 9, 2013, pp. 129–144. 21 studies; effects on performance ranged from large (0.99–1.6) to negligible, and “most studies reporting on such improvements have combined the use of rubrics with other instructional interventions.” Positive effects more likely in higher education, over longer interventions, and when paired with metacognitive activity. https://platform.europeanmoocs.eu/users/4567/Les3/Panadero-Jonsson-rubrics-3.pdf
    3. Murphy, P. Karen, et al. “Examining the Effects of Classroom Discussion on Students’ Comprehension of Text: A Meta-Analysis.” Journal of Educational Psychology, vol. 101, no. 3, 2009, pp. 740–764. Discussion produced strong increases in student talk and substantial gains in text comprehension, but “few approaches to discussion were effective at increasing students’ literal or inferential comprehension and critical thinking and reasoning.” https://eric.ed.gov/?id=EJ861185
    4. Applebee, Arthur N., Judith A. Langer, Martin Nystrand, and Adam Gamoran. “Discussion-Based Approaches to Developing Understanding: Classroom Instruction and Student Performance in Middle and High School English.” American Educational Research Journal, vol. 40, no. 3, 2003, pp. 685–730. 64 middle and high school English classrooms, grades 7, 8, 10, 11 and 12. https://eric.ed.gov/?id=EJ782328
    5. Medaille, Ann, and Janet Usinger. “Quiet Students’ Experiences with the Physical, Pedagogical, and Psychosocial Aspects of the Classroom Environment.” Educational Research: Theory and Practice, vol. 31, no. 2, 2020, pp. 41–55. Ten upper-division undergraduates — not secondary students; nine of ten struggled with verbal participation expectations and six reported physical symptoms when speaking aloud. https://files.eric.ed.gov/fulltext/EJ1274336.pdf

    About Clay Shumate

    Clay Shumate is a certified secondary Social Studies teacher in the public schools of West Alabama, with seven years of classroom experience, a B.A. in History, and an M.Ed. in Secondary Education. He writes about project-based learning, student responsibility, respect, and practical ways to hold young people to a higher standard while giving them room to learn from mistakes. He is a member of the Society of Professional Journalists and writes to its Code of Ethics; this site’s editorial standards and corrections policy are published in full. More about Clay.

  • Standards Based Grading Gradebook: How to Build One That Survives a Semester

    Standards Based Grading Gradebook: How to Build One That Survives a Semester

    A standards based grading gradebook stores evidence by learning target instead of by assignment. Each row is a standard. Each entry is a piece of evidence a student produced for that standard. That one structural change is what makes a gradebook readable to a student, a parent, and the teacher who inherits the class next year. It is also what creates every hard decision you will spend the semester making.

    Most of what gets written about standards-based grading is about philosophy. This is not that. This page is about the file — what goes in the columns, what happens when a kid takes a quiz three times, what you do when the office needs a letter grade by Friday, and what the research says happens when you get those choices wrong.

    I will say up front that the evidence here is thinner and more mixed than the professional development usually admits. That is covered honestly below, because a teacher about to rebuild a semester of records deserves to know what they are buying.

    Key Takeaways

    • The structure is the whole idea. Rows are standards, not assignments. If your gradebook still reads as a chronological list of tasks with points attached, you have changed the labels and not the system.
    • One randomized trial found a real gain. A cluster RCT across 29 schools of a proficiency-plus-reassessment program in ninth-grade algebra and geometry reported a 0.33 standard deviation improvement on end-of-course mathematics tests — roughly the 50th to the 63rd percentile.
    • But no grading system improves learning by itself. Guskey and Link put it plainly: grading does not change curriculum or instruction, and there is no evidence that standards-based grading on its own raises achievement. What it reliably does is make the grade mean something specific.
    • Taking practice work out of the grade has a measurable cost. A two-year study of a policy change in secondary mathematics found that when practice stopped counting, completion of practice fell and achievement declined on several standards.
    • Students object on fairness grounds, and their objections are specific. In a survey of 478 high school students, the complaints were not about rigor. They were about inconsistent reassessment rules between teachers and about losing credit for work they had done.
    • The five decisions below are where implementations live or die: how many standards, what scale, how repeated attempts combine, what counts as evidence, and where behavior goes.

    What is a standards based grading gradebook?

    It is a gradebook whose primary axis is the standard rather than the assignment. A traditional gradebook answers “what did this student turn in and what was it worth?” A standards-based gradebook answers “what can this student do, and how do we know?”

    In practice that means a column per learning target instead of a column per task. A single test might feed six different columns, because a single test usually assesses six different things. Three separate assignments over a month might all feed one column, because they were all evidence for the same skill. The assignment does not disappear — it becomes the container for the evidence rather than the thing being measured.

    If you want the underlying rationale and the arguments for and against the approach as a whole, that is covered in the main standards-based grading guide. This page assumes you have already decided, or been told, and now have to build the thing.

    Does a standards based grading gradebook actually improve learning?

    The honest answer: one good randomized trial says a specific version of it helped, a large review says grading systems do not improve learning on their own, and at least one comparison found worse outcomes. Anyone who tells you the evidence is settled has not read it.

    The positive result

    The strongest evidence for this approach comes from a cluster randomized controlled trial of the PARLO program run by Kramer and colleagues and published in the Journal of Research on Educational Effectiveness. Twenty-nine schools were randomized — 14 treatment, 15 control — with the intervention in ninth-grade algebra and geometry classrooms. Students were rated not-yet-proficient, proficient, or high-performance on each learning outcome, and could reassess any outcome for full credit after further study. The program produced a 0.33 standard deviation improvement on end-of-course mathematics tests, moving the average student from roughly the 50th to the 63rd percentile. The effect was strongest among students who were already more motivated.

    Two caveats on that one. First, PARLO is a defined program with mastery definitions and reassessment built in, not a gradebook layout — the trial tested the whole package. Second, the full published article was not accessible to me, so the figures above come from the study summary published by the Society for Research on Educational Effectiveness rather than from the paper itself. I am citing what I actually read.

    The sobering results

    Laura Link and Thomas Guskey, writing in Theory Into Practice, argue that standards-based grading is best understood as a communication tool and not as an achievement intervention. Their sentence is the one worth keeping: no grading system by itself improves student learning, because grading does not alter curriculum or instruction. They note that the practice remains largely unstudied, that emerging research shows it produces a stronger relationship between grades and external measures, and that no evidence indicates it improves achievement.

    Four research summaries on standards-based grading: Kramer 2024 cluster randomized trial, Link and Guskey 2022, Townsley and Varga 2017, and Huey 2022
    Five peer-reviewed sources, and they do not agree with each other.

    Matt Townsley and Matt Varga compared two demographically similar Midwestern high schools of about 450 students each, one using standards-based grading and one traditional, across the graduating classes of 2015 and 2016. They found no significant difference in math, English, or cumulative GPA — and ACT scores roughly 2.2 to 2.7 points higher at the traditional school. That is a quasi-experimental comparison of two schools with all the confounding that implies, and the authors flag the rural, low-diversity sample themselves. It is not proof that the gradebook caused it. It is also not a result anyone should skip past.

    The broadest context comes from A Century of Grading Research in the Review of Educational Research, an eight-author review of the whole field. Two findings from it matter for anyone building a gradebook. Teachers mix achievement with work habits whether or not their system says they should — even teachers who report supporting standards-based reform report using practices that blend effort and improvement into academic marks. And grades, messy as they are, consistently predict educational persistence and completion better than standardized tests do. The multidimensionality that standards-based grading tries to strip out may be part of what makes a grade useful.

    The five decisions every standards-based gradebook has to make

    Make these five on purpose, write them down, and do not change them midyear. Every failed implementation I have read about failed at one of these, usually by leaving it to be decided case by case.

    DecisionThe optionsWhat to weigh
    1. GranularityEvery state standard, or 8–15 bundled targets per courseToo many rows and nobody reads the gradebook. Too few and the grade stops being diagnostic. Most workable secondary courses land between eight and fifteen per semester.
    2. Scale4-point, 3-level proficiency, or letter equivalentsGuskey argues for a limited number of performance categories rather than percentage scales, to cut down on false precision. The 1–4 scale and its conversion problems are worth reading before you commit.
    3. How attempts combineMean, most recent, highest, or professional judgmentThis is the one students notice. Averaging punishes early struggle. “Most recent” can drop a student for one bad day. Write the rule down and publish it.
    4. What counts as evidenceAssessments only, or assessments plus observed performanceNarrow it too far and you are grading test-taking. Widen it without criteria and you are back to impressions.
    5. Where behavior goesA separate reported strand, or nowhereSeparating academic marks from work habits is one of the three criteria Guskey names. It only works if the second strand is actually reported, not deleted.

    On decision three specifically: students in one large survey complained that a reassessment score replaced a higher earlier score even when it was worse. That is a defensible rule and an indefensible surprise. The rule is not the problem; discovering it after the fact is.

    Five numbered gradebook design decisions: granularity, scale, how attempts combine, what counts as evidence, and where behavior is reported
    Decide these on purpose, write them down, and hold them all year.

    Should practice work count in the grade?

    The evidence says be careful, and it points the opposite direction from the standard advice.

    The usual argument is that practice is formative, so it should not be graded — students will do it because it helps them. A two-year study by Huey and colleagues in Studies in Educational Evaluation tested exactly that policy change with 122 eighth graders and 123 ninth graders in year-long geometry courses. When practice work was removed from grade computations, completion of practice work decreased overall, and student achievement declined on several of the standards being assessed. The authors concluded that process grades are likely essential to maintaining achievement in that population, and noted their result contradicts reform advocates who claim engagement holds regardless.

    That is one study of high-achieving students in one subject, and it should not be read as a verdict on the whole question. But it is a direct test of a specific gradebook decision, and it came out against the conventional answer. If you take practice out of the grade, put something else in its place that makes the practice visibly matter, and watch your completion rates rather than assuming.

    Students see the same thing from the other side. In a study of 478 students at one high school, the most common complaint about standards-based grading was that homework should count — not because they wanted easy points, though some did, but because with few graded items the whole grade rested on two or three assessments. “There are so few points available on quizzes and tests” is a fairness objection, and it is a reasonable one.

    How do you convert to a letter grade when the office needs one?

    Publish the conversion rule before the first grade goes in, and use the same one every time.

    Most secondary teachers running this system do not control the report card, so the standards-based gradebook feeds a traditional one. That translation is where trust gets lost, because a student who sees a row of 3s and receives a B wants to know how. The receiving end of that translation is its own skill, and it helps to know how a standards based report card is meant to be read. Three workable approaches:

    1. A published crosswalk. A fixed table — all 4s and 3s with no 2s is an A, and so on. Simple, transparent, and slightly blunt at the boundaries.
    2. A proficiency threshold. The grade is determined by the proportion of standards at proficient or above, with a stated floor of standards that must be met regardless.
    3. A weighted composite with named priority standards. More precise, harder to explain, and worth it only if you will actually explain it.

    Whichever you choose, the parent-facing version has to be one paragraph long. Brookhart and colleagues found that many parents attempt to interpret standards-based labels by translating them back into letter grades regardless of what the school intends. Give them the translation rather than letting them invent one.

    What breaks, and when

    Reassessment load, teacher-to-teacher inconsistency, and midyear rule changes — in that order.

    • Unlimited reassessment. Guskey and Link warn directly that unlimited retakes create burdensome workloads, and that retaking a poorly aligned assessment does not produce learning regardless of how many attempts you allow. Cap attempts, require evidence of new study before a retake, and put reassessment in a fixed window rather than on demand.
    • Different rules in different rooms. Students in the 478-student survey said it repeatedly: nobody communicates the same, there is no standardization, some teachers appear to make reassessment deliberately difficult. Within a department, the five decisions above should have one answer, not six.
    • Changing the rule in January. A grading rule changed midyear is functionally retroactive, because the evidence already in the book was produced under the old one. If a decision is wrong, finish the term and change it at the semester line.
    • A gradebook nobody opens. Fifteen standards with one entry each in November is not a standards-based gradebook, it is a spreadsheet. The system only pays off if there is enough evidence per row to make the row mean something.

    Before you do this alone: what it costs beyond your own room

    A standards-based gradebook inside one classroom in a traditional building is a bigger undertaking than it looks, and four things will bite you.

    • The transcript is not yours. Whatever you do internally, a letter grade and a GPA leave your room and go on a document that affects class rank, scholarship eligibility, and athletic eligibility. Confirm with your counseling office how your marks will be recorded before you change how you produce them, not in May.
    • Your software may not support it. Most district gradebooks are built around assignments with point values. Some can be bent into standards; some can only fake it with categories. Find out which you have before you design a system it cannot hold, because a parallel spreadsheet you maintain by hand is a system that dies in November.
    • Students transfer. A student who arrives in week twelve arrives with points, and a student who leaves takes your proficiency levels into a building that will not know what they mean. Have a stated rule for both directions.
    • Reassessment is the real labor cost. Be concrete about it before you promise anything. If 20% of 140 students reassess one target a week, that is 28 additional items to write, administer, and score every week, on top of everything else. That number is why reassessment windows and attempt caps exist, and it is why Guskey and Link warn that unlimited retakes become burdensome.

    There is an instructional point buried in that last one that a coach would raise immediately. Reassessment only works if you have more than one assessment item per target that genuinely measures the same thing. If the retake is the same quiz, you are measuring memory of a quiz. If the retake is harder, you are punishing the student for needing it. Building a second and third form for each priority standard is the unglamorous prerequisite, and it is most of the actual work of this system.

    Four failure points for a standards-based gradebook: unlimited reassessment workload, inconsistent rules between teachers, midyear rule changes, and too little evidence per standard
    In roughly this order, and usually by midyear.

    None of this is an argument against doing it. It is an argument for doing it with the department and the counseling office rather than in private, and for starting with one course rather than a schedule.

    A setup checklist you can work through in an afternoon

    1. List the course’s learning targets and bundle them down to 8–15 per semester. Write each one in student-facing language. If you cannot say it in a sentence a fifteen-year-old understands, it is still a standards document and not yet a target — the four parts of a target a student can actually use covers the rewrite.
    2. Pick the scale and write the descriptors. Not just the numbers — what a 3 actually looks like in this course. Rubric templates are the fastest way in.
    3. Write the five decisions on one page. Granularity, scale, how attempts combine, what counts as evidence, where behavior goes. Date it.
    4. Build the columns before the semester, not during it. Retrofitting a gradebook in week six means hand-remapping every entry already in it.
    5. Decide the reassessment window and the entry requirement now. Which days, how many attempts, what a student must show to earn one.
    6. Write the one-paragraph explanation for families. What the numbers mean, how they become a letter, and when. Send it in the first two weeks rather than after the first complaint — the same front-loaded contact that works for everything else works here.
    7. Pick your check date. A day in week eight when you open the gradebook and ask whether any row has too little evidence to defend, and whether your conversion rule still produces grades you believe.

    What to tell students, and what to tell families

    Tell students the rules before the first entry, and show them the gradebook. Most of the recorded student resistance to this system is not resistance to rigor. It is the experience of being graded by a machine whose rules nobody explained.

    Grades 6–12 students can handle the actual explanation, and they deserve it. Say what the scale means. Say how repeated attempts combine, including the case where a retake scores lower. Say which standards carry the most weight. Say what happens to homework. Then hold to it, because the fastest way to lose a room under this system is to make an exception for one student and get caught.

    For families, lead with the translation and the one thing that changed. If your building is also making the shift, the arguments against are worth knowing as well as the arguments for — the case that standards-based grading does not work is an honest summary of the objections, and a teacher who can state the objection fairly is more persuasive than one who cannot.

    What to do next

    Before you rebuild anything, write the five decisions on one page and show it to one colleague who teaches the same course. Most of the damage in a standards based grading gradebook happens because a decision was never made explicitly — it just emerged from whatever the software defaulted to and whatever felt fair in the moment.

    Then build one unit, not one semester. Run it, look at how many entries each row actually accumulated, and see whether your conversion rule produced a grade you would defend to a parent. Adjust once, at the unit boundary. That is a slower start than a summer rebuild and it is the version that is still running in April. When the unit is done, a short structured reflection on what the rows told you is worth more than another round of reorganizing the columns.

    Frequently Asked Questions

    What is a standards based grading gradebook?

    A gradebook organized by learning target rather than by assignment. Each row is a standard and each entry is evidence a student produced for that standard, so a single test can feed six different rows and three assignments over a month can feed one. The practical test is whether the gradebook answers “what can this student do” rather than “what did this student turn in.” If the rows are still tasks with point values, the labels have changed and the system has not.

    How many standards should be in the gradebook?

    For most secondary courses, eight to fifteen bundled targets per semester. Listing every state standard produces a gradebook nobody opens, including you. Bundling too aggressively produces a grade that is no more diagnostic than a single letter. The working check is whether each row will accumulate enough evidence by the end of the term to defend a judgment — a row with one entry in November is not measuring anything.

    Should homework and practice work count toward the grade?

    The evidence is more cautious than the usual advice. A two-year study of a policy change in secondary mathematics found that when practice work was removed from grade computations, practice completion fell and achievement declined on several standards. Students in a separate survey said the same thing from their side: with few graded items, removing practice makes the entire grade rest on two or three assessments. If you take practice out, replace it with something that makes practice visibly matter and watch your completion rates.

    How should multiple attempts at the same standard be combined?

    Pick one rule, publish it before the first entry, and do not change it midyear. Averaging punishes early struggle, which is the thing the system is supposed to fix. “Most recent” can drop a student for one bad day. Highest score removes the incentive to prepare. Many teachers use most-recent with professional judgment for outliers. Whichever you choose, students need to know in advance what happens when a retake scores lower than the original — that specific surprise is one of the most common student complaints on record.

    Does standards-based grading raise test scores?

    The evidence is mixed and should be described that way. A cluster randomized trial across 29 schools of a proficiency-plus-reassessment program in ninth-grade math reported a 0.33 standard deviation gain on end-of-course tests. A comparison of two Midwestern high schools found no GPA difference and ACT scores roughly 2.2 to 2.7 points higher at the traditional school. Guskey and Link argue no grading system improves learning on its own, because grading changes neither curriculum nor instruction. What it reliably changes is what the grade means.

    How do you turn standards-based marks into a letter grade?

    With a published conversion rule applied identically every time. The three workable approaches are a fixed crosswalk table, a proficiency threshold based on the proportion of standards met, and a weighted composite with named priority standards. Write the parent-facing version in one paragraph and send it in the first two weeks. Research on grading found that many parents translate standards-based labels back into letter grades regardless of what the school intends, so it is better to hand them the translation than to let them invent one.

    What is the biggest implementation mistake?

    Leaving the rules implicit and letting them emerge from whatever the software defaults to. The five decisions — granularity, scale, how attempts combine, what counts as evidence, and where behavior goes — need explicit written answers that are the same across a department. Students surveyed about standards-based grading complained most about inconsistency between teachers, not about difficulty. Unlimited reassessment is a close second; it produces a workload that collapses by midyear.

    Can one teacher run this if the rest of the school does not?

    Yes, with three conversations first. Confirm with the counseling office how your marks will be recorded on the transcript, since class rank, scholarships, and athletic eligibility depend on a document you do not control. Confirm that your district gradebook can actually hold standards rather than categories pretending to be standards. And agree on a rule for students who transfer in or out mid-term. Start with one course rather than a full schedule.

    Sources

    • Link, Laura J., and Thomas R. Guskey. “Is Standards-Based Grading Effective?” Theory Into Practice, 2022. Full text (PDF).
    • Brookhart, Susan M., Thomas R. Guskey, Alex J. Bowers, James H. McMillan, Jeffrey K. Smith, Lisa F. Smith, Michael T. Stevens, and Megan E. Welsh. “A Century of Grading Research: Meaning and Value in the Most Common Educational Measure.” Review of Educational Research, vol. 86, no. 4, 2016, pp. 803–848. Full text (PDF).
    • Townsley, Matt, and Matthew Varga. “Getting High School Students Ready for College: A Quantitative Study of Standards-Based Grading Practices.” Journal of Research in Education, vol. 28, no. 1, 2017, pp. 93–112. Full text (PDF).
    • Huey, Maryann E., Peter R. Silvey, Amanda G. Vaughan, and Anne L. Fisher. “Assessing the Impact of Standards-Based Grading Policy Changes on Student Performance and Practice Work Completion in Secondary Mathematics.” Studies in Educational Evaluation, vol. 75, 2022, article 101211. Journal listing.
    • Peters, Randal, Jerrid Kruse, Tom Buckmiller, and Matt Townsley. “‘It’s Just Not Fair!’ Making Sense of Secondary Students’ Resistance to a Standards-Based Grading.” American Secondary Education, vol. 45, no. 3, 2017, pp. 9–28. Full text (PDF).
    • Kramer, Karen, Jill Posner, Alexander Browman, Rebecca Lawrence, Jennifer Roem, and Kathryn Krier. “The Impact of a Standards-Based Grading Intervention on Ninth Graders’ Mathematics Learning.” Journal of Research on Educational Effectiveness, 2024. Figures cited here come from the Society for Research on Educational Effectiveness study summary, which is what was read; the full article was not accessible.

    A note on the evidence. Five of the six sources above are peer-reviewed, and they do not agree with each other. That is the accurate state of this field, and a gradebook decision made on the assumption that the research is settled is a decision made on something that is not true.


    About Clay Shumate

    By Clay Shumate — Clay Shumate is a certified secondary Social Studies teacher in the public schools of West Alabama, with seven years of classroom experience, a B.A. in History, and an M.Ed. in Secondary Education. He writes about project-based learning, student responsibility, respect, and practical ways to hold young people to a higher standard while giving them room to learn from mistakes. He is a member of the Society of Professional Journalists and writes to its Code of Ethics; this site’s editorial standards and corrections policy are published in full.

  • The 1–4 Standards-Based Grading Scale, and the Conversion Problem Nobody Solves

    The 1–4 Standards-Based Grading Scale, and the Conversion Problem Nobody Solves

    By Clay Shumate · Updated October 24, 2026

    A 1–4 standards-based grading scale reports how well a student has met a standard, not how many points they accumulated. Four means beyond the standard, three means meeting it, two means approaching it, one means not yet. Three is the target, not four — which is the single thing most families and a fair number of teachers have wrong about it.

    The scale itself is not hard. What is hard is the part nobody puts on the poster: turning those numbers back into a letter grade, because almost every school that adopts a four-point scale still has to file a percentage at the end of the term.

    This page covers what each level means, why four levels rather than a hundred, and the conversion problem — including why the neat conversion chart your district hands out is a convention rather than a measurement.

    Key Takeaways

    • 3 is proficient and it is the goal. A 4 is not “an A” — it is work beyond the grade-level standard, and a student can have an excellent year without many of them.
    • Four levels exist because a hundred do not work. Asked to grade one paper, 90 trained high-school teachers produced scores from 50 to 96.
    • Nearly two-thirds of a 100-point scale describes failure. That is an accident of arithmetic nobody designed on purpose.
    • The zero is the clearest case. Recovering from one zero in a percentage system takes perfect scores on at least nine other assignments.
    • There is no validated conversion from 1–4 to letters. Every chart is an institutional convention — and the published ones converge on 3 = B, which is exactly the message problem rather than a confirmation.
    • Do not average the levels. Averaging reintroduces exactly the precision the scale was built to remove, and it punishes students who improved.
    • Decide what a 3 means before September, in writing, with the department. Most scale arguments are definition arguments wearing a number.

    Free Download · Printable PDF

    1–4 Scale and Conversion Sheet

    The four level descriptors in student-facing language, three conversion approaches side by side, the decision rules that beat averaging, and a one-page explainer you can send home.

    Download the free PDF

    Free. No email address required. Designed for grades 6–12. Rubric templates for each of the four levels are ready to download and adapt in the companion pack.

    What Does Each Level on a 1–4 Grading Scale Mean?

    There is no national definition, which is worth saying out loud before anyone quotes one at you. Schools write their own descriptors, and they vary. The shape is consistent though, and this family-facing version from Gateway Public Schools is about as standard as it gets:

    The four levels of a standards-based grading scale, in order: below standard, approaching, meeting, exceeding
    Three is the target. Four is a different kind of work, not a better grade.

    A 4 “consistently exceeds expectations” for skills and understanding. A 3 consistently meets them. A 2 meets some of them. A 1 meets few.

    Read the word consistently in the first two. It is doing more work than the numbers. A student who produced one brilliant analysis in October and nothing like it since is not a 4, and a student who has hit the standard on the last three attempts is a 3 even if the first attempt was dreadful. The scale is a claim about where a student is now, not a summary of everything they have ever handed in.

    The 4 causes most of the trouble at home, because families read four levels and assume A/B/C/D. It is not that. A 4 is work that goes past the grade-level standard — a different kind of task, not a tidier version of the same one. A student can meet every standard in your course, be entirely successful by any honest account, and collect very few 4s. If your reporting language does not say that plainly, you will spend October explaining it one parent at a time.

    Why Use a 1–4 Scale Instead of 100 Points?

    Because nobody can tell the difference between an 84 and an 86, and pretending otherwise has a cost.

    Three problems with the 100-point grading scale: two-thirds is failure, teachers disagree widely, one zero is unrecoverable
    The four-point scale is not a simplification. It is a correction.

    Thomas Guskey has made this case more carefully than anyone. In The Case Against Percentage Grades he points out that with a pass mark around 60, nearly two-thirds of the percentage scale describes levels of failure — sixty-odd gradations of failing and about forty of succeeding. No one chose that. It is what happens when you inherit a scale and never ask what it is for.

    On reliability he cites a 2011 replication of a study first run in 1912. Ninety high-school teachers, given twenty hours of training, scored the same paper. The scores ranged from 50 to 96. More levels do not produce more accuracy; Guskey’s phrase for it is the illusion of precision, and his point is that with more levels more students are simply misclassified.

    Then the zero, which is the cleanest arithmetic in the whole argument. To recover from a single zero in a percentage system, a student must earn a perfect score on at least nine other assignments. On a 0–4 scale the same missing piece of work costs about what it should. Guskey recommends integer scales for exactly this reason, and notes they line up with the GPA scale and with state assessment levels that already use four.

    Worth being honest about what this evidence is. It is an argument about measurement and reliability, not a trial showing that four-point scales raise achievement. What the outcome evidence on standards-based grading actually shows is a separate and more mixed question. The case for four levels is that the number you report means something. That is a real benefit and it is not the same as a test-score claim.

    How Do You Convert a 1–4 Grading Scale to Letter Grades?

    Here is the part the training day skips. Almost every school running a 1–4 scale still has to produce a letter grade, a GPA, or a transcript percentage — and there is no validated way to get from one to the other. The same spacing problem drives the argument on a 100-point scale, where entering a floor instead of a zero is the usual response.

    If you came here for the chart, here it is — three real ones, from schools that publish their conversion rule. Read the row for 3 before anything else. All three land a proficient student on a B, and the two Vermont schools are reproduced in the state Agency of Education’s own guidance, which declines to endorse them and calls the symbols “arbitrary” next to the learning they stand for (Vermont Agency of Education, Vermont Proficiency-Based Grading Practices, rev. February 2021; EAS Standards-Based Grading Conversion Chart, Lake Washington School District).

    1–4 to letter grade · three published district charts

    Three real conversion charts, side by side. They agree on the thing that matters least and disagree on the edges.
    Level What it means Champlain Valley Union HS (VT) Montpelier HS (VT) EAS, Lake Washington SD (WA)
    4 Consistently exceeds the standard 3.9–4.0 = A+ · 3.7–3.8 = A · 3.5–3.6 = A− 3.80–4.0 = A+ · 3.60–3.79 = A · 3.40–3.59 = A− 100% = A · 95% = A
    3 Consistently meets the standard — the target 3.3–3.4 = B+ · 3.0–3.2 = B · 2.7–2.9 = B− 3.20–3.39 = B+ · 3.00–3.19 = B · 2.80–2.99 = B− 92% = B+ down to 85% = B
    2 Meets some of the standard 2.4–2.6 = C+ · 2.0–2.3 = C · 1.8–1.9 = C− 2.50–2.79 = C+ · 2.20–2.49 = C · 2.00–2.19 = C− 80% = B down to 70% = C
    1 Meets few of the standard 1.5–1.7 = D+ · 1.3–1.4 = D · 1.0–1.2 = D− · below 1.0 = F 1.80–1.99 = D+ · 1.60–1.79 = D · 1.50–1.59 = D− · below 1.50 = F 64% = D+ · 57% = D · no evidence = 0% F

    Look at where they part company. Champlain Valley fails a student below 1.0; Montpelier fails one below 1.50, so the same body of work is a D− in one building and an F in the other. EAS puts a 2 as high as a B. The convergence on 3 = B is not evidence that B is correct — it is evidence that everyone inherited the same habit of hanging the new scale on the old one. That is the problem this page is about, not the solution to it.

    Three approaches to converting a 1-4 standards scale into letter grades, with what each one distorts
    Every conversion chart is a local convention. None of them is a measurement.

    Districts generally pick one of three approaches. A direct map assigns a letter to each level: 4 is an A, 3 a B, and so on. It is simple and it quietly tells every proficient student they are a B student, which is both demoralising and false. A weighted map puts 3 at an A or A− and reserves the top only for consistent 4s, which fixes the message and compresses everything below into very little room. A decision-rule approach sets conditions instead of arithmetic — an A requires 3s on all standards and 4s on some, a B requires 3s on nearly all — which is the most defensible and the hardest to explain on a progress report.

    None of those is discovered. They are all chosen. If you are looking for the correct conversion chart, stop: what you are actually choosing is what your school wants a letter grade to mean, and the arithmetic follows from that decision rather than producing it.

    The question underneath the family anxiety is usually GPA, and it deserves a straight answer. A transcript still has to carry letters or a grade point, so the conversion your district picks is the thing that reaches a college — not your levels. A direct map that makes proficient students into B students will pull a GPA down relative to a neighbouring district doing it differently, and that is a real consequence rather than a misunderstanding to be explained away. If your school is adopting a four-point scale, someone should model what it does to the GPA distribution before it goes live, and should be able to tell families the answer. “It all works out” is not an answer.

    Which is why the one genuinely portable rule is a negative one.

    Do not average the levels

    Averaging is the default in every gradebook and it undoes the scale. Three reasons, in order of how much damage they do.

    It reintroduces false precision. A student with levels of 2, 3 and 3 averages to 2.67, and 2.67 is not a thing. The scale has four values because four is roughly what professional judgement can reliably distinguish. Producing two decimal places from it is the exact error the scale was adopted to stop.

    It punishes the students who improved. A student who goes 1, 2, 3, 3 has learned the thing. Their average says 2.25 — approaching. Their most recent evidence says 3. One of those numbers is a description of a student and the other is a description of their history, and only one of them is what a grade is supposed to report.

    It hides the pattern that matters. Two students both averaging 2.5 — one going 3, 3, 2, 2 and one going 2, 2, 3, 3 — need opposite conversations. The average erases the only information that would tell you which is which.

    The usual alternatives are the most recent evidence, the mode, or professional judgement with the pattern in front of you. All three are defensible; all three require you to be able to say why. That is a feature, and it is also why this works far better when a department agrees the rule together rather than each teacher inventing one, which is the same failure mode as most of the ways standards-based grading goes wrong.

    Two practical warnings. The first is that your gradebook will fight you: most systems average by default, several will not store a non-numeric level at all, and a few will happily average your levels behind the scenes while displaying something else. Find out which yours does before you trust a term’s worth of data to it.

    The second is about the scale’s own reliability, and it would be dishonest to leave out. Fewer levels reduce disagreement between teachers; they do not remove it. Two teachers in the same department, marking the same essay against the same descriptors, will still hand back a 2 and a 3 often enough to matter to the student sitting between them. The fix is not a better rubric, it is moderation — a department periodically marking the same three pieces of work and arguing until the descriptors mean the same thing to everyone. An hour a term does more for grading accuracy than any conversion chart.

    Let Them Argue Their Own Level

    The most useful thing I do with this scale is not marking with it. It is making students say a number out loud and defend it.

    In a project check-in the question is not how is it going — that gets you fine. The question is which level the work is currently at and what would move it up one. They have the descriptors. They have their own draft. They have to make the case, and I get to hear the reasoning rather than guess at it.

    What happens is consistently more interesting than the grade. Students undersell by about a level and can usually name precisely what is missing, which means the gap was never that they did not know — it was that nobody had asked them to say it. A student who can tell you they are at a 2 because their evidence is thin in the second section has just written their own next step, and they will do it because it was theirs.

    It also does something to the scale itself. A number a student has argued for is a number they understand. A number that arrives on a report card is a verdict, and teenagers treat verdicts the way anyone does — as something to contest or absorb, but not as information. What the report card itself is trying to say is a separate puzzle, and reading a standards based report card is worth walking through with families before the first one goes home. If you want a structure for this rather than an improvised conversation, a short self-assessment form does most of the work — and it is worth being clear first about what student self assessment actually asks of a teenager.

    One thing the scale should never become is a label. A 1 or a 2 is a statement about a piece of work at a point in time and it is supposed to trigger something — a re-teach, a conference, a second attempt that actually counts. If a student sits at 2 for six weeks and the only consequence is that the 2 keeps being recorded, the scale has stopped doing its job and become a slower way of writing a D. The number is a prompt for the adult, not a verdict on the child. I give away a free test-corrections and retake request form for teachers who want the second attempt to be a process rather than a favour.

    What If Your District Requires Percentages Anyway?

    Most teachers reading this do not get to choose the reporting system. That is fine and the scale is still worth using; you just have to keep the two jobs separate — which is mostly a question of how the columns are set up before the first unit is graded.

    • Assess in levels, report in whatever they require. The conversion happens once, at the end, as a deliberate act rather than a running total.
    • Keep the level in front of students all term. They should see 1–4 on returned work even if the portal shows a percentage, because the level is the part they can act on.
    • Write your conversion rule down before you need it and give it to students and families in September. A rule published in advance is a policy; the same rule produced in May is an argument.
    • Never convert a single assignment. Convert the body of evidence for a standard, once. Converting each task and then averaging the percentages is the worst of both systems.
    • Expect the first term to be rough and say so. Families are fluent in percentages and your scale is new to them.

    And if you are the person choosing the system rather than living inside it, the honest brief is: a four-point scale buys you numbers that mean something and costs you a conversion argument you will have every year. That is usually a good trade. It is not a free one, and schools that present it as free are the ones that abandon it in year two.

    One place the conversion argument shows up every semester is the midterm. Whatever level you report, a family wants to see the evidence behind it, and a printed exam with an answer key is the easiest piece to point at. If you need one, Mid-Terms.org has 200 free printable midterm exams for grades 6–12 with answer keys, plus a Midterm Maker that builds a custom test from only the units you taught.

    Before you go: grab the free 1–4 Scale and Conversion Sheet (PDF) — ElevateTheNorm.com branded, printable, no email required.

    Frequently Asked Questions

    Still reporting on percentages? Our breakdown of the 10 point grading scale has the chart, the cutoffs, and what actually changes for a student sitting at 69 instead of 70.

    What does each number mean on a 1–4 standards-based grading scale?

    4 means the work consistently goes beyond the grade-level standard, 3 means it consistently meets the standard, 2 means it meets some expectations, and 1 means it meets few. There is no national definition — schools write their own descriptors and they vary — but that shape is close to universal. The word doing the most work is “consistently”: the level describes where a student is now, across recent evidence, not an average of everything they have ever submitted.

    Is there a standard 1–4 grading scale conversion chart?

    No. There is no validated conversion from a 1–4 scale to letter grades; every chart is a local convention. Published examples differ at the edges: Champlain Valley Union HS fails a student below 1.0, while Montpelier HS fails one below 1.50. What they share is putting a 3.0 at a B. Use the chart your district publishes, and know it is a choice, not a measurement.

    What percentage is a 3 on a 1–4 grading scale?

    It depends on the district’s chart. Lake Washington’s EAS chart maps a 3 to roughly 85–92 percent, a B to B+. Champlain Valley Union HS treats 3.0–3.2 as a B and Montpelier HS treats 3.00–3.19 as a B. A 3 means the student met the standard, so many schools that rethink the conversion place it at an A or A− instead.

    Is a 3 a B?

    Only if your district decided it is, and that decision is a convention rather than a measurement. A 3 means the student has met the standard, which in most schools’ own language is exactly what they were asked to do. Mapping that to a B tells every proficient student they are second-tier, which is both discouraging and inaccurate. Schools that think it through usually land on 3 as an A or A−, with the very top reserved for consistent 4s.

    Should I average standards-based grading scores?

    No. Averaging 2, 3 and 3 into 2.67 manufactures a precision the scale exists to avoid, and it penalises exactly the students who improved — a student who went 1, 2, 3, 3 has learned the material, whatever the mean says. Use the most recent evidence, the mode, or professional judgement with the whole pattern visible. Whichever you pick, agree it with your department and publish it before the term starts.

    Why not just use percentages?

    Because they are less accurate than they look. With a pass mark near 60, roughly two-thirds of a 100-point scale describes gradations of failure, and reliability research is unkind: asked to score one paper, 90 trained high-school teachers produced marks from 50 to 96. Then there is the zero — recovering from a single zero requires a perfect score on at least nine other assignments, which is a punishment nobody consciously designed.

    How do I explain the 1–4 scale to parents?

    Lead with the fact that 3 is the goal, because that is the misunderstanding underneath almost every worried email. Say plainly that a 4 is work beyond the grade-level standard rather than a better version of the same work, and that a student can be entirely successful with few 4s. Send it in writing in September, before any scores exist — the same explanation lands very differently once a family is looking at a number they do not like.

    What if a student improves a lot at the end of the term?

    Then their level should reflect that, which is the main practical advantage of the scale over a running average. A student who finishes the term demonstrating proficiency has demonstrated proficiency; a system that averages away their improvement is reporting their history rather than their learning. The check worth running is whether the recent evidence is genuinely consistent rather than one good day.

    Does standards-based grading hurt my child’s GPA?

    It depends entirely on the conversion your district chose, which is a decision rather than a property of the scale. A direct map where a 3 becomes a B will produce lower grade points than a weighted map where a 3 is an A−, for identical work. Since a transcript still carries letters or grade points, that choice is what actually reaches a college. It is a fair question to ask your school, and the right form of it is specific: what does a 3 convert to, and what happened to the GPA distribution the year you adopted this?

    Does a 1–4 scale improve student achievement?

    That is a different and much less settled question than whether it measures more honestly. The case for four levels is a measurement argument — fewer levels mean fewer misclassifications and a number that means something. The evidence on whether standards-based grading as a whole moves outcomes is genuinely mixed, and anyone selling it as a proven achievement intervention is going past what the research supports.

    Sources

    • Guskey, T. R. The Case Against Percentage Grades. Read the paper (PDF) — source for the two-thirds-of-the-scale-is-failure point, the 2011 replication in which 90 trained high-school teachers scored one paper from 50 to 96, the nine-assignments-to-recover-from-one-zero figure, and the recommendation to use integer 0–4 scales. This is an argument from measurement and reliability research; it is not a trial of student outcomes, and it should not be cited as one.
    • Gateway Public Schools. Grading and the four-point scale: an overview for families. Read the overview (PDF) — source for the level descriptors quoted above. One school’s definitions, used here because they are clearly written and representative; there is no national standard, and your district’s wording governs in your building.
    • Vermont Agency of Education. Vermont Proficiency-Based Grading Practices, revised February 9, 2021. Read the guidance (PDF) — source for the Champlain Valley Union HS and Montpelier HS rows in the conversion table. A state agency reproducing two local charts, not endorsing them: the document calls the choice between 1–4, descriptor labels and A–F “arbitrary” relative to the learning they represent, and frames conversion as a communication bridge during transition rather than an equivalence.
    • Lake Washington School District. EAS Standards-Based Grading Conversion Chart. Read the chart (PDF) — source for the percentage column. Note the population: EAS is a 5–8 school and the chart exists to translate a percentage-based gradebook back into proficiency levels, which is the reverse of the direction most readers need. It is included because it is a real published percentage mapping, not because it is a model to copy.

    Links checked September 17, 2026; the two conversion-chart sources added and checked October 4, 2026. The three conversion approaches described in this article are common practice observed across published district policies, not findings from a study — there is no validated conversion between a four-point scale and letter grades, which is precisely the argument this page is making.


    About Clay Shumate

    By Clay Shumate — Clay Shumate is a certified secondary Social Studies teacher in the public schools of West Alabama, with seven years of classroom experience, a B.A. in History, and an M.Ed. in Secondary Education. He writes about project-based learning, student responsibility, respect, and practical ways to hold young people to a higher standard while giving them room to learn from mistakes. He is a member of the Society of Professional Journalists and writes to its Code of Ethics; this site’s editorial standards and corrections policy are published in full.

Teacher Emergency Toolkit — practical resources, real classroom support. Shop on TPT.Teacher Emergency Toolkit — practical resources, real classroom support. Shop on TPT.