Tag: job demands

  • First Year Teacher Burnout: What Year One Is Missing, Not What You Are

    First Year Teacher Burnout: What Year One Is Missing, Not What You Are

    By Clay Shumate

    The first year is harder because you are doing the job without the things that make it doable later, not because you are weaker than the people around you. A fifth-year teacher opens a folder that already works. You are building that folder in real time, while the bell keeps ringing. Year one is a resource problem before it is a character problem.

    This page is about what is specifically different about year one. If you want the definition and the three dimensions of the word itself, start with the groundwork the rest of this series is built on. For the demand side at classroom resolution, what the loads actually consist of and how good the evidence is covers it and this page does not repeat it. This one answers a narrower question: what does a first-year teacher not have yet, and what can be done about it before June?

    Key takeaways

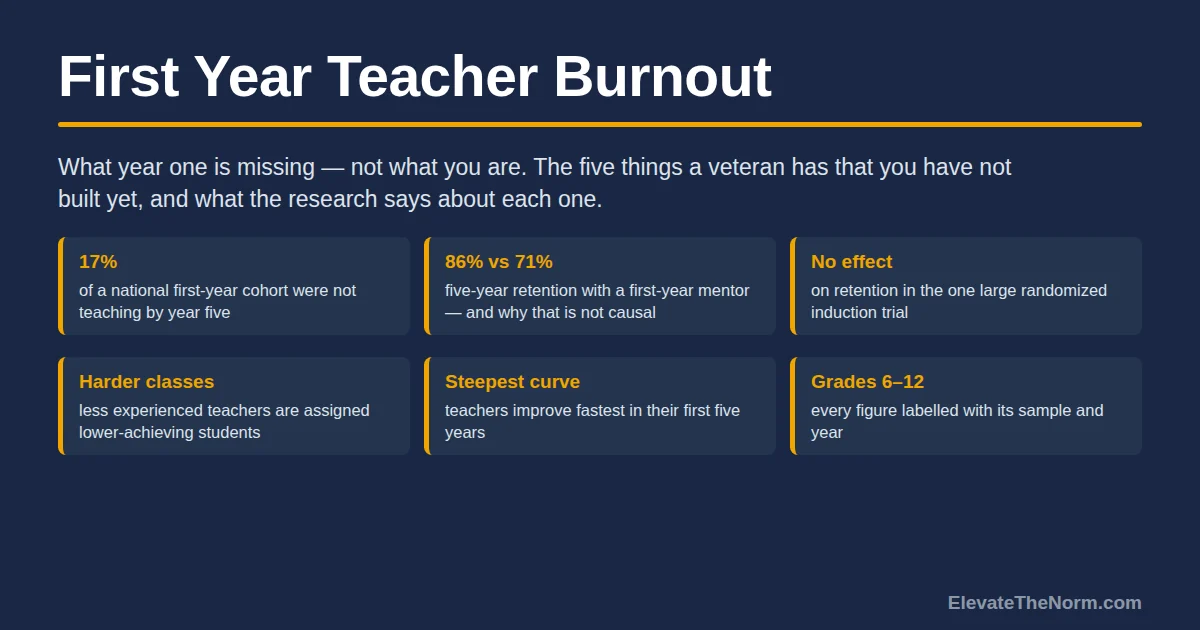
    • Most first-year teachers do not leave. In the federal study that followed a national cohort of about 1,990 first-year public school teachers, 10 percent were not teaching in year two and 17 percent were not teaching by year five. The line about half of new teachers quitting inside five years does not come from that data.
    • Year one is a resource problem more than a demand problem. The job is not heavier than it will be in year five. Your side of the ledger is emptier.
    • Five things a veteran has are accumulated, not innate: a bank of materials, a read on which behavior matters, relationships with families, a settled routine set, and somebody they can ask.
    • First-year teachers who had a mentor stayed at higher rates — about 86 percent against 71 percent at year five — but that is a correlation. The one large randomized trial of a full induction program found no effect on retention at all.
    • New teachers are often handed lower-achieving classes than colleagues in the same building. In a large district study covering grades 4–11, time at that particular school predicted a better assignment more than teaching experience elsewhere did.
    • Teachers improve fastest in their first few years. Year one is the steep part of a learning curve, not a verdict.
    • Burnout is an occupational condition, not a diagnosis you can give yourself from a web page. Nothing here is a screening instrument.
    Free download

    The Year-One Inventory

    Two printable pages. A write-in sheet for the five things a first-year teacher has not built yet, plus the request that goes with each one and who to take it to. It is a sorting sheet, not a screening instrument, and it returns no score. Free. No email address required. Designed for grades 6–12.

    Download the free PDF

    Why is the first year harder than the years after it?

    Because almost everything a veteran teacher runs on was built over time, and you are building yours while teaching full time.

    Think of it as stock and flow. The flow — five classes a day, the grading, the emails, the duty — is roughly the same for you as for the teacher across the hall. The stock is not. They have four years of lessons that already survived contact with actual teenagers. You have a syllabus and a pacing guide. Every single thing you teach this year is a first draft written the night before, and first drafts take three times as long as revisions.

    The same gap shows up in decisions. A veteran walking into a room where two students are arguing has seen that exact shape of argument forty times and knows in a second whether to say anything. You have not, so you think about it. Multiply that by every small call you make in a day and the same job is genuinely more tiring for you than for the person next door.

    None of that is a statement about your ability. It is a statement about elapsed time.

    The research on how teachers get better says the same thing from the other direction. Papay and Kraft tracked more than 3,500 teachers in one large urban district over nine years and found improvement is fastest early — roughly 0.08 standard deviations in math and 0.05 in reading across the first five years, then continuing afterward at 45 to 60 percent of that rate. Label it properly: grades 4 through 8, one district, test scores only. But the shape is the point. Year one sits at the steep part of a curve, struggling there is what that curve looks like from inside it, and it is also where practice and coaching pay back fastest.

    Do most first-year teachers burn out and quit?

    No. The federal data says most of them stay.

    The National Center for Education Statistics followed a national cohort of roughly 1,990 first-year public school teachers who started in 2007 or 2008, and checked on them every year for five years. Ten percent were not teaching in year two. Twelve percent were not teaching in year three, 15 percent in year four, and 17 percent in year five.

    Read the limits with the number. That is one cohort, and it ran from 2007–08 through 2011–12, so it is not a report on this year’s teachers. NCES also notes that people leave and come back, so the year-by-year figures are not a simple running total of departures. And it measures leaving, which is not the same thing as burning out — plenty of people stay in the classroom and are not all right. that is a different question with its own answer.

    Still, the myth matters. New teachers get told the half-quit-in-five-years version constantly, usually by someone who means it kindly. What it tells somebody having a bad October is that failure is the normal outcome. It is not.

    What does a first-year teacher not have that a fifth-year teacher does?

    Five things, and all five are accumulated rather than innate.

    List graphic of five resources a first-year teacher has not accumulated: a bank of materials, a read on behavior, relationships with families, a settled routine set, and somebody to ask.
    The resource side of the ledger at year one. Every item is accumulated, not innate.
    • A bank of materials. Lessons, readings, slides, assessments and rubrics that have already been run once and fixed. This is the biggest single one, and it is the reason your evenings are longer than theirs.
    • A read on behavior. Knowing which behavior needs a response right now, which is a student having a bad morning and will pass on its own, and which never needed one. That is a judgment about situations, not about which students are worth your time, and it is learned by seeing a few hundred of them.
    • Relationships with families. A fifth-year teacher has often taught an older sibling. The families are not the problem here; the cold start is. That first phone call is simply a different call when the name on the other end already means something.
    • A settled routine set. Entry, transitions, materials, closing. A veteran runs these without thinking. You are inventing and revising them at the same time you are enforcing them. the mechanics of building those is most of the work of a first semester.
    • Somebody to ask. A specific person who will answer a question in 40 seconds without it turning into a meeting or a referral. This is the one most often missing entirely.

    Notice what is not on that list: talent, toughness, or how much you care. Every item is something a person acquires by being somewhere for a while. That is also why the year-one money problem is real — with no accumulated classroom stock you buy more of it, and teachers in RAND’s 2026 national survey reported spending a little over $600 out of pocket on school supplies. that spending is part of a wider pattern and it lands hardest on the person who has nothing in the cupboard yet.

    Does having a mentor actually keep new teachers in the job?

    The correlational evidence says yes. The one large randomized trial says no. The honest answer depends on what the word mentor means in your building.

    Comparison graphic of four studies on mentoring and new teacher retention, each labelled with whether it shows an association, a prediction, a review, or a randomized causal test.
    Three studies find an association. The one randomized trial found no retention impact, and it was run in elementary schools.

    Start with the association. In that same federal cohort, first-year teachers who were assigned a mentor were still teaching at year five about 86 percent of the time, against about 71 percent of those who were not. That is a fifteen-point gap and it is not nothing. It is also not an experiment: nobody assigned mentors by coin flip, and schools that bother to assign mentors differ from schools that do not in a dozen other ways.

    Two more studies point the same way. Ronfeldt and McQueen, using three rounds of the federal Schools and Staffing and Teacher Follow-Up surveys plus that same beginning-teacher cohort, found induction supports in the first year predicted less migration and less attrition among nationally representative samples of first-year teachers. Ingersoll and Strong’s review of 15 empirical studies found most reported positive associations between induction and commitment, retention, practice and achievement.

    Then there is the experiment. The Institute of Education Sciences randomly assigned 1,009 beginning teachers across 418 schools in 17 urban districts and 13 states either to a comprehensive induction program — a full-time mentor, structured observation, ongoing professional development — or to whatever their district already did. The finding, in the report’s own words, was that there was no impact on teacher retention over the first four years of the teachers’ careers. Trained observers also found no significant differences in classroom practice. Districts that ran two years of the program showed a student achievement gain in the third year, 0.11 standard deviations in reading and 0.20 in math, but that result shrank away when the sample was widened.

    Two things have to be said about that trial rather than around it. The schools in it were elementary schools, so it is the best-designed study in the pile and it is not a grades 6–12 result. And what it tested was a program, delivered at district scale, which is not the same object as the person two doors down who actually answers your questions.

    The summary that survives all four studies: a real mentor is worth asking for, and a mentor on paper is not the thing that will save your year. If yours is nominal, that is a fact about the assignment, not a fact about you, and it is worth naming to somebody with a title rather than absorbing.

    There is a district-level reading of that null result too, and it is not that induction is pointless. It is that buying an induction program is not the same transaction as buying retention. The trial spent real money on full-time mentors and structured observation and moved no retention needle in four years, which suggests the thing that keeps a new teacher is closer to the daily conditions of the job than to the program wrapped around it.

    Are you being handed a harder schedule than the teacher across the hall?

    Often, yes, and it usually reflects standing inside the building rather than any judgment about your teaching.

    Kalogrides and Loeb looked at 67,697 teacher-year records in one of the largest districts in the country, covering grades 4 through 11 from 2003–04 through 2010–11. Less experienced teachers were assigned lower-achieving students. A ten-year increase in experience was associated with roughly a third of a standard deviation increase in the average prior achievement of a teacher’s students, and teachers with 10 to 20 years had classes whose prior achievement ran .10 to .20 standard deviations above their first-year colleagues in the same school.

    The detail that matters most is which kind of experience did the work. Time at that school predicted a better assignment; experience at other schools in the district did not. That pattern points at seniority and standing rather than at skill, which is the honest reading and also the uncomfortable one.

    Read it carefully, though. It is one district, it is observational, and the authors say outright that they cannot fully separate deliberate preference from habit, though they report similar patterns in two other large districts. What it gives you is permission to stop treating your schedule as evidence about your ability. If your day really is harder than your neighbor’s, you may simply be right — and a schedule is one of the few things somebody with a title can change in an afternoon.

    It is worth saying the other half of that finding out loud, because it is not really about teachers at all. If the least experienced staff systematically get the lowest-achieving classes, then the students with the furthest to go are the ones most often taught by somebody in their first draft of the job. That is a scheduling decision made building by building, usually without anyone intending it, and it is a fairness problem that belongs to whoever builds the master schedule rather than to the new teacher standing in front of the room.

    What can you change in year one without anyone’s permission?

    Less than the advice books promise, but not nothing — and the useful moves all build stock rather than spend energy.

    • Pick three routines and run them identically every day. Entry, transitions, closing. Consistency is cheaper than improvisation and it buys back more minutes than any app. the new-teacher version of that is the place to start.
    • Stop building what already exists. Ask your department for last year’s unit files before you write a single slide. Most people hand them over and are mildly insulted nobody asked. Ask rather than help yourself — some of it is the district’s and some of it is that person’s own work — and adapt what you get to your students instead of running it blind. Inherited materials save you the blank page, not the thinking.
    • Make one thing reusable per week. One lesson cleaned up and saved properly. By May that is thirty-odd pieces of stock you did not have in August, which is the entire mechanism by which year two is easier.
    • Write down what happened, not how it felt. Two lines after the class that went wrong: what you did, what the room did. kept this way it is a record you can act on, and in a month it is data rather than a mood. Write the situation, never a student’s name. A private notebook about your own teaching is a useful thing; a running file on individual teenagers is a different object with rules attached to it, and you do not want to have made one by accident.

    What is not on the list is pushing through. Nobody in your building gets credit for outlasting a badly resourced year, and treating exhaustion as a rite of passage is how a fixable first year becomes a much longer problem to climb back out of.

    What should you ask for, and who should you ask?

    Ask one named person for one specific, small thing, and expect to hear no or not this year sometimes.
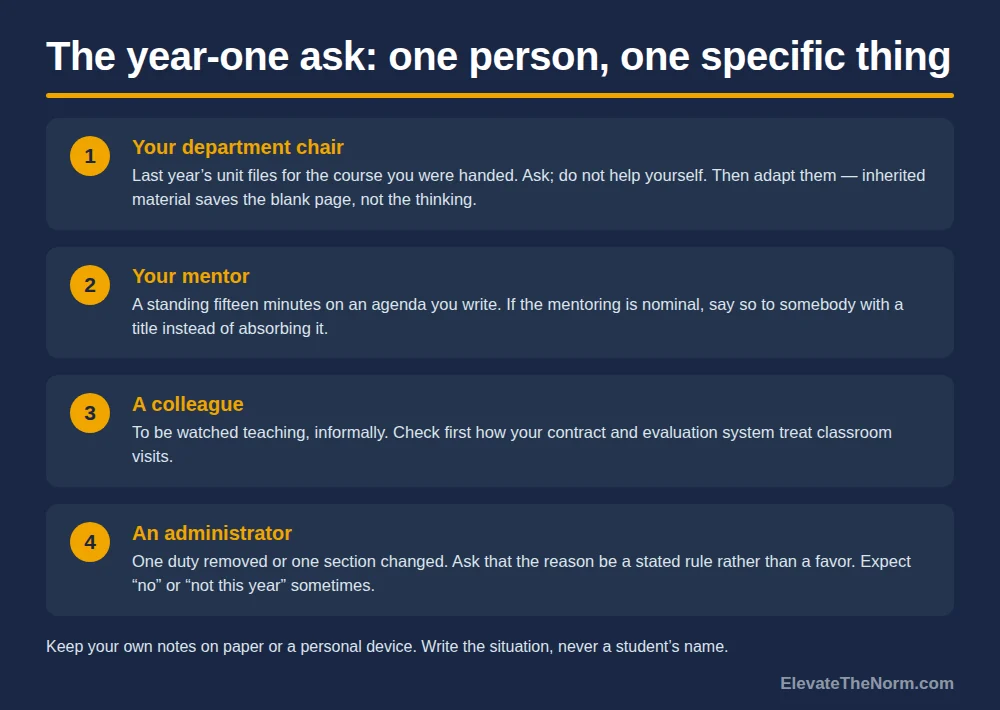
    Four-step graphic showing who a first-year teacher should ask and what for: a department chair for existing unit files, a mentor for a standing fifteen minutes, a colleague for an informal classroom visit, and an administrator for one duty removed or one section changed.
    Four requests, in rough order of how easy they are to say yes to.

    Vague requests get vague answers. “I’m drowning” is true and unanswerable. “Can I have the unit files for the course I picked up in August” is answerable in ten seconds. Four requests worth making, roughly in order of how easy they are to say yes to: existing materials from your department chair; a standing fifteen minutes with your mentor on an agenda you write; one colleague willing to be watched teaching, informally; and, from an administrator, one duty removed or one section changed. Check how your contract and evaluation system treat classroom visits before you set the informal one up, since in some places an observation is a defined thing with paperwork behind it.

    That list assumes a department to ask, and plenty of secondary teachers do not have one. If you are the only person in the building teaching your course — which happens constantly in electives, in small schools, and in any position that turned over in July — the request changes shape rather than disappearing. Ask whoever taught the course last, if they are still on staff. Ask your state department or subject association, which usually publish sequenced units for free. Ask a teacher of the same course at another school in the district; people say yes to that more often than new teachers expect. The goal is the same either way: do not write from a blank page if a page already exists.

    Go through the normal chain first — chair, then assistant principal, then principal. And if a duty does come off your plate, it is fair to ask that the reason be a rule rather than a favor, because a public criterion protects you from resentment down the hall more than quiet special treatment does.

    One practical caution. Keep your own notes about how the year is going on paper, or on a personal device. A district laptop and a district account are not private places to write down that you are not coping.

    When is this bigger than a first-year problem?

    When it stops lifting on weekends and breaks, or when it is showing up in your sleep, your body or your health.

    Burnout is an occupational condition — something that happens to a person in a job, described by how the job is going. It is not a diagnosis, and nothing on this page or any page can tell you whether you have one. That is also why this site publishes no burnout quiz: a score would imply a threshold, and there is no clinically validated cutoff to put a threshold on.

    So the honest answer here is the unglamorous one. If the exhaustion is not lifting when you are away from the building, or if you are seeing it in your sleep, your appetite or your health, talk to your doctor or a counselor. That is a conversation with a person, not a result from a page.

    What to do this week

    Three things, in order. Ask one person for one existing set of materials — that is the single highest-return hour available to you right now. Pick the one routine that is costing you the most minutes and run it the same way five days running. And save one lesson properly, cleaned up, where you will find it next year.

    Then write down what the week actually took, so that when you ask for something bigger you have specifics instead of a feeling. The inventory below is that, on two printed pages. Year one is short of stock, not short of you, and most of that gap closes by simply still being there in September.

    Want the inventory as a printable? Download The Year-One Inventory (2 pages, free, no email required) and fill it in before your next conversation with your chair.

    Frequently asked questions

    Is first year teacher burnout normal?

    Finding year one exhausting is close to universal, and it is not the same thing as burnout. The first year is harder because you have none of the accumulated stock a fourth or fifth year runs on — materials that already work, a read on behavior, relationships with families, settled routines, and a person you can ask. Burnout is a specific occupational condition with three dimensions, and a hard first year is not automatically it. If the exhaustion does not lift on weekends and school breaks, that is the signal worth paying attention to, and the next step is a conversation with a person rather than a checklist.

    Do half of new teachers really quit within five years?

    No. That figure does not come from the federal data. The National Center for Education Statistics followed a national cohort of about 1,990 first-year public school teachers who started in 2007 or 2008 for five years: 10 percent were not teaching in year two, 12 percent in year three, 15 percent in year four and 17 percent in year five. Three caveats belong with it. It is a single cohort, it ran from 2007–08 to 2011–12 rather than today, and NCES notes that teachers leave and return, so the yearly figures are not a running total of permanent departures.

    Does having a mentor stop new teachers from burning out?

    The evidence is genuinely mixed and it is worth knowing why. In the federal cohort, first-year teachers assigned a mentor were still teaching at year five about 86 percent of the time against about 71 percent of those who were not — but nobody assigned mentors at random, so that is an association, not a cause. The one large randomized trial, which assigned 1,009 beginning teachers across 17 urban districts to a comprehensive induction program or to business as usual, found no impact on retention over four years and no measurable difference in classroom practice. Those schools were elementary schools. The practical reading: a mentor who actually answers your questions is worth asking for, and a mentor who exists only on a form is not the thing that will carry your year.

    Is my child worse off with a first-year teacher?

    On average, less experienced teachers are somewhat less effective on test-score measures, and it is fair to want to know that. The size matters, though: the research on how teachers improve finds gains of roughly 0.08 standard deviations in math across the first five years, which is real but modest, and improvement continues well past year five. The larger fairness question is not about any individual teacher. It is that assignment is systematic — in a large district study covering grades 4 through 11, the least experienced teachers were consistently given the lowest-achieving classes, with time at that particular school predicting a better assignment more than teaching experience did. That is a scheduling decision, and it is a reasonable thing to ask a principal about.

    Are students to blame when a new teacher struggles?

    No. A first-year teacher is doing the job without materials, without a read on which behavior matters, and often without anyone to ask, and those gaps would make the year hard with any group of students in the room. Behavior shows up as a workload in the research, and that is a statement about how much of the job is unstructured, not about who is sitting in the desks. Nothing a student does makes them responsible for how a school resourced someone’s first year.

    What should a first-year teacher ask for, and from whom?

    One named person, one specific request, small enough to say yes to. Existing unit files from your department chair, a standing fifteen minutes with your mentor on an agenda you write, one colleague willing to be watched teaching informally, and from an administrator one duty removed or one section changed. Work the normal chain — chair, then assistant principal, then principal — and expect “no” or “not this year” sometimes without reading it as a verdict. If a duty does come off your plate, it is fair to ask that the reason be a stated rule rather than a favor.

    What if there is no department to ask for materials?

    This is common in secondary schools — electives, small buildings, and any position that turned over in July can leave one person teaching a course alone. The request changes shape rather than disappearing. Ask whoever taught the course last if they are still on staff. Your state department of education and your subject association usually publish sequenced units for free. Teachers of the same course at other schools in the district say yes more often than new teachers expect. The principle holds either way: do not write from a blank page when a page already exists.

    Is a bad first year a sign I chose the wrong career?

    Not on its own, and the timing makes that judgment unreliable. Year one sits at the steepest part of the improvement curve and at the emptiest point of your resources, which is the worst possible moment to evaluate a long-term fit. That is not an argument for staying no matter what, and there are good reasons people leave. It is an argument for making the call with better information — after you have asked for what is missing and seen what the answer is — rather than in February of a year you were under-equipped for.

    Sources

    • Gray, L., & Taie, S. (2015). Public School Teacher Attrition and Mobility in the First Five Years: Results From the First Through Fifth Waves of the 2007–08 Beginning Teacher Longitudinal Study (NCES 2015-337). National Center for Education Statistics. Approximately 1,990 first-year public school teachers, followed 2007–08 through 2011–12. 10, 12, 15 and 17 percent not teaching in years two through five; first-year mentor associated with 85.5 percent versus 71.4 percent still teaching at year five. The report notes that teachers may leave and later return, so the annual figures are not cumulative departures. nces.ed.gov (PDF)
    • Glazerman, S., Isenberg, E., Dolfin, S., Bleeker, M., Johnson, A., Grider, M., & Jacobus, M. (2010). Impacts of Comprehensive Teacher Induction: Final Results From a Randomized Controlled Study (NCEE 2010-4027). Institute of Education Sciences. 1,009 beginning teachers in 418 schools across 17 urban districts in 13 states, randomly assigned. “There was no impact on teacher retention over the first four years of the teachers’ careers.” No significant differences in observed classroom practice. A third-year student achievement impact in two-year districts (0.11 reading, 0.20 math) did not hold when the analytic sample was broadened. The schools were elementary schools, which this article states in the text. files.eric.ed.gov (PDF)
    • Ingersoll, R. M., & Strong, M. (2011). The impact of induction and mentoring programs for beginning teachers: A critical review of the research. Review of Educational Research, 81(2), 201–233. A review of 15 empirical studies since the mid-1980s across three outcomes — commitment and retention, classroom practice, and student achievement — with most reporting positive associations, and the large randomized trial above noted as the exception. Abstract read via ERIC; the full text sits behind a publisher paywall and is cited here as a review rather than as a source of effect sizes. eric.ed.gov
    • Ronfeldt, M., & McQueen, K. (2017). Does new teacher induction really improve retention? Journal of Teacher Education, 68(4). Drawing on the three most recent administrations of the Schools and Staffing and Teacher Follow-Up Surveys plus the Beginning Teacher Longitudinal Study, receiving induction supports in the first year predicted less migration and less attrition among nationally representative samples of first-year teachers. Predictive, not experimental. Abstract read via ERIC. eric.ed.gov
    • Kalogrides, D., & Loeb, S. (with Béteille, T.) (2013). Systematic sorting: Teacher characteristics and class assignments. Sociology of Education, 86(2). 67,697 teacher-year observations in Miami-Dade County Public Schools, 2003–04 through 2010–11, grades 4–11. A ten-year increase in experience was associated with about a third of a standard deviation increase in students’ average prior achievement; teachers with 10–20 years had classes .10 to .20 standard deviations higher than first-year colleagues. School-specific experience predicted assignment where district experience did not. Limitations stated by the authors: a single district (with similar patterns reported in Milwaukee and San Francisco), limited teacher characteristics, and no way to fully separate preference from bias. edpolicyinca.org (PDF)
    • Papay, J. P., & Kraft, M. A. (2015). Productivity returns to experience in the teacher labor market: Methodological challenges and new evidence on long-term career improvement. Journal of Public Economics, 130, 105–119. More than 3,500 teachers and over 200,000 student-year records in one large urban southern district, 2000–01 to 2008–09, grades 4–8. Improvement of roughly 0.08 standard deviations in mathematics and 0.05 in reading over the first five years, continuing afterward at 45 to 60 percent of that rate in mathematics. Limitations stated by the authors: a single district, insufficient statistical power for later-career estimates, four modeling approaches producing different estimates, and test scores as “only one important educational outcome.” matthewakraft.com (PDF)
    • Steiner, E. D., Levine, R. S., & Doan, S. (2026). Teacher Well-Being, Pay, and Intentions to Leave in 2026: Selected Findings From the 2026 State of the American Teacher Survey (RR-A4404-2). RAND. American Teacher Panel, nationally weighted. Teachers reported spending a little more than $600 out of pocket on school supplies, and 18 percent intended to leave their jobs. Teachers have been more likely than similar working adults to report poor well-being on every indicator since 2021. rand.org

    Every source above was opened and read for this article. Where a figure could not be confirmed in the original, it is not on this page.


    About Clay Shumate

    Clay Shumate is a certified secondary Social Studies teacher in the public schools of West Alabama, with seven years of classroom experience, a B.A. in History, and an M.Ed. in Secondary Education. He writes about project-based learning, student responsibility, respect, and practical ways to hold young people to a higher standard while giving them room to learn from mistakes.
  • Causes of Teacher Burnout: What the Research Blames, and What It Can’t Prove

    Causes of Teacher Burnout: What the Research Blames, and What It Can’t Prove

    By Clay Shumate

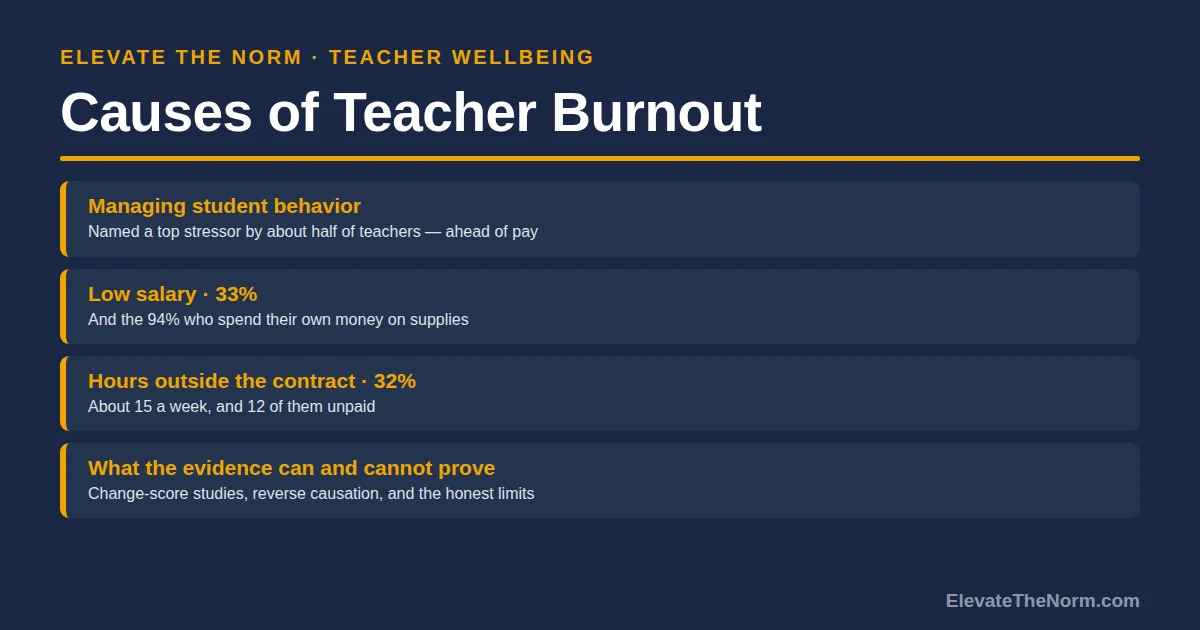
    Teacher burnout is caused by working conditions, not by personal weakness. Asked directly, teachers rank managing student behavior first, low salary second, and hours worked outside the contract third. The strongest longitudinal research supports those as real causes, and what those conditions end up costing the students in the room is a separate question with its own evidence. It also shows the arrow runs both ways: burnout changes how heavy the same job feels.

    This page is about those causes at classroom resolution — what the loads actually consist of in a grades 6–12 job, and how strong the evidence behind each one really is. If you want the definition and the three dimensions, start with what the word actually means before you go looking for a cause. If you are trying to work out whether what you are feeling is burnout at all, whether what you are feeling is the thing with the name is the better door. This one answers a narrower question: why does this happen, and where does the research actually point?

    Key takeaways

    • About half of teachers named managing student behavior a top source of job-related stress in RAND’s 2026 national survey. Low salary followed at 33 percent, hours outside contract hours at 32 percent.
    • Student behavior is the most consistently measured cause: across 21 samples, misbehavior correlated with emotional exhaustion at a median of .42. That is behavior measured as a workload, not students measured as a problem.
    • Teachers reported working 53 hours a week against a contract of 40 or less. About 12 of the 15 extra hours appeared to be uncompensated.
    • No national survey establishes what those extra hours consist of. RAND says so outright. Anyone telling you grading is the number one cause is guessing.
    • In the best change-score evidence available, missing resources predicted burnout slightly more strongly than excess demands. What you do not have hurts about as much as what you have too much of.
    • Cause runs both directions. Burnout at one wave predicted higher job demands two waves later, which is a feature of the condition and not a character flaw.
    Free download

    The One-Week Teacher Demand Log

    Two printable pages. A five-day write-in log for finding out which demand is actually driving your week, plus a page on how to read it and how to make the request. It is a sorting sheet, not a screening instrument, and it returns no score. Free. No email address required. Designed for grades 6–12.

    Download the free PDF

    What causes teacher burnout?

    Job conditions cause it — more precisely, a long-running mismatch between what the job demands of you and what the job gives you to meet those demands with. When teachers are asked to name the source themselves, three answers dominate.

    RAND’s 2026 State of the American Teacher survey put the question to 829 K–12 public school teachers, alongside 498 similar working adults, between late January and late February 2026, weighted to be nationally representative. On sources of job-related stress, the ranking came out like this.

    • Managing student behavior — about half of teachers.
    • Low salary — 33 percent.
    • Too many hours working outside contract hours, or doing administrative work — 32 percent.
    • The intrusion of political issues into teaching — 16 percent.
    • Physical safety or job security concerns — 3 percent.

    Two honest notes before anyone uses that list. First, it ranks what teachers name, which is not the same as ranking what does the most damage. Second, RAND’s own press release rounds the behavior figure to 52 percent while the report’s figure reads closer to 50 and its caption says “about half.” I am using “about half,” because that is the version both documents support.

    Why does student behavior outrank low pay?

    Because it is the demand you meet forty times a day, and because handling it is the part of the job with the least structure around it.

    Ranked list of the five sources of job-related stress teachers named in RAND's 2026 survey, from managing student behavior at about half of teachers down to physical safety or job security at 3 percent.
    What teachers themselves name, in rank order. RAND, 2026 State of the American Teacher.

    It is also the most consistently measured cause in the literature. Aloe and colleagues pooled 21 independent samples and 63 effect sizes and found student misbehavior correlated with emotional exhaustion at a median of .42, ranging from .09 to .74 across studies — the largest of the three burnout dimensions. Depersonalization came second, .10 to .71. Reduced personal accomplishment was smallest. Grade level was one of the moderators that explained variation between studies, so a figure pooled across elementary and secondary is not automatically a secondary figure, and a good deal of the variation stayed unexplained. The authors say so plainly.

    Here is what “student misbehavior” means at grades 6–12 resolution, because the phrase sounds like fights and mostly it is not. It is the phone that comes back out ninety seconds after you asked. It is the fourth redirect to the same student in one period, in a voice you are working to keep level. It is the kid who will not start and will not say why — and who very likely has a reason you do not know yet. Each one costs almost nothing. Thirty of them in an hour costs something real, and five periods of thirty is the load.

    Be clear about where that leaves the blame, because this research gets quoted as though it lands on students. It does not. A fourteen-year-old testing a boundary is doing what fourteen-year-olds do, and it is not a student’s job to protect an adult’s wellbeing. The burnout driver is not the behavior. It is whether you are absorbing the volume of it alone, with no agreed rule, no second adult, and no answer when you ask for one — all of which are decisions somebody with a title can make.

    How much of the job happens outside the paid day?

    About fifteen hours a week, and most of it is unpaid.

    Five numbered cards showing that teachers reported working 53 hours a week against a contract of 40 hours or less, leaving a 15-hour gap of which about 12 hours appeared uncompensated.
    The workweek against the contract. RAND, 2023 State of the American Teacher.

    RAND’s 2023 survey asked 1,439 K–12 public school teachers and 527 comparison working adults. Teachers reported working 53 hours in a school-year week against 46 for the working adults, even though nearly all of them said their contract was for 40 hours or less. Of the roughly 15 uncontracted hours, about 12 appeared to be uncompensated — about one hour in every four worked. A quarter of teachers said they were mostly or very satisfied with their weekly hours. Half of working adults said so.

    Now the part most articles skip. RAND did not ask what those hours were spent on. Their words: “Our survey did not ask teachers about the amount of time they spent on specific activities while they were working, so we cannot shed light on how teachers used their time.” So when you read that grading is the number one cause of teacher burnout, understand that no national survey establishes it. It may well be true for you. It may be family contact, or coverage, or meetings, or the four unrelated things you got asked for in a hallway. You cannot find out from an article, which is why this one ends in a log rather than a conclusion.

    One caveat that runs the other way. RAND notes that researchers comparing self-reported hours against time diaries generally find self-reports run high, with estimates of teachers’ overestimation ranging from two to six hours a week. Treat 53 as reported hours, not a stopwatch figure. The gap against the contract survives the correction. It just shrinks.

    It is also worth separating two different things that both live in those hours. Some of the load is genuinely too large for the time available and needs to be smaller. Some of it is larger than it needs to be because of how the work is built — an assessment that could be half the length and tell you the same thing, a gradebook structured so the evidence does not pile up, a family-contact routine with no rotation in it. The first needs a resource from somebody. The second is a design problem, and it is the kind of thing an instructional coach is actually useful for. Guessing which one you have is how people end up angry at the wrong thing. The log at the end of this article is built to tell you which.

    And on family contact specifically: the load is the volume and the absence of any system for it, not the fact that families want to talk to you. A parent who calls is not the problem. Forty parents who each reasonably expect an individual reply, with no rotation and no protected time to make the calls, is a staffing decision that has been quietly turned into a personal one.

    Does low pay cause burnout, or just make it harder to accept?

    Probably the second, and that still counts.

    A third of teachers named salary. In the same 2026 survey, average base pay was $75,599 against more than $105,000 for the comparison group of similar working adults, and teachers’ pay made up 60 percent of household income where other workers’ made up 68. Ninety-four percent reported spending their own money on classroom supplies, averaging around $665.

    The mechanism worth naming is not that low pay makes you tired. It is that fifteen unpaid hours is a different fact at different salaries. Unpaid overtime you can absorb reads as commitment. Unpaid overtime you cannot absorb reads as being taken advantage of, and that reading, rather than the hours themselves, is the corrosive part. Reward and fairness are two of the conditions the burnout literature keeps returning to, and pay sits in both of them.

    Do we actually know these are causes?

    Partly. The best evidence is decent, and it is not from teachers.

    The strongest design available asks whether changes in conditions predict changes in burnout, rather than measuring both once and calling it causation. Schaufeli, Bakker and Van Rhenen ran that design across two waves a year apart. Increases in job demands — overload, emotionally upsetting situations, work bleeding into home — predicted burnout, standardized beta .23. Decreases in job resources — social support, autonomy, opportunities to learn, feedback — predicted it slightly more strongly, beta .27.

    Read the label before using the number. The sample was 201 telecom managers at one large Dutch company, not teachers, and the authors call that sample’s homogeneity a weakness themselves. What transfers is the shape of the finding, not the coefficient: what you do not have hurts about as much as what you have too much of. That is the most useful line on this page, because the public conversation about teacher burnout is almost entirely about things being added, and half the mechanism is about what was taken away.

    Now the complication, which belongs here and not in a footnote. Cause runs in both directions. A four-wave Norwegian study of 272 employees found burnout at one wave predicted higher job demands two waves later, rho .12. Small, but real, and it matches what teachers describe: the year did not only get harder, you also got less able to carry the same weight, and the two fed each other. Same caution on the label — 272 people, heavy attrition from about a thousand starters, no occupational data, and a Norwegian sick-pay system behind the absence measures.

    Two things follow, and they pull in opposite directions, so hold both. One: do not read the reverse arrow as evidence the problem is in your head. Depletion changing how you read the job is a documented feature of the condition, not a character flaw. Two: do not wait for the conditions to change on their own before you do anything, because the loop runs whether or not anyone intervenes.

    What about autonomy and administrative support?

    Directionally supported. Thinly evidenced in teachers specifically.

    Autonomy is one of the four resources in the study above, and the absence of resources was on the stronger side of that ledger. The teacher-specific evidence is weaker than you would hope. A 2025 study of 824 US teachers found autonomy moderated the relationships between administrative support, job satisfaction and burnout — but the interaction effects were small, with delta R-squared between .006 and .016; the design was cross-sectional; the burnout measure was a three-item scale the authors themselves describe as less robust than the Maslach Burnout Inventory; and nearly half the sample taught PK–5. It is the weakest source on this page and I would rather say so than dress it up.

    The practical version does not need the statistics. Autonomy in a 6–12 job is mostly small and specific. Whether you choose the order of your units. Whether you can move a due date without asking. Whether the assessment you give is one you wrote. Every one of those is a decision somebody either leaves with you or takes off you. That is worth knowing when you are trying to name what is wrong, because “I have no autonomy” is nearly impossible to act on and “I cannot move a due date” is a sentence an administrator can answer.

    Which cause is actually yours? A one-week demand log

    You cannot get this from a list, including this one. National rankings tell you what is common. They do not tell you which load is taking you apart. So run a log for five teaching days. It takes a few minutes at the end of each day, and the first day takes longer than the rest.

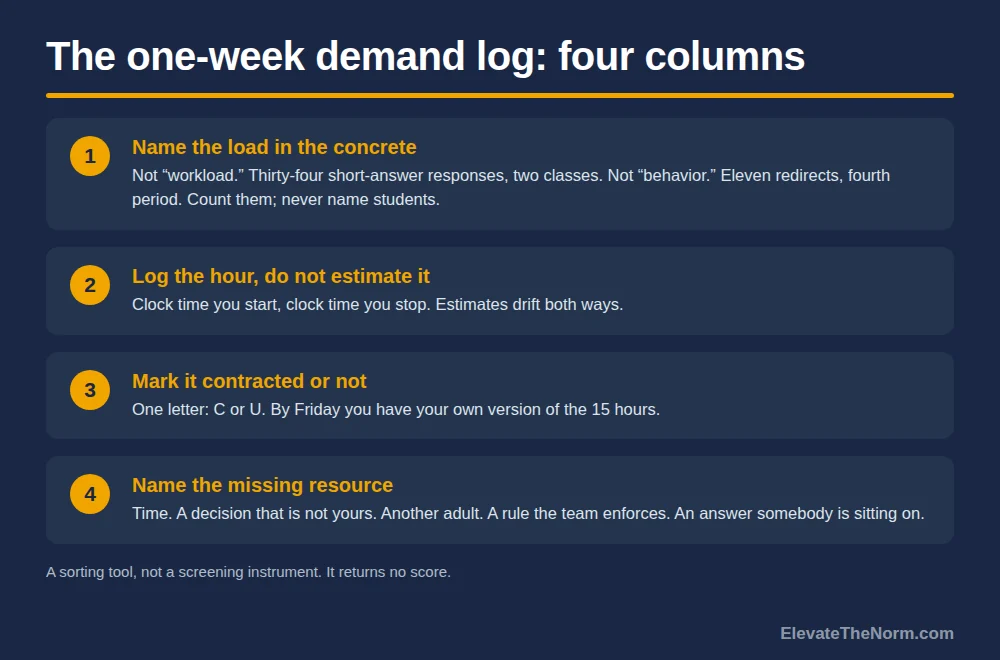
    Four numbered cards describing the columns of a one-week teacher demand log: name the load in the concrete, log the hour rather than estimate it, mark it contracted or not, and name the missing resource.
    Four columns, five days. It is a sorting tool and it returns no score.

    Four columns. One row for every hour you work outside your contracted day, plus a row for any class period that cost more than it should have.

    1. Name the load in the concrete. Not “workload.” Thirty-four short-answer responses, two classes. Not “behavior.” Eleven redirects, fourth period. Count the redirects; never write a student’s name. This is a record of your workload, not a record about a child, and the moment it names kids it becomes something else entirely. The concrete version is also the only version anybody can act on.
    2. Log the hour, do not estimate it. Write the clock time you start and the clock time you stop. Estimates drift in both directions, and the point is to find out what is true rather than to win an argument.
    3. Mark it contracted or not. One letter, C or U. By Friday you will have your own version of the fifteen hours, for your own job.
    4. Name the missing resource. What would have made this cost less? More time. A decision that is not yours to make. Another adult in the room. A rule the whole team actually enforces. An answer from somebody who has been sitting on it. This column is what turns a complaint into a request.

    Then read it on Friday and look for one of three patterns.

    • One load dominates. Most of your unpaid hours are the same activity. That is the easiest kind of ask to make, because it is specific and somebody can say yes or no to it.
    • The hours are spread thin across six things. No single fix exists, which usually means the problem is the number of things rather than any one of them — so the conversation is about what comes off the plate, not how to do each one faster.
    • Column four keeps saying the same word. If “a decision” or “another adult” shows up five times, the missing resource is the finding. The load was never the story.

    If a week is more than you have right now, shrink it. Do one day. Or skip the first three columns entirely and fill in only column four for a week — what was missing, once a day, one line. Starting a five-day data-collection project is a strange thing to ask of somebody who is already underwater, and a partly filled sheet still tells you more than another month of guessing.

    A log is not a diagnosis and it does not score you. Nothing on this page can tell you whether you are burned out. There is no validated clinical cutoff for that, and a web page is the wrong instrument regardless. What the log can do is turn “I am drowning” into four lines somebody can act on. If the honest answer after five days is that you are not coping, the next conversation is with your doctor or a counselor, not with a checklist.

    One practical note. Keep it on paper, or somewhere that is not the school network. A district device is not a private place to write down that the job is beating you.

    What to do next

    Start with the concrete version of your worst week rather than the general one. Run the log for five days. Then take the single clearest row to whoever can act on it — your department chair or your direct administrator, through the normal chain rather than around it — and lead with the missing resource rather than the feeling, because a resource is something a person can say yes or no to in about ten seconds.

    If you are a special educator, this page’s log is only half your ledger — a demand set that does not appear on this page at all sits on top of it. Expect a fair number of those asks to come back as “no,” or “not this year.” The log is still worth running, because now you know precisely which no you are living with and whether you can live with it. And it is fair to ask what the criterion is. If relief goes to whoever asks best, it is unfair to every colleague who did not ask, and a public rule for who gets a duty removed is better for a staff than a favour quietly granted.

    If the log says the load itself is the problem and no resource fixes it, that is a real answer too. There are two honest directions from there: getting back on your feet once the cause has already done its work, and weighing the job you have against the one you might take. Neither is a failure. Both beat a fourth year of guessing.

    And if you are reading this as the person who assigns the loads rather than the one carrying them, that four-column log is also a short, specific agenda for a conversation you can start on Monday.

    Want the log as a printable? Download The One-Week Teacher Demand Log (2 pages, free, no email required) and run it for five teaching days.

    Frequently asked questions

    What is the number one cause of teacher burnout?

    When teachers are asked to name their top sources of job-related stress, managing student behavior comes first — about half of teachers named it in RAND’s 2026 national survey, ahead of low salary at 33 percent and hours outside the contract at 32 percent. Two cautions. That ranks what teachers name, which is not the same as ranking what does the most damage, and no single cause explains an individual case. The useful question is not which cause is biggest nationally but which one is taking up your week.

    Does this mean students are to blame for teacher burnout?

    No. A fourteen-year-old testing a boundary is doing what fourteen-year-olds do, and it is not a student’s job to protect an adult’s wellbeing. The research measures student behavior as a workload — the volume of redirects an adult absorbs in a day — not as a moral failing. What turns that volume into a burnout driver is the absence of support around it: no agreed rule, no second adult, no answer when a teacher asks for one. Those are adult decisions, made by adults.

    I am a student. Should I change how I act so my teachers do not burn out?

    That is a generous question and the honest answer is no — not for that reason. Your teacher’s working conditions are set by adults with authority you do not have, and carrying an adult’s wellbeing is not a job that belongs to you. Treating people decently is worth doing on its own merits. If a teacher of yours seems to be struggling, the right move is to mention it to another adult you trust, not to try to fix it yourself.

    Is grading the biggest cause of teacher burnout?

    Nobody knows, and any article that tells you otherwise is guessing. RAND asked teachers how many hours they work but states plainly that its survey “did not ask teachers about the amount of time they spent on specific activities,” so there is no national figure breaking the extra hours into grading, planning, meetings, coverage or family contact. Grading may well be the biggest load in your job. It is not established as the biggest load in the profession.

    How many hours do teachers actually work outside their contract?

    In RAND’s 2023 survey of 1,439 K–12 teachers, the average teacher reported working 53 hours in a school-year week while nearly all said their contract covered 40 hours or less. Of the roughly 15 uncontracted hours, about 12 appeared to be uncompensated — roughly one hour in every four worked. One honest caveat, which RAND raises itself: self-reported hours tend to run high, with estimates of teachers’ overestimation ranging from two to six hours a week. The gap survives the correction; it just shrinks.

    Can low pay by itself cause burnout?

    The more defensible reading is that pay changes what the rest of the job means rather than causing exhaustion directly. Fifteen unpaid hours is a different fact at different salaries: overtime you can absorb reads as commitment, and overtime you cannot absorb reads as being taken advantage of. Reward and fairness are both conditions the burnout literature keeps returning to, and pay sits in both of them.

    Does the research actually prove these things cause burnout?

    Partly, and the honest answer has caveats. The strongest available design measures whether changes in conditions predict changes in burnout. Schaufeli, Bakker and Van Rhenen found they do — but in 201 telecom managers at one Dutch company, not in teachers. And causation runs both ways: a four-wave Norwegian study found burnout at one point predicted higher job demands later. So the conditions are real causes, the teacher-specific causal evidence is thinner than the confident headlines suggest, and the loop feeds itself once it starts.

    Does burnout have one cause I can fix?

    Usually not one, and the combination is the point. That is why the last section of this article is a five-day log rather than a ranked list: it is built to tell you which load and which missing resource are actually yours. But a log is not a diagnosis and it returns no score. Nothing on a web page can tell you whether you are burned out. If the honest answer after a week is that you are not coping, the next conversation is with your doctor or a counselor.

    Sources

    • Steiner, E. D., Levine, S., & Doan, S. (2026). Teacher Well-Being, Pay, and Intentions to Leave in 2026: Selected Findings from the 2026 State of the American Teacher Survey. RAND, RR-A4404-2. 829 K–12 public school teachers and 498 similar working adults, surveyed late January to late February 2026, weighted to be nationally representative. Source of the ranked stressors, the pay and supply-spending figures. Note the discrepancy handled in the text: RAND’s press release rounds the student-behavior figure to 52 percent while the report’s own figure reads closer to 50 and its caption says “about half.” Report · Press release
    • Doan, S., Steiner, E. D., Pandey, R., & Woo, A. (2023). All Work and No Pay — Teachers’ Perceptions of Their Pay and Hours Worked. RAND, RR-A1108-9. 1,439 K–12 public school teachers and 527 comparison working adults. Source of the 53-hour week, the 15 uncontracted hours, the 12 uncompensated ones, and the satisfaction comparison — and of the self-report caveat quoted in the text. rand.org
    • Aloe, A. M., Shisler, S. M., Norris, B. D., Nickerson, A. B., & Rinker, T. W. (2014). A multivariate meta-analysis of student misbehavior and teacher burnout. Educational Research Review, 12, 30–44. 21 independent samples, 63 effect sizes. Median correlation with emotional exhaustion .42 (range .09–.74); depersonalization second (.10–.71); reduced personal accomplishment smallest. Grade level was among the moderators, and substantial variability remained unexplained. sciencedirect.com
    • Schaufeli, W. B., Bakker, A. B., & Van Rhenen, W. (2009). How changes in job demands and resources predict burnout, work engagement, and sickness absenteeism. Journal of Organizational Behavior, 30, 315–335. Two waves a year apart, 201 telecom managers in the Netherlands. Increases in demands predicted burnout (β = .23); decreases in resources predicted it more strongly (β = .27). Not a teacher sample, and the authors name the homogeneity of the sample as a weakness. Full text (PDF)
    • Øvergård, K. I., Gottenborg, S., Hoff, T., Johnsen, S. Å. K., & Rydstedt, L. (2025). A longitudinal path analysis of the reciprocal and cyclical relationships between sickness absence, job demands, job resources, and burnout. Frontiers in Psychology, 16, 1557898. Four waves, 272 Norwegian employees. Burnout at T2 predicted job demands at T4, ρ = 0.12. Limitations stated by the authors: heavy attrition from roughly 1,000 initial respondents, a predominantly female sample, no occupational data, and a Norwegian sick-pay context. frontiersin.org
    • Teacher voices matter: The role of teacher autonomy in enhancing job satisfaction and mitigating burnout (2025). PLOS ONE. 824 US teachers, cross-sectional, end of the 2021–22 school year. Autonomy moderated administrative support and job satisfaction in predicting burnout, with interaction effects of ΔR² = .006 to .016. The weakest source cited here, and labelled as such in the text: cross-sectional, a three-item burnout scale the authors themselves call less robust than the Maslach Burnout Inventory, and a sample that was 48 percent PK–5. journals.plos.org

    Every source above was opened and read for this article. Where a figure could not be confirmed in the original, it is not on this page. The same discipline applied to the headline figures is on the page that traces every burnout percentage to its own survey.


    About Clay Shumate

    Clay Shumate is a certified secondary Social Studies teacher in the public schools of West Alabama, with seven years of classroom experience, a B.A. in History, and an M.Ed. in Secondary Education. He writes about project-based learning, student responsibility, respect, and practical ways to hold young people to a higher standard while giving them room to learn from mistakes.

Teacher Emergency Toolkit — practical resources, real classroom support. Shop on TPT.Teacher Emergency Toolkit — practical resources, real classroom support. Shop on TPT.