By Clay Shumate
Teacher burnout is caused by working conditions, not by personal weakness. Asked directly, teachers rank managing student behavior first, low salary second, and hours worked outside the contract third. The strongest longitudinal research supports those as real causes, and what those conditions end up costing the students in the room is a separate question with its own evidence. It also shows the arrow runs both ways: burnout changes how heavy the same job feels.
This page is about those causes at classroom resolution — what the loads actually consist of in a grades 6–12 job, and how strong the evidence behind each one really is. If you want the definition and the three dimensions, start with what the word actually means before you go looking for a cause. If you are trying to work out whether what you are feeling is burnout at all, whether what you are feeling is the thing with the name is the better door. This one answers a narrower question: why does this happen, and where does the research actually point?
Key takeaways
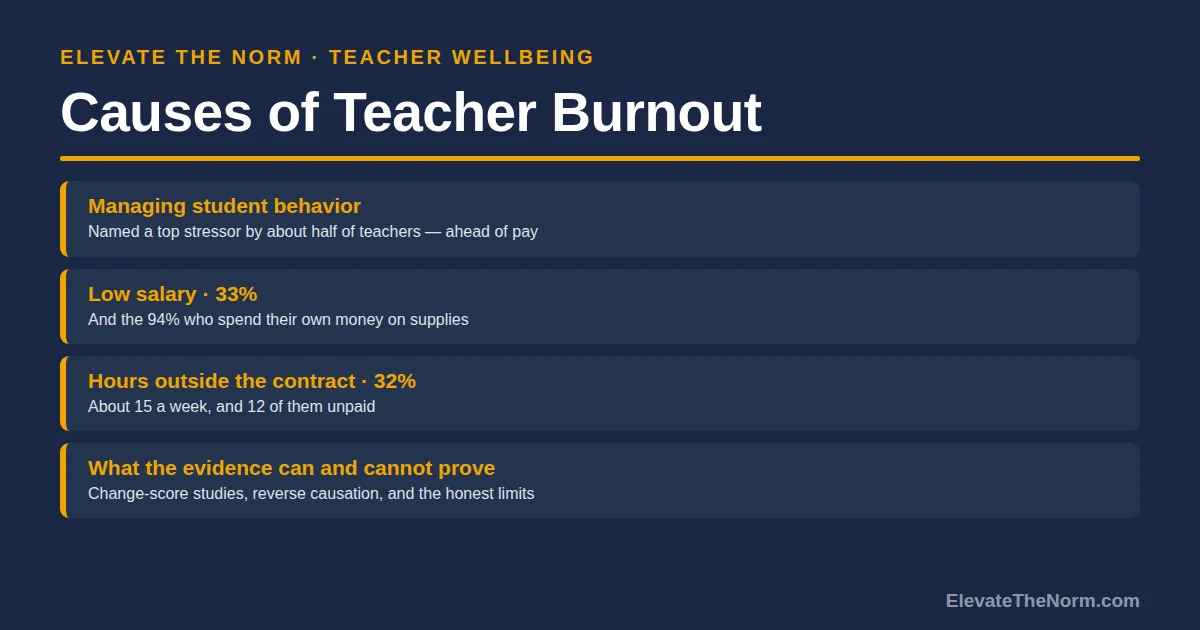
- About half of teachers named managing student behavior a top source of job-related stress in RAND’s 2026 national survey. Low salary followed at 33 percent, hours outside contract hours at 32 percent.
- Student behavior is the most consistently measured cause: across 21 samples, misbehavior correlated with emotional exhaustion at a median of .42. That is behavior measured as a workload, not students measured as a problem.
- Teachers reported working 53 hours a week against a contract of 40 or less. About 12 of the 15 extra hours appeared to be uncompensated.
- No national survey establishes what those extra hours consist of. RAND says so outright. Anyone telling you grading is the number one cause is guessing.
- In the best change-score evidence available, missing resources predicted burnout slightly more strongly than excess demands. What you do not have hurts about as much as what you have too much of.
- Cause runs both directions. Burnout at one wave predicted higher job demands two waves later, which is a feature of the condition and not a character flaw.
The One-Week Teacher Demand Log
Two printable pages. A five-day write-in log for finding out which demand is actually driving your week, plus a page on how to read it and how to make the request. It is a sorting sheet, not a screening instrument, and it returns no score. Free. No email address required. Designed for grades 6–12.
Download the free PDFWhat causes teacher burnout?
Job conditions cause it — more precisely, a long-running mismatch between what the job demands of you and what the job gives you to meet those demands with. When teachers are asked to name the source themselves, three answers dominate.
RAND’s 2026 State of the American Teacher survey put the question to 829 K–12 public school teachers, alongside 498 similar working adults, between late January and late February 2026, weighted to be nationally representative. On sources of job-related stress, the ranking came out like this.
- Managing student behavior — about half of teachers.
- Low salary — 33 percent.
- Too many hours working outside contract hours, or doing administrative work — 32 percent.
- The intrusion of political issues into teaching — 16 percent.
- Physical safety or job security concerns — 3 percent.
Two honest notes before anyone uses that list. First, it ranks what teachers name, which is not the same as ranking what does the most damage. Second, RAND’s own press release rounds the behavior figure to 52 percent while the report’s figure reads closer to 50 and its caption says “about half.” I am using “about half,” because that is the version both documents support.
Why does student behavior outrank low pay?
Because it is the demand you meet forty times a day, and because handling it is the part of the job with the least structure around it.

It is also the most consistently measured cause in the literature. Aloe and colleagues pooled 21 independent samples and 63 effect sizes and found student misbehavior correlated with emotional exhaustion at a median of .42, ranging from .09 to .74 across studies — the largest of the three burnout dimensions. Depersonalization came second, .10 to .71. Reduced personal accomplishment was smallest. Grade level was one of the moderators that explained variation between studies, so a figure pooled across elementary and secondary is not automatically a secondary figure, and a good deal of the variation stayed unexplained. The authors say so plainly.
Here is what “student misbehavior” means at grades 6–12 resolution, because the phrase sounds like fights and mostly it is not. It is the phone that comes back out ninety seconds after you asked. It is the fourth redirect to the same student in one period, in a voice you are working to keep level. It is the kid who will not start and will not say why — and who very likely has a reason you do not know yet. Each one costs almost nothing. Thirty of them in an hour costs something real, and five periods of thirty is the load.
Be clear about where that leaves the blame, because this research gets quoted as though it lands on students. It does not. A fourteen-year-old testing a boundary is doing what fourteen-year-olds do, and it is not a student’s job to protect an adult’s wellbeing. The burnout driver is not the behavior. It is whether you are absorbing the volume of it alone, with no agreed rule, no second adult, and no answer when you ask for one — all of which are decisions somebody with a title can make.
How much of the job happens outside the paid day?
About fifteen hours a week, and most of it is unpaid.

RAND’s 2023 survey asked 1,439 K–12 public school teachers and 527 comparison working adults. Teachers reported working 53 hours in a school-year week against 46 for the working adults, even though nearly all of them said their contract was for 40 hours or less. Of the roughly 15 uncontracted hours, about 12 appeared to be uncompensated — about one hour in every four worked. A quarter of teachers said they were mostly or very satisfied with their weekly hours. Half of working adults said so.
Now the part most articles skip. RAND did not ask what those hours were spent on. Their words: “Our survey did not ask teachers about the amount of time they spent on specific activities while they were working, so we cannot shed light on how teachers used their time.” So when you read that grading is the number one cause of teacher burnout, understand that no national survey establishes it. It may well be true for you. It may be family contact, or coverage, or meetings, or the four unrelated things you got asked for in a hallway. You cannot find out from an article, which is why this one ends in a log rather than a conclusion.
One caveat that runs the other way. RAND notes that researchers comparing self-reported hours against time diaries generally find self-reports run high, with estimates of teachers’ overestimation ranging from two to six hours a week. Treat 53 as reported hours, not a stopwatch figure. The gap against the contract survives the correction. It just shrinks.
It is also worth separating two different things that both live in those hours. Some of the load is genuinely too large for the time available and needs to be smaller. Some of it is larger than it needs to be because of how the work is built — an assessment that could be half the length and tell you the same thing, a gradebook structured so the evidence does not pile up, a family-contact routine with no rotation in it. The first needs a resource from somebody. The second is a design problem, and it is the kind of thing an instructional coach is actually useful for. Guessing which one you have is how people end up angry at the wrong thing. The log at the end of this article is built to tell you which.
And on family contact specifically: the load is the volume and the absence of any system for it, not the fact that families want to talk to you. A parent who calls is not the problem. Forty parents who each reasonably expect an individual reply, with no rotation and no protected time to make the calls, is a staffing decision that has been quietly turned into a personal one.
Does low pay cause burnout, or just make it harder to accept?
Probably the second, and that still counts.
A third of teachers named salary. In the same 2026 survey, average base pay was $75,599 against more than $105,000 for the comparison group of similar working adults, and teachers’ pay made up 60 percent of household income where other workers’ made up 68. Ninety-four percent reported spending their own money on classroom supplies, averaging around $665.
The mechanism worth naming is not that low pay makes you tired. It is that fifteen unpaid hours is a different fact at different salaries. Unpaid overtime you can absorb reads as commitment. Unpaid overtime you cannot absorb reads as being taken advantage of, and that reading, rather than the hours themselves, is the corrosive part. Reward and fairness are two of the conditions the burnout literature keeps returning to, and pay sits in both of them.
Do we actually know these are causes?
Partly. The best evidence is decent, and it is not from teachers.
The strongest design available asks whether changes in conditions predict changes in burnout, rather than measuring both once and calling it causation. Schaufeli, Bakker and Van Rhenen ran that design across two waves a year apart. Increases in job demands — overload, emotionally upsetting situations, work bleeding into home — predicted burnout, standardized beta .23. Decreases in job resources — social support, autonomy, opportunities to learn, feedback — predicted it slightly more strongly, beta .27.
Read the label before using the number. The sample was 201 telecom managers at one large Dutch company, not teachers, and the authors call that sample’s homogeneity a weakness themselves. What transfers is the shape of the finding, not the coefficient: what you do not have hurts about as much as what you have too much of. That is the most useful line on this page, because the public conversation about teacher burnout is almost entirely about things being added, and half the mechanism is about what was taken away.
Now the complication, which belongs here and not in a footnote. Cause runs in both directions. A four-wave Norwegian study of 272 employees found burnout at one wave predicted higher job demands two waves later, rho .12. Small, but real, and it matches what teachers describe: the year did not only get harder, you also got less able to carry the same weight, and the two fed each other. Same caution on the label — 272 people, heavy attrition from about a thousand starters, no occupational data, and a Norwegian sick-pay system behind the absence measures.
Two things follow, and they pull in opposite directions, so hold both. One: do not read the reverse arrow as evidence the problem is in your head. Depletion changing how you read the job is a documented feature of the condition, not a character flaw. Two: do not wait for the conditions to change on their own before you do anything, because the loop runs whether or not anyone intervenes.
What about autonomy and administrative support?
Directionally supported. Thinly evidenced in teachers specifically.
Autonomy is one of the four resources in the study above, and the absence of resources was on the stronger side of that ledger. The teacher-specific evidence is weaker than you would hope. A 2025 study of 824 US teachers found autonomy moderated the relationships between administrative support, job satisfaction and burnout — but the interaction effects were small, with delta R-squared between .006 and .016; the design was cross-sectional; the burnout measure was a three-item scale the authors themselves describe as less robust than the Maslach Burnout Inventory; and nearly half the sample taught PK–5. It is the weakest source on this page and I would rather say so than dress it up.
The practical version does not need the statistics. Autonomy in a 6–12 job is mostly small and specific. Whether you choose the order of your units. Whether you can move a due date without asking. Whether the assessment you give is one you wrote. Every one of those is a decision somebody either leaves with you or takes off you. That is worth knowing when you are trying to name what is wrong, because “I have no autonomy” is nearly impossible to act on and “I cannot move a due date” is a sentence an administrator can answer.


Which cause is actually yours? A one-week demand log
You cannot get this from a list, including this one. National rankings tell you what is common. They do not tell you which load is taking you apart. So run a log for five teaching days. It takes a few minutes at the end of each day, and the first day takes longer than the rest.
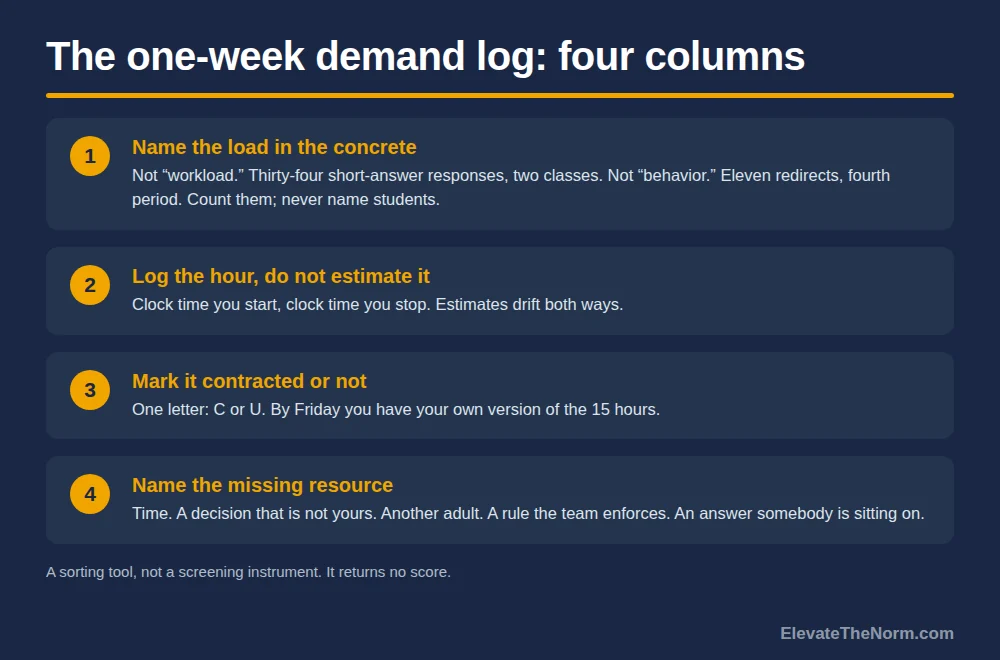
Four columns. One row for every hour you work outside your contracted day, plus a row for any class period that cost more than it should have.
- Name the load in the concrete. Not “workload.” Thirty-four short-answer responses, two classes. Not “behavior.” Eleven redirects, fourth period. Count the redirects; never write a student’s name. This is a record of your workload, not a record about a child, and the moment it names kids it becomes something else entirely. The concrete version is also the only version anybody can act on.
- Log the hour, do not estimate it. Write the clock time you start and the clock time you stop. Estimates drift in both directions, and the point is to find out what is true rather than to win an argument.
- Mark it contracted or not. One letter, C or U. By Friday you will have your own version of the fifteen hours, for your own job.
- Name the missing resource. What would have made this cost less? More time. A decision that is not yours to make. Another adult in the room. A rule the whole team actually enforces. An answer from somebody who has been sitting on it. This column is what turns a complaint into a request.
Then read it on Friday and look for one of three patterns.
- One load dominates. Most of your unpaid hours are the same activity. That is the easiest kind of ask to make, because it is specific and somebody can say yes or no to it.
- The hours are spread thin across six things. No single fix exists, which usually means the problem is the number of things rather than any one of them — so the conversation is about what comes off the plate, not how to do each one faster.
- Column four keeps saying the same word. If “a decision” or “another adult” shows up five times, the missing resource is the finding. The load was never the story.
If a week is more than you have right now, shrink it. Do one day. Or skip the first three columns entirely and fill in only column four for a week — what was missing, once a day, one line. Starting a five-day data-collection project is a strange thing to ask of somebody who is already underwater, and a partly filled sheet still tells you more than another month of guessing.
A log is not a diagnosis and it does not score you. Nothing on this page can tell you whether you are burned out. There is no validated clinical cutoff for that, and a web page is the wrong instrument regardless. What the log can do is turn “I am drowning” into four lines somebody can act on. If the honest answer after five days is that you are not coping, the next conversation is with your doctor or a counselor, not with a checklist.
One practical note. Keep it on paper, or somewhere that is not the school network. A district device is not a private place to write down that the job is beating you.
What to do next
Start with the concrete version of your worst week rather than the general one. Run the log for five days. Then take the single clearest row to whoever can act on it — your department chair or your direct administrator, through the normal chain rather than around it — and lead with the missing resource rather than the feeling, because a resource is something a person can say yes or no to in about ten seconds.
If you are a special educator, this page’s log is only half your ledger — a demand set that does not appear on this page at all sits on top of it. Expect a fair number of those asks to come back as “no,” or “not this year.” The log is still worth running, because now you know precisely which no you are living with and whether you can live with it. And it is fair to ask what the criterion is. If relief goes to whoever asks best, it is unfair to every colleague who did not ask, and a public rule for who gets a duty removed is better for a staff than a favour quietly granted.
If the log says the load itself is the problem and no resource fixes it, that is a real answer too. There are two honest directions from there: getting back on your feet once the cause has already done its work, and weighing the job you have against the one you might take. Neither is a failure. Both beat a fourth year of guessing.
And if you are reading this as the person who assigns the loads rather than the one carrying them, that four-column log is also a short, specific agenda for a conversation you can start on Monday.
Want the log as a printable? Download The One-Week Teacher Demand Log (2 pages, free, no email required) and run it for five teaching days.
Frequently asked questions
What is the number one cause of teacher burnout?
When teachers are asked to name their top sources of job-related stress, managing student behavior comes first — about half of teachers named it in RAND’s 2026 national survey, ahead of low salary at 33 percent and hours outside the contract at 32 percent. Two cautions. That ranks what teachers name, which is not the same as ranking what does the most damage, and no single cause explains an individual case. The useful question is not which cause is biggest nationally but which one is taking up your week.
Does this mean students are to blame for teacher burnout?
No. A fourteen-year-old testing a boundary is doing what fourteen-year-olds do, and it is not a student’s job to protect an adult’s wellbeing. The research measures student behavior as a workload — the volume of redirects an adult absorbs in a day — not as a moral failing. What turns that volume into a burnout driver is the absence of support around it: no agreed rule, no second adult, no answer when a teacher asks for one. Those are adult decisions, made by adults.
I am a student. Should I change how I act so my teachers do not burn out?
That is a generous question and the honest answer is no — not for that reason. Your teacher’s working conditions are set by adults with authority you do not have, and carrying an adult’s wellbeing is not a job that belongs to you. Treating people decently is worth doing on its own merits. If a teacher of yours seems to be struggling, the right move is to mention it to another adult you trust, not to try to fix it yourself.
Is grading the biggest cause of teacher burnout?
Nobody knows, and any article that tells you otherwise is guessing. RAND asked teachers how many hours they work but states plainly that its survey “did not ask teachers about the amount of time they spent on specific activities,” so there is no national figure breaking the extra hours into grading, planning, meetings, coverage or family contact. Grading may well be the biggest load in your job. It is not established as the biggest load in the profession.
How many hours do teachers actually work outside their contract?
In RAND’s 2023 survey of 1,439 K–12 teachers, the average teacher reported working 53 hours in a school-year week while nearly all said their contract covered 40 hours or less. Of the roughly 15 uncontracted hours, about 12 appeared to be uncompensated — roughly one hour in every four worked. One honest caveat, which RAND raises itself: self-reported hours tend to run high, with estimates of teachers’ overestimation ranging from two to six hours a week. The gap survives the correction; it just shrinks.
Can low pay by itself cause burnout?
The more defensible reading is that pay changes what the rest of the job means rather than causing exhaustion directly. Fifteen unpaid hours is a different fact at different salaries: overtime you can absorb reads as commitment, and overtime you cannot absorb reads as being taken advantage of. Reward and fairness are both conditions the burnout literature keeps returning to, and pay sits in both of them.
Does the research actually prove these things cause burnout?
Partly, and the honest answer has caveats. The strongest available design measures whether changes in conditions predict changes in burnout. Schaufeli, Bakker and Van Rhenen found they do — but in 201 telecom managers at one Dutch company, not in teachers. And causation runs both ways: a four-wave Norwegian study found burnout at one point predicted higher job demands later. So the conditions are real causes, the teacher-specific causal evidence is thinner than the confident headlines suggest, and the loop feeds itself once it starts.
Does burnout have one cause I can fix?
Usually not one, and the combination is the point. That is why the last section of this article is a five-day log rather than a ranked list: it is built to tell you which load and which missing resource are actually yours. But a log is not a diagnosis and it returns no score. Nothing on a web page can tell you whether you are burned out. If the honest answer after a week is that you are not coping, the next conversation is with your doctor or a counselor.
Sources
- Steiner, E. D., Levine, S., & Doan, S. (2026). Teacher Well-Being, Pay, and Intentions to Leave in 2026: Selected Findings from the 2026 State of the American Teacher Survey. RAND, RR-A4404-2. 829 K–12 public school teachers and 498 similar working adults, surveyed late January to late February 2026, weighted to be nationally representative. Source of the ranked stressors, the pay and supply-spending figures. Note the discrepancy handled in the text: RAND’s press release rounds the student-behavior figure to 52 percent while the report’s own figure reads closer to 50 and its caption says “about half.” Report · Press release
- Doan, S., Steiner, E. D., Pandey, R., & Woo, A. (2023). All Work and No Pay — Teachers’ Perceptions of Their Pay and Hours Worked. RAND, RR-A1108-9. 1,439 K–12 public school teachers and 527 comparison working adults. Source of the 53-hour week, the 15 uncontracted hours, the 12 uncompensated ones, and the satisfaction comparison — and of the self-report caveat quoted in the text. rand.org
- Aloe, A. M., Shisler, S. M., Norris, B. D., Nickerson, A. B., & Rinker, T. W. (2014). A multivariate meta-analysis of student misbehavior and teacher burnout. Educational Research Review, 12, 30–44. 21 independent samples, 63 effect sizes. Median correlation with emotional exhaustion .42 (range .09–.74); depersonalization second (.10–.71); reduced personal accomplishment smallest. Grade level was among the moderators, and substantial variability remained unexplained. sciencedirect.com
- Schaufeli, W. B., Bakker, A. B., & Van Rhenen, W. (2009). How changes in job demands and resources predict burnout, work engagement, and sickness absenteeism. Journal of Organizational Behavior, 30, 315–335. Two waves a year apart, 201 telecom managers in the Netherlands. Increases in demands predicted burnout (β = .23); decreases in resources predicted it more strongly (β = .27). Not a teacher sample, and the authors name the homogeneity of the sample as a weakness. Full text (PDF)
- Øvergård, K. I., Gottenborg, S., Hoff, T., Johnsen, S. Å. K., & Rydstedt, L. (2025). A longitudinal path analysis of the reciprocal and cyclical relationships between sickness absence, job demands, job resources, and burnout. Frontiers in Psychology, 16, 1557898. Four waves, 272 Norwegian employees. Burnout at T2 predicted job demands at T4, ρ = 0.12. Limitations stated by the authors: heavy attrition from roughly 1,000 initial respondents, a predominantly female sample, no occupational data, and a Norwegian sick-pay context. frontiersin.org
- Teacher voices matter: The role of teacher autonomy in enhancing job satisfaction and mitigating burnout (2025). PLOS ONE. 824 US teachers, cross-sectional, end of the 2021–22 school year. Autonomy moderated administrative support and job satisfaction in predicting burnout, with interaction effects of ΔR² = .006 to .016. The weakest source cited here, and labelled as such in the text: cross-sectional, a three-item burnout scale the authors themselves call less robust than the Maslach Burnout Inventory, and a sample that was 48 percent PK–5. journals.plos.org
Every source above was opened and read for this article. Where a figure could not be confirmed in the original, it is not on this page. The same discipline applied to the headline figures is on the page that traces every burnout percentage to its own survey.
About Clay Shumate
Clay Shumate is a certified secondary Social Studies teacher in the public schools of West Alabama, with seven years of classroom experience, a B.A. in History, and an M.Ed. in Secondary Education. He writes about project-based learning, student responsibility, respect, and practical ways to hold young people to a higher standard while giving them room to learn from mistakes.