By Clay Shumate
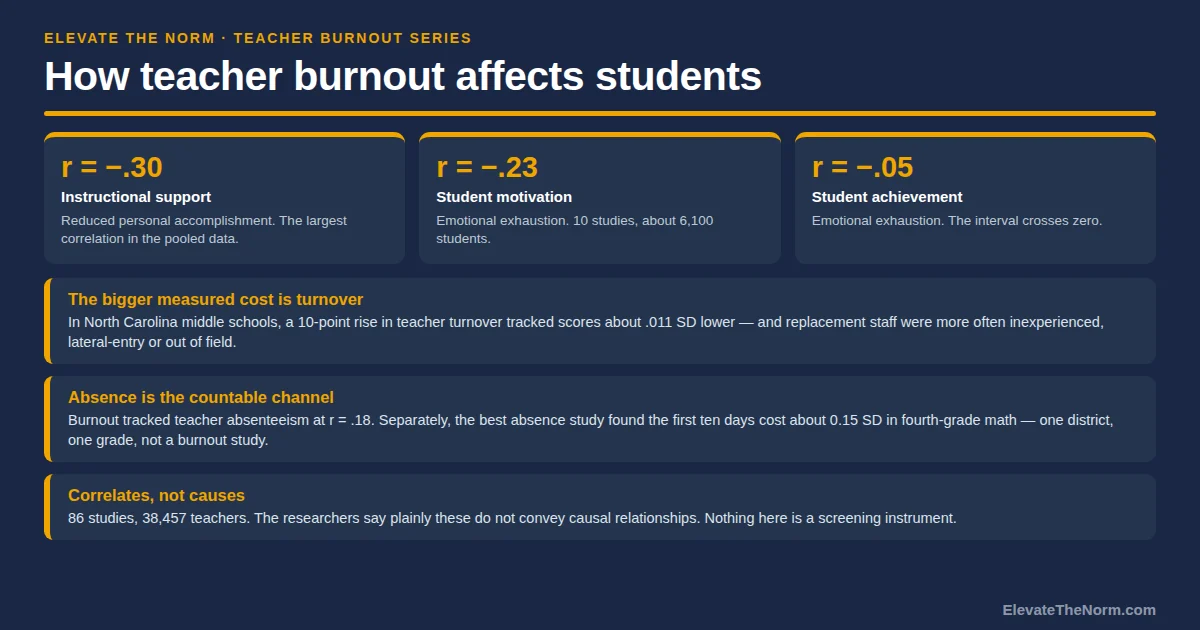
Teacher burnout shows up in students’ experience of the classroom long before it shows up in their test scores. The largest review to date links it clearly to weaker emotional support, weaker classroom management and lower student motivation — and almost not at all to achievement. The larger measured cost to students is what happens after a teacher leaves.
This page is about outcomes measured on students, and it is the one article in this series written mostly for administrators and families rather than for the teacher carrying the load. For the word itself, start with the definition and the three dimensions behind every number on this page; for what a principal or district can change, the conditions an administrator can actually change and the measured size of each one covers it and this page does not restate it. What follows is narrower: when a teacher is burned out, what actually happens to the kids in the room, and how strong that evidence really is.
Key takeaways
- The effect lands on the classroom experience, not the score. In a 2026 meta-analysis of 86 studies and 38,457 teachers, burnout correlated with weaker emotional support, classroom management and instructional support at r = −.13 to −.30.
- Student motivation is the clearest student-side link, at r = −.23 across ten samples and about 6,100 students. Achievement is the weakest link in the field: r = −.05, with a confidence interval that crosses zero.
- There is little evidence linking teacher burnout to students’ depressive symptoms or emotional distress. The alarming version of this claim is not supported.
- None of those pooled numbers says anything about an individual teacher. A correlation is a statement about tens of thousands of people at once.
- The bigger measured student cost is turnover. In North Carolina middle schools a 10-point rise in turnover tracked about .013 standard deviations lower math scores, and replacement staff were more often inexperienced, lateral-entry or teaching out of field.
- Those effects are largest in the highest-poverty and lowest-performing schools, which makes this an equity question and not only a staffing one.
- Almost none of this is causal. These are correlates — signals about conditions, not proof that one thing produced the other.
- Burnout is an occupational condition, not a diagnosis anyone gives from a web page. Nothing here is a screening instrument or a way to assess an individual teacher.
The Student-Side Continuity Check
Two printable pages. A write-in grid for the four building-level conditions behind every finding on this page, plus how to read the four answers together and what to do before acting on them. It measures a building, not a person. It is not a screening instrument and it returns no score. Free. No email address required. Designed for grades 6–12.
Download the free PDFHow does teacher burnout affect students?
Mostly through the quality of the interaction, not the quantity of the learning. When researchers pool the studies, the strongest and most consistent associations are with how the room runs and how supported students feel in it. The weakest association in the whole pile is the one people quote most: test scores.
The best current summary is a 2026 meta-analysis in Review of Educational Research by Gyde Wartenberg, Karen Aldrup, Simon Grund and Uta Klusmann, pooling 86 studies and 90 independent samples covering 38,457 teachers. It reports burnout’s three dimensions separately, which matters, because they do not behave alike.
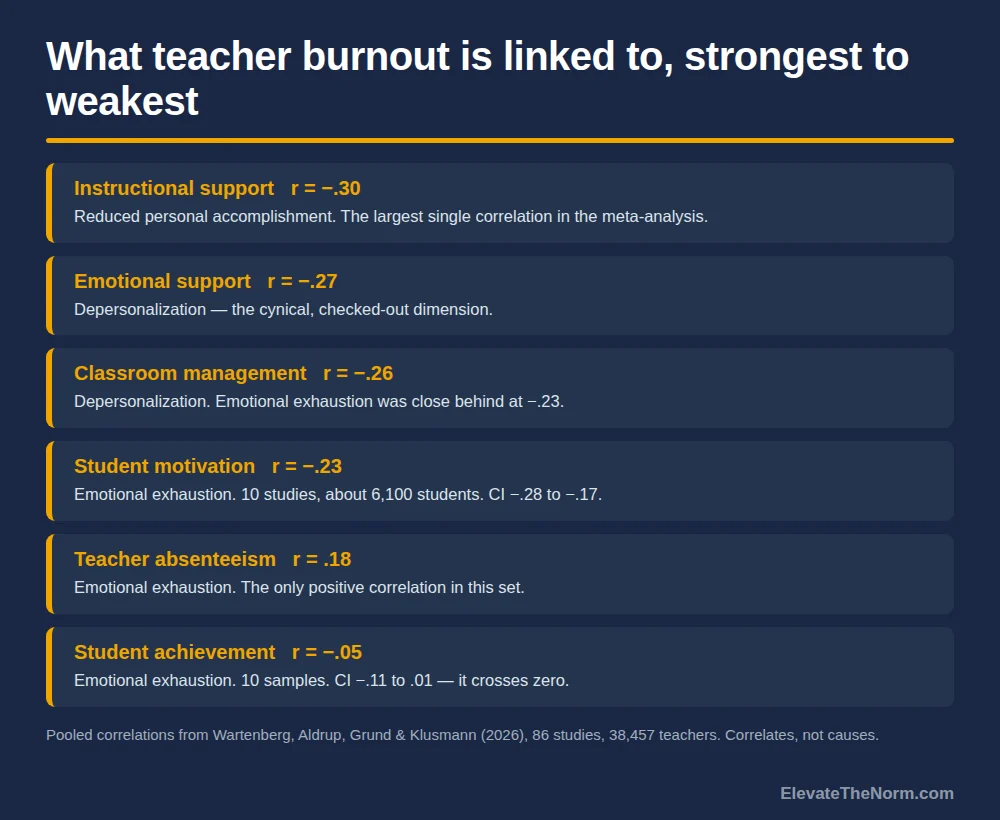
Depersonalization — the cynical, checked-out dimension — is the one most tied to how students are treated. It correlated with lower emotional support at r = −.27 and with weaker instructional support at r = −.27. Emotional exhaustion tracked with classroom management at r = −.23. Reduced personal accomplishment tracked with instructional support at r = −.30, the largest single correlation in the set.
Those are small to moderate correlations — a real signal, not a large one. A correlation of −.27 does not mean a burned-out teacher stops supporting students; it means the two move together across tens of thousands of people.
One thing has to be said before anybody reads further, particularly any teacher who found this page while having a hard year. None of these numbers is about you. A pooled correlation across 38,457 people describes a tendency in a population. It cannot tell you anything about one classroom, and it is not a verdict on whether you are failing your students. Reading it as one is statistically wrong and it is also the exact self-blame that makes a hard year harder. What follows is an argument about how schools are staffed and scheduled, not evidence against any individual.
Does teacher burnout lower students’ test scores?
The evidence does not support it, and it is the single most repeated claim about teacher burnout and students. Emotional exhaustion and student achievement pooled to r = −.05 across ten independent samples, 95 percent confidence interval −.11 to .01. An interval that crosses zero means the data cannot rule out no relationship at all.
The authors do not treat that as a surprise. They write that “individual student characteristics such as intelligence, prior knowledge, and conscientiousness…determine achievement to a large extent, thereby reducing the potential of teacher characteristics to influence student achievement.” Test scores are a noisy, slow-moving outcome with a lot of other things pushing on them.
The earlier systematic review is a little more generous. Daniel Madigan and Lisa Kim, in the International Journal of Educational Research, went through 14 studies covering 5,311 teachers and 50,616 students — eight primary, six secondary. They found burnout associated with worse achievement “more often than not,” in four of seven studies, at small-to-medium effect sizes. Their verdict on the field is blunt: “It is almost cliché to bemoan the lack of longitudinal and rigorously designed studies.”
So: four of seven studies found something, and the pooled estimate across ten samples is roughly nothing. Anyone telling you burned-out teachers demonstrably lower test scores is reporting half of that.
What changes in the room that a student would actually notice?
Autonomy, patience, and the sense that the teacher is present. This is where the secondary-specific evidence lives.
Bo Shen and colleagues, in the British Journal of Educational Psychology, surveyed 1,302 high school students and their 33 physical education teachers across 20 schools in two demographically similar Midwestern districts, at the start and end of a semester. Teachers’ emotional exhaustion was negatively related to how much autonomy support students perceived. Depersonalization was inversely related to students’ autonomous motivation even after controlling for that perceived autonomy support — so the cynical dimension had a link to motivation running past the obvious channel.
Two labels belong on that: physical education rather than a typical grades 6–12 academic classroom, and correlational over one semester. But it is a high school sample, which most of this literature is not, and the pattern matches the pooled numbers.
What that looks like in practice is not dramatic. Fewer choices offered, because choices take setup. A shorter fuse on the fourth redirect. Feedback that gets thinner in March than it was in September. Students read all of that accurately, and they usually read it as being about them.
One finding here a coach can genuinely use: the largest single correlation in the meta-analysis was between reduced personal accomplishment — the “none of this is working” dimension — and weaker instructional support. That dimension responds to evidence, because the belief underneath it is a factual claim about whether the work is landing, and claims like that can be checked. Making growth visible is a real intervention. It is also not a substitute for fixing a load that is genuinely too heavy, and a coaching cycle offered in place of staffing relief will be read as exactly what it is.
Does it affect how students feel about school?
Motivation, yes. Mental health, there is no good evidence for it.
Motivation is the clearest student-reported finding in the meta-analysis: emotional exhaustion correlated with student motivation at r = −.23, 95 percent CI −.28 to −.17, across ten studies and about 6,108 students. That interval does not cross zero.
The wellbeing claim is a different story, and it is worth saying out loud to any parent who has read a frightening headline. Madigan and Kim looked and reported “little evidence to suggest an association between teacher burnout and students’ depressive symptoms, emotional distress, or attempted suicide.” One study found exhaustion linked to slightly lower school satisfaction, a small effect. That is the whole finding. A teacher having a hard year is not measurably damaging children’s mental health, and claiming otherwise borrows a weight the research does not carry.
Which is also why a teacher’s apparent state is not a subject for the class group chat. Speculating in public about whether a particular adult is struggling is a guess about somebody’s health, it travels faster than any correction, and it does nothing about the conditions that produced the problem.
What happens to students when a teacher leaves?
This is the largest measured student-side cost in the literature, and it has the strongest designs behind it. Burnout is not the only reason teachers leave, so treat it as a downstream consequence rather than a direct burnout effect.
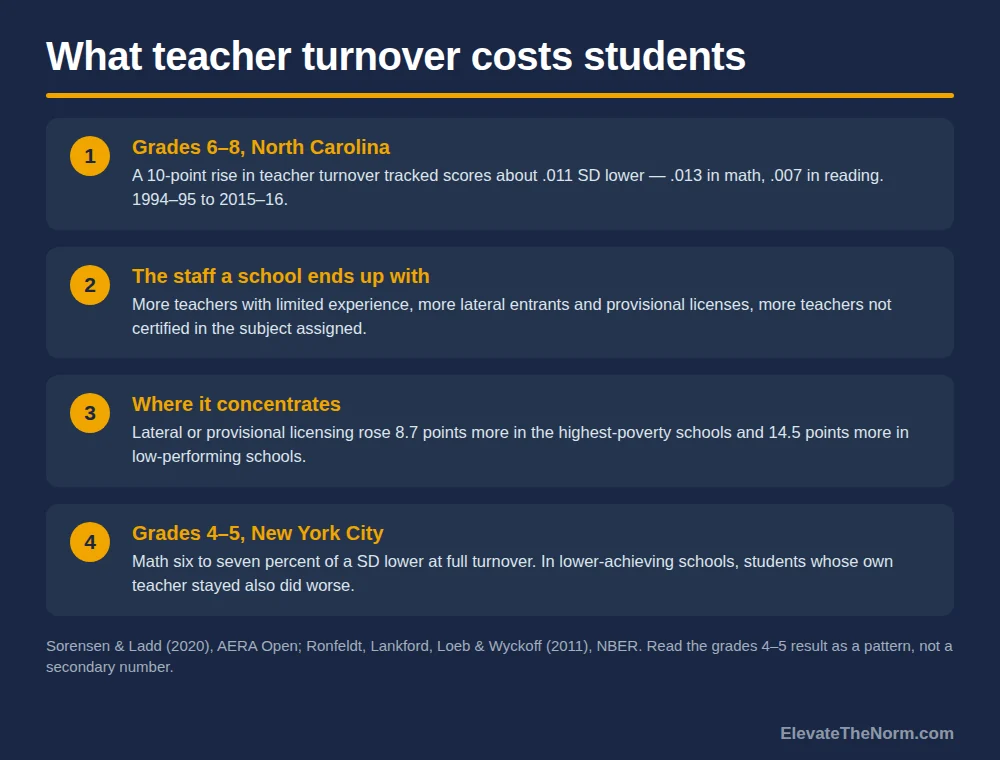
The most relevant study for grades 6–12 is Lucy Sorensen and Helen Ladd’s analysis in AERA Open, covering North Carolina middle schools — grades 6 through 8 — from 1994–95 through 2015–16. A 10 percentage point rise in teacher turnover was associated with scores about .011 standard deviations lower overall: .013 in math, .007 in reading. Small per unit, and they accumulate in buildings where turnover is chronic.
Be honest about how small that is. A hundredth of a standard deviation is close to nothing for any individual child, and citing this study as proof that turnover is devastating students oversells it. The reason to act is not the effect size. It is the second finding, about what the school is left holding.
Turnover has “marked, and lasting, negative consequences for the quality of the instructional staff.” Schools with more churn ended up with higher proportions of teachers with limited experience, more lateral entrants and provisional licenses, and more teachers not certified in the subject they were assigned. And the effect concentrated: the increase in lateral or provisionally licensed staff was 8.7 percentage points larger in the highest-poverty schools and 14.5 points larger in low-performing schools.
An earlier New York City study points the same way. Across roughly 625,000 observations of fourth and fifth graders, Matthew Ronfeldt and colleagues found math scores six to seven percent of a standard deviation lower in a grade-year with complete turnover than in one with none. The finding that matters most: the damage was not limited to students who got a new teacher. In lower-achieving schools, students whose own teacher stayed also did significantly worse when turnover around them was high; in higher-achieving schools there was no such effect. That is grades 4 and 5, so read the pattern, not the number.
Do teacher absences cost students learning?
The best study on this found a real effect — and it is a fourth-grade result in one district. Raegen Miller, Richard Murnane and John Willett examined 6,166 students and 231 teachers across 73 schools in a large urban district over two school years. The first ten days of teacher absence were associated with about 0.15 of a standard deviation lower fourth-grade math achievement.
That is the biggest number on this page, which is exactly why the caveats travel with it. One district, one grade, mathematics only — English Language Arts effects were smaller and inconsistent — leaning on instrumental variables with 16 to 24 percent of prior achievement values imputed. It is also not a burnout study. People are absent for many reasons unrelated to the job.
It matters here for one reason: the meta-analysis found emotional exhaustion associated with absenteeism at r = .18. If exhaustion raises absence a little and absence costs learning a lot, coverage is one of the few places where the student cost of a depleted staff becomes visible and countable. It sits alongside the student-attendance side of the same problem, tracked closely for the same reason.
One wrong turn is worth naming before somebody takes it. A school that answers a coverage number by leaning on staff not to take sick days has reduced nothing except its own visibility into the problem. Absence is a symptom of a staffing plan with no slack. Suppressing it leaves the plan as it was and adds sick adults to a building full of teenagers.
How much of this is actually cause and effect?
Very little of it, and the researchers say so first. This section exists because the honest version of this topic is weaker than the version that circulates.
The meta-analysis authors are explicit that they “refer to teacher absenteeism, teacher–student interactions, and student motivation and achievement as correlates” and that these “do not convey causal relationships.” Of 31 longitudinal studies they identified, only 11 reported longitudinal correlations between earlier burnout and later outcomes, and that evidence was mixed — it supported the motivation finding better than the achievement finding.
There is also a measurement problem that cuts against the strongest numbers. Correlations were stronger when the classroom-quality rating came from the teacher’s own self-report than from an outside observer. A tired teacher rating both their exhaustion and their own classroom management harshly produces a correlation without anything happening in the room. The external-observer estimates were weaker.
And the arrow may run backwards. A class that is genuinely hard to teach can exhaust a teacher, rather than an exhausted teacher making the class hard. Nothing in a cross-sectional correlation can separate those, and both are probably true at once. The practical reading is the uncomfortable one: you should take these findings seriously enough to fix conditions, and not seriously enough to blame a person.


What can a school check, without turning it into a file on a teacher?
Check the conditions, not the people. Everything above points at building-level facts that are already recorded somewhere. None of it requires assessing an individual teacher’s state of mind, and none of it should ever be written down next to a teacher’s name.
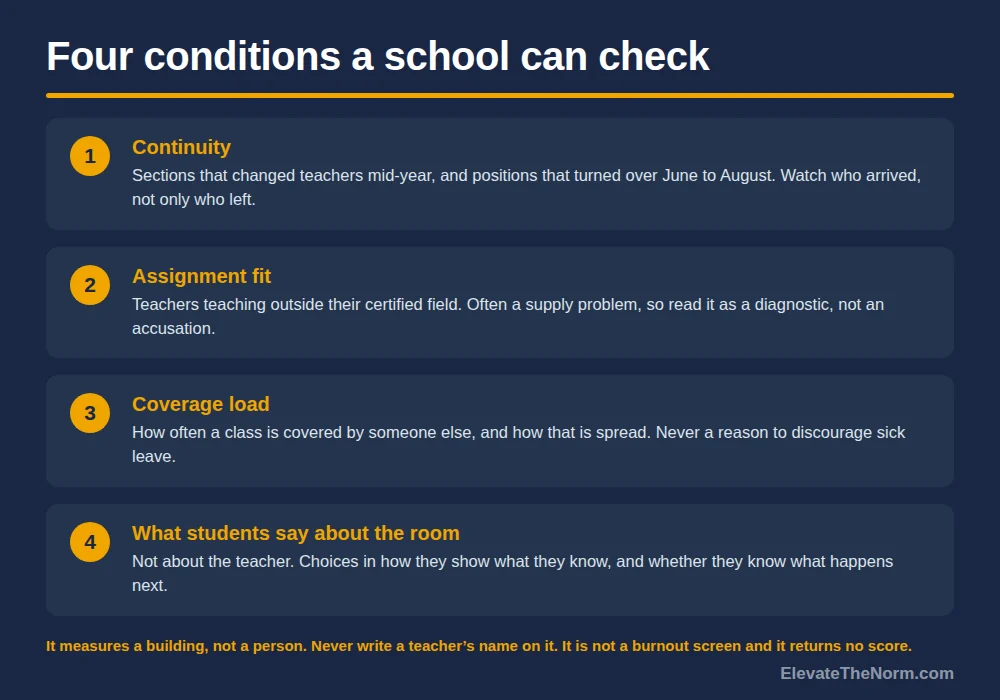
Four things are countable, and all four sit with whoever builds the schedule and the budget rather than with the person in the classroom.
- Continuity. How many sections changed teachers mid-year, and how many positions turned over between June and August? Sorensen and Ladd’s finding is about the staff a school ends up with, so watch who arrived, not only who left. Mostly central office — hiring and retention.
- Assignment fit. How many teachers are teaching outside the field they are certified in? That was one of the specific quality losses the North Carolina data documented, and it is already in the staffing file. Shared — and often a supply problem rather than a choice, which makes it a diagnostic rather than an accusation.
- Coverage load. How often is a class covered by someone other than its teacher, and how is that spread across the building? Absence is not a behavior problem to manage down. High coverage says the staffing plan has no slack in it. Building level — a principal can usually see and change this one.
- What students say about the room. Not about the teacher — about the room. Do they get choices in how they show what they know? Do they know what happens next? Climate surveys already ask this, and answers aggregate by course or grade without naming anybody. Building level.
Three lines stay attached to that list. It measures a building, not a person, so never write a teacher’s name on it and never let it feed an evaluation — a name in a box turns a diagnostic into an informal personnel record with none of the protections a real evaluation carries. It is not a burnout screen: no validated cutoff turns any of these numbers into a finding about an individual, and treating a bad number as evidence that a particular teacher is burned out is unsupported and unfair. And if you act on what you find, write the rule for who qualifies before you apply it to anyone, because a private fix for one teacher creates a fairness problem for everyone else in the hallway.
Is student behavior why teachers burn out?
No. This series has answered that four times now and the answer does not change. Managing behavior is real work and the most commonly named stressor in the national survey data, but a class of teenagers behaving like teenagers is the job, not a malfunction. What turns ordinary classroom demand into burnout is how much of it one person absorbs without help, and that is a scheduling and staffing decision. the demand side, and how good the evidence behind each piece of it is goes through that in detail.
The students who need the most redirecting usually have reasons nobody in the room has been told about, and handling the behavior itself without spending the relationship is a separate skill from carrying an unreasonable load. The two problems get confused constantly, and only one of them is fixable inside the classroom.
If you are a student reading this because you are worried about a teacher: you did not cause it, and it is not your job to fix it. Being decent to them is a good thing to do and it is not the solution to a workload problem.
What to do next
If you are an administrator, pull those four numbers for one grade level and look at them together. They are already in your data. If any of them is bad, the fix is a schedule or budget decision, not a conversation about resilience — which decisions those actually are is the companion page.
If you are a parent, the useful question at a conference is not whether a teacher seems tired. It is whether the course has had the same teacher all year, whether it is taught by someone certified in the subject, and how often it is covered by someone else. Those are answerable, and they are about the school’s plan rather than a person.
If you are a teacher and this page is why you are here: the research says the cost of an under-resourced job lands on your relationships with students before it lands on their scores. what getting back on your feet actually involves is the recovery side. Nobody gets credit for absorbing a staffing problem quietly, and students do not benefit from it either.
Want the four conditions as a printable? Download The Student-Side Continuity Check (2 pages, free, no email required) and fill it in for one grade level before your next leadership meeting.
Frequently asked questions
How does teacher burnout affect students?
Mostly through the quality of the classroom interaction rather than through achievement. In a 2026 meta-analysis of 86 studies covering 38,457 teachers, burnout correlated with weaker instructional support (r = -.30 for the reduced-personal-accomplishment dimension), weaker emotional support and classroom management (around r = -.27), and lower student motivation (r = -.23). Its correlation with student achievement was r = -.05, with a confidence interval that crosses zero. All of these are correlates. The researchers state plainly that they do not convey causal relationships.
Does teacher burnout lower test scores?
The pooled evidence does not support that claim, even though it is the version most often repeated. Across ten independent samples, emotional exhaustion and student achievement came out at r = -.05, 95 percent CI -.11 to .01. An earlier systematic review of 14 studies found burnout linked to worse achievement in four of seven studies at small-to-medium effect sizes, so the literature is split. The honest summary is that the achievement link is the weakest one in the field, not the strongest.
Should I move my child out of a burned-out teacher’s class?
The research gives you very little support for that decision. The measured achievement effect is close to zero, and a mid-year schedule change has real costs of its own: a new teacher who does not know your child, a break in the relationships that make a class work, and a knock-on effect for whoever gets moved to make room. The more useful questions are about the course rather than the person: has this section had the same teacher all year, is it taught by someone certified in the subject, and how often is it covered by somebody else. If your child is telling you something specific about how the class runs, that is worth raising directly with the school. A guess about an adult’s mental state is not.
I think my teacher has checked out. Is there anything I can do?
Describe the class, not the person. “I don’t know what we’re supposed to be doing most days” is something a counselor, a department chair or another trusted adult can act on. “My teacher is burned out” is a diagnosis you are not in a position to make, and it will usually land as a complaint about someone rather than a description of a problem. Be clear that you are trying to learn, not trying to get anyone in trouble. And be straight with yourself about the limit here: an adult’s workload is not a student’s responsibility to manage, and nothing about a teacher having a hard year is your fault or your job to fix.
Is student behavior the reason teachers burn out?
No. Managing behavior is real work and teachers name it more often than anything else when national surveys ask what stresses them, but a room of teenagers behaving like teenagers is the job rather than a malfunction. What turns ordinary classroom demand into burnout is how much of it one person is expected to absorb without support, and that is a scheduling, staffing and budget decision made by adults with titles. Students are not the cause.
Does a teacher leaving mid-year hurt students?
The evidence on turnover is the strongest student-side evidence in this whole area, and the effects are real but small per unit. In North Carolina middle schools, a 10 percentage point rise in teacher turnover was associated with test scores about .011 standard deviations lower. The more consequential finding is about staff composition: schools with more churn ended up with more inexperienced teachers, more lateral entrants and provisional licenses, and more teachers assigned outside their certification, and those shifts concentrated in the highest-poverty and lowest-performing schools.
How can a school tell whether burnout is affecting its students?
By checking conditions rather than people. Four things are already in most schools’ data: how many sections changed teachers mid-year and how many positions turned over in the summer; how many teachers are assigned outside their certified field; how often classes are covered by someone other than their teacher and how that is distributed; and what students already say on climate surveys about choice and clarity in their courses. Read those four together for one grade level. None of them requires assessing an individual teacher, and none of them should ever be recorded next to a teacher’s name.
Is there a way to screen teachers for burnout?
Not one that belongs in a school’s hands, and this site does not publish one. The research instruments used in these studies have no clinically validated cutoff, which means there is no defensible threshold at which a number becomes a finding about a person. A school using an informal checklist to decide that a particular teacher is burned out is making an unsupported judgment and creating a quasi-personnel record at the same time. Burnout is an occupational condition, not a diagnosis anyone should be handing out. If a teacher is struggling, the next step is a conversation with a person, and for their own health, with their doctor or a counselor.
Sources
- Wartenberg, G., Aldrup, K., Grund, S., & Klusmann, U. (2026). How strongly is teachers’ burnout related to teacher absenteeism, teacher–student interactions, and student motivation and achievement: A meta-analysis and systematic review. Review of Educational Research. 86 studies, 90 independent samples, 38,457 teachers. Pooled correlations used on this page: instructional support −.30 (reduced personal accomplishment), emotional support and instructional support −.27 (depersonalization), classroom management −.26 (depersonalization) and −.23 (emotional exhaustion), student motivation −.23 (95% CI −.28 to −.17, 10 studies, ~6,108 students), absenteeism .18, student achievement −.05 (95% CI −.11 to .01, 10 samples). Limitations stated by the authors: these are correlates and “do not convey causal relationships”; only 11 of 31 longitudinal studies reported longitudinal correlations; self-reported classroom quality produced stronger correlations than external ratings. Egger’s tests indicated no evidence of publication bias. journals.sagepub.com
- Madigan, D. J., & Kim, L. E. (2021). Does teacher burnout affect students? A systematic review of its association with academic achievement and student-reported outcomes. International Journal of Educational Research, 105. 14 studies, 5,311 teachers and 50,616 students; 8 primary settings and 6 secondary; 8 cross-sectional, 4 longitudinal, 2 experimental. Burnout associated with worse achievement in four of seven studies at small-to-medium effect sizes; “little evidence to suggest an association between teacher burnout and students’ depressive symptoms, emotional distress, or attempted suicide.” Read as the accepted manuscript in the White Rose repository. eprints.whiterose.ac.uk (PDF)
- Shen, B., McCaughtry, N., Martin, J., Garn, A., Kulik, N., & Fahlman, M. (2015). The relationship between teacher burnout and student motivation. British Journal of Educational Psychology, 85(4), 519–532. 1,302 high school students and 33 physical education teachers across 20 schools in two demographically similar Midwestern U.S. districts, surveyed at the start and end of a semester and analysed with hierarchical linear modelling. Emotional exhaustion negatively related to perceived teacher autonomy support; depersonalization inversely related to student autonomous motivation controlling for autonomy support. Read via the abstract in the ERIC record; the full text sits behind Wiley and was not accessible, so nothing beyond the abstract is claimed here. eric.ed.gov
- Sorensen, L. C., & Ladd, H. F. (2020). The hidden costs of teacher turnover. AERA Open, 6(1). North Carolina middle schools, grades 6–8, 1994–95 through 2015–16, math and English Language Arts. A 10 percentage point increase in turnover associated with about .011 standard deviations lower scores overall (.013 math, .007 reading); “marked, and lasting, negative consequences for the quality of the instructional staff”; the rise in lateral or provisionally licensed staff was 8.7 percentage points larger in the highest-poverty schools and 14.5 points larger in low-performing schools. Limitations stated by the authors: no value-added measures of teacher quality, and some student characteristics available only in select years. journals.sagepub.com
- Ronfeldt, M., Lankford, H., Loeb, S., & Wyckoff, J. (2011). How teacher turnover harms student achievement (NBER Working Paper No. 17176). Roughly 625,000 observations of 4th and 5th grade students in New York City, 2000–2002 and 2004–2007. Math scores six to seven percent of a standard deviation lower in grade-years with 100 percent turnover than with none; in lower-achieving schools, students whose own teacher stayed also performed significantly worse when turnover was high, while in higher-achieving schools there was no such effect. Grades 4–5, not a secondary result. Later published as Ronfeldt, Loeb & Wyckoff (2013), American Educational Research Journal, 50(1); the working paper is the version read here. nber.org (PDF)
- Miller, R. T., Murnane, R. J., & Willett, J. B. (2006). The impact of teacher absences on student achievement. Harvard Graduate School of Education / NBER Summer Institute. 6,166 fourth-grade students, 231 teachers, 73 schools in one large urban district, school years 2003 and 2004. The first ten days of teacher absence associated with about 0.15 of a standard deviation lower fourth-grade mathematics achievement. Limitations stated by the authors: one district, one grade, mathematics only (English Language Arts effects smaller and inconsistent), reliance on instrumental variables, and 16–24 percent of prior achievement values imputed. Grade 4, and an absence study rather than a burnout study. Later published in Educational Evaluation and Policy Analysis, 30(2). conference.nber.org (PDF)
Every source above was opened and read for this article. Where a figure could not be confirmed in the original, it is not on this page.
About Clay Shumate
Clay Shumate is a certified secondary Social Studies teacher in the public schools of West Alabama, with seven years of classroom experience, a B.A. in History, and an M.Ed. in Secondary Education. He writes about project-based learning, student responsibility, respect, and practical ways to hold young people to a higher standard while giving them room to learn from mistakes.
Leave a Reply
You must be logged in to post a comment.