By Clay Shumate
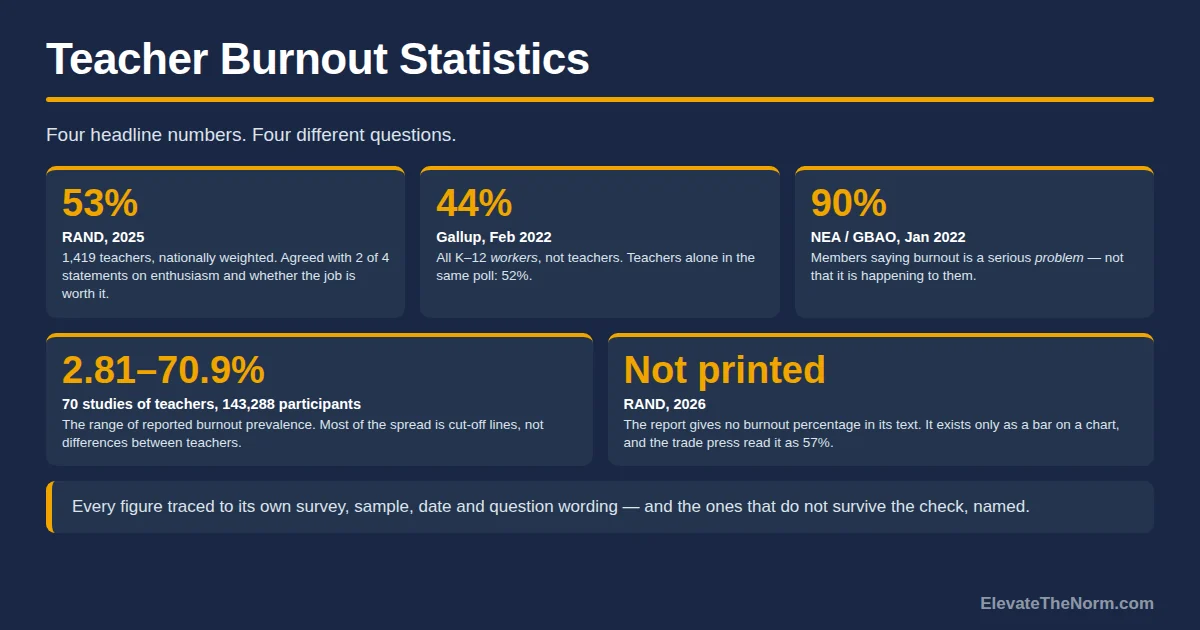
There is no single teacher burnout rate. The most-quoted figures come from four different surveys that asked four different questions of four different groups of people, and that is most of why they range from 44 percent to 90 percent. This page traces each number back to its own survey — who was asked, when, how many, and what the question actually said.
Every other page in this series uses a number in service of an argument. This one is about the numbers themselves. If you want the word defined, start with the three dimensions every one of these surveys is trying to approximate. If you want to know whether what you are feeling has a name, the symptom picture underneath the percentages is the better page. What follows is provenance: which statistics on teacher burnout survive a check, which ones do not, and how to tell the difference in about two minutes.
That matters more than it sounds like it should, because these numbers get spent. A figure showing that most teachers consider burnout a serious problem justifies an awareness campaign and a webinar. A figure showing how many hours teachers actually work justifies a schedule change. The same concern, measured two ways, buys two completely different things — and the wrong number in a board presentation buys the cheap one.
Key takeaways
- The most defensible current figure is 53 percent — the share of teachers meeting RAND’s burnout measure in its 2025 national survey of 1,419 teachers. That measure is a four-statement scale about enthusiasm and whether the job is worth it. It is not the Maslach Burnout Inventory and it is not a diagnosis.
- The famous 44 percent is Gallup’s, from February 2022, and it describes all K–12 workers — aides, drivers and office staff included. The teacher-only figure in that same poll was 52 percent.
- “Ninety percent of teachers report burnout” is not what was measured. In the NEA survey that figure comes from, 90 percent of members said burnout is a serious problem in the profession. That is a question about the job, not about the person answering.
- Across 70 studies of teachers, reported burnout prevalence ran from 2.81 percent to 70.9 percent. Most of that spread is instruments and cut-off lines, not differences between teachers.
- RAND’s 2026 report does not print its own burnout percentage anywhere in the text. It is a bar on a chart, and the trade press read it as 57 percent.
- Headlines in June 2026 said teacher burnout hit an all-time high. The report they were written about says the 2026 share was within four percentage points of 2023, 2024 and 2025.
- None of these numbers is about you. A prevalence figure describes a population, and there is no validated threshold anywhere in this literature that a person crosses.
The Teacher Burnout Statistic Check
Two printable pages. A write-in sheet for running any burnout number through the five questions on this page — who was asked, how many and weighted to what, when, what the question said, and where the figure was actually printed — plus the four benchmark statistics with what each one measured, and a line you can cite without overstating it. It is not a screening instrument and it returns no score. Free. No email address required. Designed for grades 6–12.
Download the free PDFWhat is the current teacher burnout rate?
The most defensible answer is 53 percent, and it comes with a label. In RAND’s 2025 State of the American Teacher survey — 1,419 K–12 public school teachers, fielded from late January to March 2025 and weighted to the national teacher population — 53 percent met the survey’s burnout measure. That is the figure to use if you need one figure.
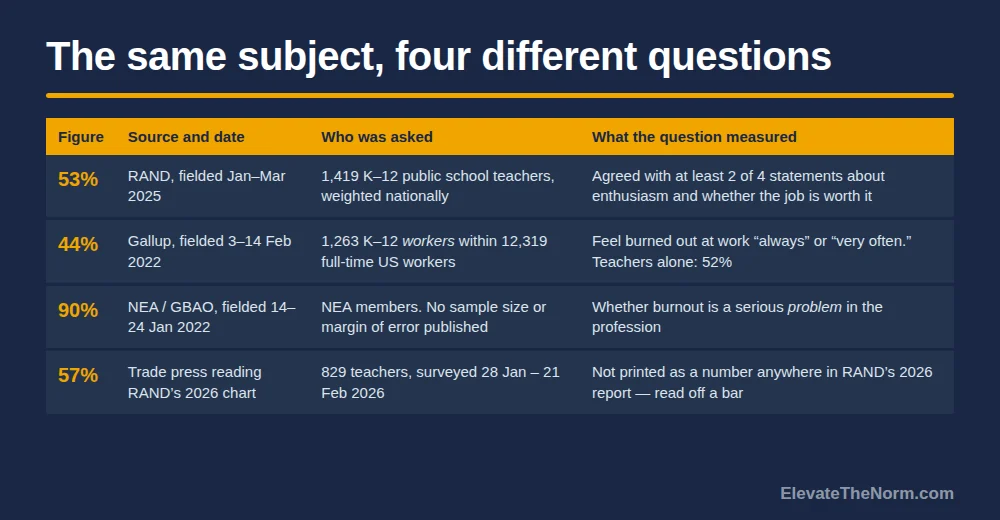
The 2026 edition is where it gets awkward. RAND surveyed 829 teachers between 28 January and 21 February 2026, plus 498 similar working adults in February, and reported that the 2026 burnout share was similar to 2023, 2024 and 2025 — “differences were 4 percentage points or fewer.” It does not say what the 2026 share was. The percentage exists only as a bar in the report’s first chart; the univariate tables live in separate annex files. Reading that chart, the education trade outlet K–12 Dive reported teacher burnout rising from 54 percent in 2021 to 57 percent in 2026. That is a reasonable reading of a picture, and it is not the same thing as a published figure.
One 2026 number is printed in plain text, and it is the one worth carrying: 55 percent of teachers reported frequent job-related stress, against 34 percent of similar working adults — down from 62 percent of teachers in 2025. Stress and burnout are different measures, and only one of them got written down.
Any single national figure also flattens a gap the surveys keep finding. In RAND’s 2026 data, 59 percent of female teachers reported frequent job-related stress against 44 percent of male teachers, and Gallup found the same direction in 2022, with female teachers at 55 percent. A district reporting one average to its board is reporting a number that does not describe half its staff particularly well.
Why do the statistics on teacher burnout disagree so much?
Because burnout has no agreed threshold, so every researcher draws the line somewhere slightly different. A 2022 scoping review in the International Journal of Environmental Research and Public Health pulled together 70 studies of teachers covering 143,288 participants. Reported burnout prevalence across them ran from 2.81 percent to 70.9 percent. Restricted to moderate-to-severe levels it still ran from 25.12 percent to 74 percent.

Those studies were not measuring wildly different teachers. Eighty-four percent of the burnout studies in that review used the same instrument — the Maslach Burnout Inventory. The inventory returns scores on three dimensions; turning scores into a headcount requires someone to decide how high is high enough, and the decision is not standardised.
Medicine has the cleanest demonstration of what that does. A 2018 JAMA systematic review of physician burnout examined 182 studies covering 109,628 people in 45 countries and found 47 distinct definitions of overall burnout prevalence, with reported rates from 0 percent to 80.5 percent. The authors concluded that the inconsistency made it impossible to determine reliably how burnout related to sex, age, geography, specialty or time. Those were doctors, not teachers — but the measurement problem is the same one, and it is the reason two honest surveys of the same profession in the same year can be twenty points apart.
Where does the 44 percent teacher burnout figure come from?
Gallup, February 2022 — and it is not a teacher figure. The Gallup Panel Workforce Study surveyed 12,319 full-time US workers between 3 and 14 February 2022, including 1,263 people working in K–12 education, with a sampling error of plus or minus 4.0 percentage points for that subgroup. Forty-four percent of K–12 workers said they feel burned out at work always or very often. That category includes aides, drivers, custodians and office staff alongside teachers.
The teacher-only figure in the same study was 52 percent. College and university workers came in at 35 percent and all other workers at 30 percent. So the honest version of the headline is this: in a pandemic winter four years ago, on an always-or-very-often question, K–12 education reported the highest burnout of any industry Gallup measured, and teachers specifically were higher still.
What has happened to that number since is that it got shortened. “Forty-four percent of teachers are burned out” understates the teacher figure and misdescribes the group. It is the most common single error in this entire subject, and it takes one click to catch.
Is “90 percent of teachers are burned out” a real statistic?
No — that is not what the question asked. The 90 percent comes from a National Education Association survey fielded by GBAO Strategies between 14 and 24 January 2022. What it found was that 90 percent of NEA members said feeling burned out is a serious problem, with 67 percent calling it very serious. Asking whether something is a serious problem in your profession is a different question from asking whether it is happening to you.
Two other things about that survey belong on the label. It sampled NEA members, not teachers generally, and the press release announcing it does not publish a sample size or a margin of error. The widely repeated “55 percent plan to leave sooner than planned” is from the same poll and carries the same caveats.
None of that makes the survey dishonest. A membership organisation polling its own members about conditions in the job is doing something legitimate, and 90 percent of a union’s members naming burnout as a serious problem is a real and useful fact. It is just not a prevalence rate, and it should never be cited as one.
What did RAND actually measure?
Four statements, and agreeing with any two of them counts. RAND’s technical documentation defines burnout as the percentage of teachers who somewhat agree or strongly agree with at least two of the following: that the stress and disappointments of the job are not really worth it; that they do not have as much enthusiasm now as when they began; that they look forward to the job in future; and that they are glad they chose it as a career. The last two are reverse-coded — disagreement is what scores.
Read it twice and the scale of the thing becomes clear. A teacher who somewhat agrees that their enthusiasm has dimmed since year one, and somewhat disagrees that they look forward to next year, is counted. That is a real and meaningful signal about a workforce. It is not a clinical finding about a person, and RAND does not present it as one.
This is what a measure built for tracking change looks like. It is broad, stable and cheap to repeat every spring, which makes it good at answering “is this getting better or worse” and bad at answering “how many teachers are seriously unwell.” Most arguments about teacher burnout statistics are arguments about which of those two questions the number was built for.
Did teacher burnout hit an all-time high in 2026?
Not according to the report the headlines were written about. In June 2026 an education trade outlet ran the headline “Teacher burnout is at an all-time high.” The RAND report underneath it says the 2026 shares reporting burnout and symptoms of depression were similar to 2023, 2024 and 2025, with differences of four percentage points or fewer. A different outlet reading the same chart described a rise from 54 percent to 57 percent across five years. Both were looking at the same picture.
Here is the part that cuts the other way, and it is the part the correction usually leaves out. RAND’s central finding in 2026 is that teachers were more likely than similar working adults to report poor well-being on every indicator — a pattern it has recorded every year since 2021. Frequent job-related stress did fall, from 62 percent to 55 percent, but it is still 21 points above the comparison group. “Still much worse than everyone else, and not obviously getting worse” is the supportable summary. It is less quotable than either headline.
One admission belongs here, because this site made the same class of error. An earlier article in this series cited about 28 percent of teachers against about 17 percent of similar working adults as RAND’s 2026 burnout figures. Those numbers were read off the wrong bar of that same chart; they belong to a different indicator, not to burnout. The article has been corrected. When a source publishes a finding only as a picture, everyone downstream is guessing, and some of them guess wrong.
One thing this page is not doing, and it needs saying plainly. Uncertainty about the rate is not uncertainty about the condition. Every credible source here — a probability panel, a nationally weighted teacher panel, 70 peer-reviewed studies and a membership poll, using four different methods — finds teachers worse off than comparable workers. They disagree about how many. They do not disagree about the direction. If you are an administrator and the useful thing you took from this page is that the numbers are shaky, you took the wrong thing: correcting a statistic is not the same as answering a complaint.
How do you check a teacher burnout statistic before repeating it?
Five questions, and any number that cannot answer all five does not go in your slide deck. This is the whole method, and it works on any social statistic, not just this one.
- Who was asked? A probability panel, a nationally weighted teacher panel, an organisation’s own members, or whoever clicked a link. These are four different things and only the first two support the word “of teachers.”
- How many, and weighted to what? A figure with no sample size attached is not a statistic yet. RAND publishes 829 and 1,419 and says how it weights them; the NEA press release publishes neither.
- When? A February 2022 number is a pandemic-winter number. Four years is a long time in this particular subject, and the direction of travel since then has not been flat.
- What exactly did the question say? “Is burnout a serious problem” and “are you burned out” produce numbers 37 points apart. Find the wording, not the summary of the wording.
- Where was the figure printed? In the report text, in a published table, or only as a bar on a chart? If it is only a bar, everyone quoting it is reading a picture, and you should say so.

A sixth question is worth asking quietly: who paid for the survey, and what do they need it to say? That is not an accusation. An advocacy organisation, a research institute and a polling company are answering different questions for different reasons, and knowing which one you are holding tells you what it can carry.
If you have thirty seconds rather than five minutes, run question four on its own. Find the exact wording of the question. It catches most of the errors in this subject by itself, including both of the big ones above.
And if you are the one presenting the number — in professional development, at a faculty meeting, in a newsletter to families — the number is not the argument. A statistic teachers cannot recognise themselves in costs you the room for the rest of the year. Open with the local count and let the national figure sit behind it as context.

What can these numbers not tell you?
Anything about you, and anything about your building. A prevalence figure describes a population. Reading 53 percent as a verdict on yourself is statistically wrong, and it is also the exact self-blame that makes a hard year harder. There is no validated cut-off in this literature that a person crosses, which is why there is no quiz on this site and why nothing on this page returns a score.
A national percentage also cannot tell you which part of your own week is the problem. That takes a local count, and the loads it usually implicates — behaviour, hours, family contact, grading structure — each have their own fix. Which demands the evidence actually implicates is a separate question with a separate answer, and the numbers a school leader can actually act on are local ones.
A district that wants a real number already has better material than any national survey: exit-interview reasons, vacancy counts by subject, how long postings stay open, sick-leave use by month, transfer requests, and the share of staff carrying an extra section. Those are administrative records rather than opinions, they are already collected, and they answer the question a board actually needs answered — which buildings, which subjects, and how much.
If you run your own staff survey instead, anonymity is not a courtesy — it is a measurement requirement. Staff asked to name themselves on a wellbeing question will answer conservatively, in a predictable direction, and the resulting number will be wrong in a way no analysis can fix. It is also a records problem: a non-anonymous staff wellbeing survey creates a document about identifiable employees, held by their employer, and nobody should be asked to write “I am not coping” next to their name on a district system. Collect it anonymously, report it by building rather than by department where departments are small enough to identify people, and do not ask for anything you do not intend to act on.
One more limit worth naming: none of these surveys asked a student anything, and none of them measures a student. Where a stressor ranking puts student behaviour near the top, it is describing how a room of thirty is staffed, scheduled and supported — not the people in it. Families should also note that a workforce percentage says nothing about any individual teacher, and a specific teacher’s apparent state is not a subject for the class group chat.
And if the reason you are reading a page of statistics is that you recognise yourself in them, the statistics are the wrong tool. That is a conversation with your doctor or a counsellor — a person, not a percentage.
What to do next
If you are about to put a burnout number in front of a faculty meeting, a school board or a grant reviewer, run it through the five questions first. If you need one defensible figure, use RAND’s 53 percent from 2025 and say what it measured — a four-statement scale, nationally weighted, not a diagnosis. If someone hands you 44 or 90 percent, you now know what both of those actually counted.
And if you are reading this because the numbers describe your year rather than your slide deck, skip the statistics entirely. The student-side findings get misquoted in exactly the same way, and none of it changes what is true in your own room on Monday. The same provenance question is worth asking of the instruments and not only the surveys — here is where the burnout cut-off scores came from, and why they were withdrawn.
Want the check as a printable? Download The Teacher Burnout Statistic Check (2 pages, free, no email required) and run the next number somebody hands you through the five questions before you repeat it.
Frequently asked questions
What is the most reliable teacher burnout statistic?
RAND’s State of the American Teacher survey, because it publishes its sample, its weighting and its measure. In 2025 it found that 53 percent of a nationally weighted sample of 1,419 K–12 public school teachers met its burnout measure. Cite it with the measure attached: agreement with at least two of four statements about enthusiasm and whether the job is worth it. RAND’s 2026 report says the share was within four percentage points of 2023, 2024 and 2025 but does not print the 2026 figure in its text, so if you need a number rather than a direction, 2025 is the most recent one actually published as a number.
Why do teacher burnout statistics vary so widely?
Because there is no agreed threshold for counting a person as burned out. A 2022 scoping review of 70 studies of teachers, covering 143,288 participants, found reported prevalence running from 2.81 percent to 70.9 percent — and 84 percent of those burnout studies used the same instrument. The instrument returns scores on three dimensions; turning scores into a headcount means somebody has to pick a cut-off, and the pick is not standardised. A JAMA review of physician burnout found 47 distinct definitions of overall prevalence across 182 studies. Different questions, different cut lines and different years — not different teachers.
Is the 44 percent burnout figure about teachers?
No. It is Gallup’s, from a survey of 12,319 full-time US workers fielded 3–14 February 2022, and it describes everyone working in K–12 education — aides, drivers, custodians and office staff as well as teachers. The teacher-only figure in the same study was 52 percent. If you want Gallup’s teacher number, use 52. If you want Gallup’s industry number, use 44 and say “K–12 workers,” not “teachers.”
Does “90 percent of teachers are burned out” mean 90 percent are burned out?
No. In the National Education Association survey behind that figure, fielded by GBAO Strategies from 14 to 24 January 2022, 90 percent of NEA members said feeling burned out is a serious problem, with 67 percent calling it very serious. That is a judgment about the profession, not a report about the person answering. The survey also polled members rather than teachers generally, and the press release announcing it publishes no sample size and no margin of error. It is a real finding. It is not a prevalence rate and should not be cited as one.
Can I use these statistics to work out whether I am burned out?
No — and not because you are not entitled to an answer. There is no clinically validated cut-off anywhere in this literature, which means no number on this page is a line you are either over or under. A prevalence figure describes a population; applied to one person it says nothing at all. If you want to think through what you are actually experiencing, the symptom page is the better starting point. If it is affecting your sleep, your health or your ability to do ordinary things, the next step is a conversation with your doctor or a counsellor rather than a percentage.
Should my school or district run its own teacher burnout survey?
It can be far more useful than any national figure, with two conditions. It has to be anonymous — staff asked to put a name to a wellbeing question answer conservatively, so a non-anonymous survey produces a wrong number and a file on identifiable employees at the same time. And do not ask unless you intend to act; a survey that produces no change teaches staff that the next one is not worth answering honestly either. Before running one, check whether records you already hold — vacancy counts, how long postings stay open, sick-leave use by month, exit reasons — answer the question without a survey at all.
Headlines say most teachers are burned out. Should I worry about my child’s teacher?
Not on the strength of a percentage. These figures describe a national workforce and say nothing about any individual — the teacher in your child’s room may be having their best year. Where researchers have measured effects on students, the associations show up in the classroom experience rather than in test scores, and the strongest claims about student mental health are not supported by the evidence. If you do have a concern, the useful conversation is with the school about staffing and workload — not speculation about a named teacher in a group chat.
I’m writing a paper on teacher burnout. Which statistic should I use?
Use RAND’s 53 percent from the 2025 State of the American Teacher survey, cite the report itself rather than a news article about it, and write the measure into your sentence: 53 percent of a nationally weighted sample of 1,419 US public school teachers agreed with at least two of four statements indicating burnout. Written that way it cannot be misread. If your paper needs to explain why the estimates disagree, the 2022 scoping review and the JAMA physician review are the two sources that make the point best. And avoid any figure whose exact question wording you cannot find — if you cannot quote the question, you cannot defend the number.
Sources
- Steiner, E. D., Levine, R., & Doan, S. (2026). Teacher Well-Being, Pay, and Intentions to Leave in 2026: Selected Findings from the 2026 State of the American Teacher Survey. RAND, RR-A4404-2. 829 K–12 public school teachers surveyed 28 January to 21 February 2026 and 498 similar working adults in February 2026, weighted to the national teacher population. 55 percent of teachers reported frequent job-related stress against 34 percent of similar working adults, down from 62 percent of teachers in 2025; 59 percent of female against 44 percent of male teachers. The report states that the 2026 burnout share was within four percentage points of 2023, 2024 and 2025 but does not print the figure in its text — it appears only as a bar in Figure 1. rand.org
- RAND (2026). State of the American Teacher Survey: 2026 Technical Documentation and Survey Results. RR-A4404-3. Source for the burnout construct quoted on this page — somewhat or strongly agreeing with at least two of four statements — and for the fielding windows. The univariate percentage tables are published in separate annex files rather than in the report itself. rand.org
- Steiner, E. D., et al. (2025). Teacher Well-Being, Pay, and Intentions to Leave in 2025. RAND, RR-A1108-16. Figure 1: 53 percent of teachers met the burnout measure; 1,419 teachers, fielded January to March 2025. This is the source of the 53 percent figure used throughout. rand.org
- Gallup (2022). K-12 Workers Have Highest Burnout Rate in U.S. Gallup Panel Workforce Study, a web survey of 12,319 US full-time workers fielded 3–14 February 2022 using Gallup’s probability-based panel, including 1,263 people in K–12 education, sampling error ±4.0 percentage points for that subgroup. 44 percent of K–12 workers, 52 percent of K–12 teachers, 55 percent of female teachers, 35 percent of college and university workers and 30 percent of all other workers reported feeling burned out always or very often. news.gallup.com
- National Education Association (2022). Press release on a survey conducted by GBAO Strategies, 14–24 January 2022: 90 percent of members said feeling burned out is a serious problem, 67 percent very serious, and 55 percent said they plan to leave education sooner than planned. The release reports NEA members rather than teachers generally and publishes neither a sample size nor a margin of error. nea.org
- Agyapong, B., Obuobi-Donkor, G., Burback, L., & Wei, Y. (2022). Stress, burnout, anxiety and depression among teachers: a scoping review. International Journal of Environmental Research and Public Health, 19(17), 10706. 70 studies, 143,288 participants. Reported burnout prevalence 2.81 to 70.9 percent overall and 25.12 to 74 percent for moderate-to-severe levels; the Maslach Burnout Inventory was used in 84 percent of the burnout studies. mdpi.com
- Rotenstein, L. S., et al. (2018). Prevalence of burnout among physicians: a systematic review. JAMA, 320(11). 182 studies, 109,628 individuals, 45 countries; 47 distinct definitions of overall burnout prevalence and reported rates from 0 to 80.5 percent. The JAMA article itself could not be opened from this session, so the figures above are taken from Healio’s report of it and are attributed to that summary rather than to a reading of the original. Physicians, not teachers — cited here for the measurement problem only. healio.com
- K-12 Dive (2026). Despite fewer exit plans, teacher stress, burnout still high. Cited on this page as an example of reading Figure 1 rather than as an independent source: it reports teacher burnout rising from 54 percent in 2021 to 57 percent in 2026. k12dive.com
- eSchool News (2026). Teacher burnout is at an all-time high. Cited as the headline discussed above, published about a report whose own text describes the 2026 burnout share as similar to the three previous years. eschoolnews.com
Every source above was opened and read for this article. Where a figure could not be confirmed in the original, the page says so rather than publishing it.
About Clay Shumate
Clay Shumate is a certified secondary Social Studies teacher in the public schools of West Alabama, with seven years of classroom experience, a B.A. in History, and an M.Ed. in Secondary Education. He writes about project-based learning, student responsibility, respect, and practical ways to hold young people to a higher standard while giving them room to learn from mistakes.