By Clay Shumate
Project based learning social studies means students investigate a real question using the discipline’s own tools — primary sources, data, maps, competing interpretations — and produce something for an audience outside the gradebook. It is not a poster made after the unit ends. The inquiry comes first, the content is learned in service of answering it, and the product has to survive someone else reading it.
Key takeaways
- The strongest evidence in social studies is narrow. The best-designed study is a randomized trial of one course — AP U.S. Government — in five urban districts. It found real gains, and its authors publish real caveats. Nobody has run that study on 7th grade geography.
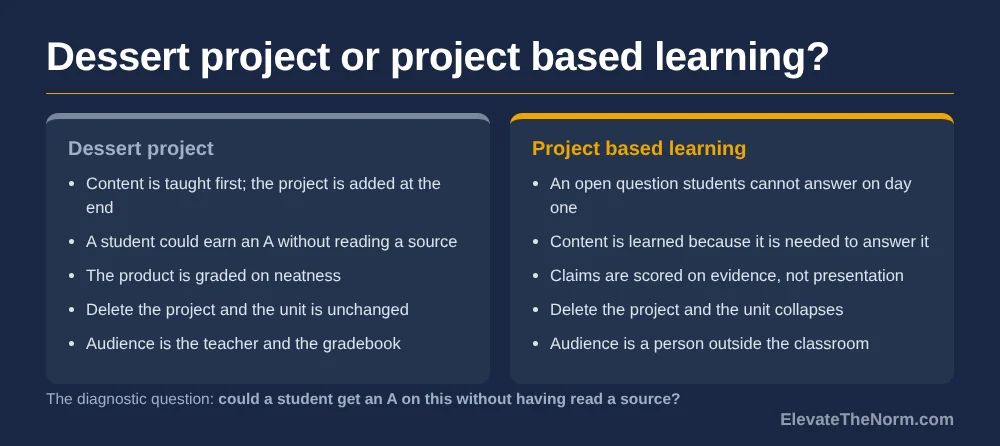
- A project is PBL when the question drives the learning. If you could delete the project and still teach the unit the same way, it is a dessert project, not project based learning.
- Social studies has a built-in structure for this. The C3 Framework’s Inquiry Arc — question, disciplinary tools, sources and evidence, informed action — is already a four-step PBL spine.
- The failure modes are specific to this subject: craft projects with no argument, presentism, simulations of atrocity, and claims students cannot source.
- Start with one project, not a redesign. Nearly every teacher who tries to convert a whole course at once abandons it by November.
Free Download · 2-page PDF
Social Studies Project Planner
The driving-question test, a C3 Inquiry Arc map, the audience line, three checkpoints, the four failure-mode checks, and a grading split that keeps group work from hiding a weak student.
Free. No email address required. Designed for grades 6–12. Browse every printable in Your Free Library.
What makes a social studies project actually project based learning?
The test is whether the question comes first. In a dessert project, you teach the Industrial Revolution for three weeks and then students build a model factory. In project based learning, students open with a question they cannot answer yet — “Was industrialization worth what it cost the people who lived through it?” — and the three weeks of content exist because they need it to answer.
That distinction is not a style preference. It changes what students do all day. In the first version they are receiving and then decorating. In the second they are sorting evidence, finding that two sources disagree, and deciding what they are willing to claim in public. If you want the full breakdown of that line, I wrote about it in what project based learning actually is and in the seven steps from driving question to public product.
The C3 Framework already gives you the spine
Social studies teachers have an advantage here that science and math teachers do not: our professional organization published the structure in 2013 and most state standards have absorbed it. The College, Career, and Civic Life (C3) Framework, from the National Council for the Social Studies, organizes inquiry into four dimensions — developing questions and planning inquiries, applying disciplinary concepts and tools, evaluating sources and using evidence, and communicating conclusions and taking informed action.
Read that list again as a project plan. Dimension 1 is your driving question. Dimension 2 is your content instruction. Dimension 3 is the research phase. Dimension 4 is your public product. The C3 Framework is not a PBL document and does not claim to be, but the Inquiry Arc and a well-built project are the same shape, which means a project you design this way is easier to defend to an administrator asking what standard it serves.
What the research actually says — and what it does not
The best evidence for project based learning in social studies comes from one course, and it is genuinely good evidence. I am going to give you the numbers and then the caveats, because the caveats are the part most articles skip.
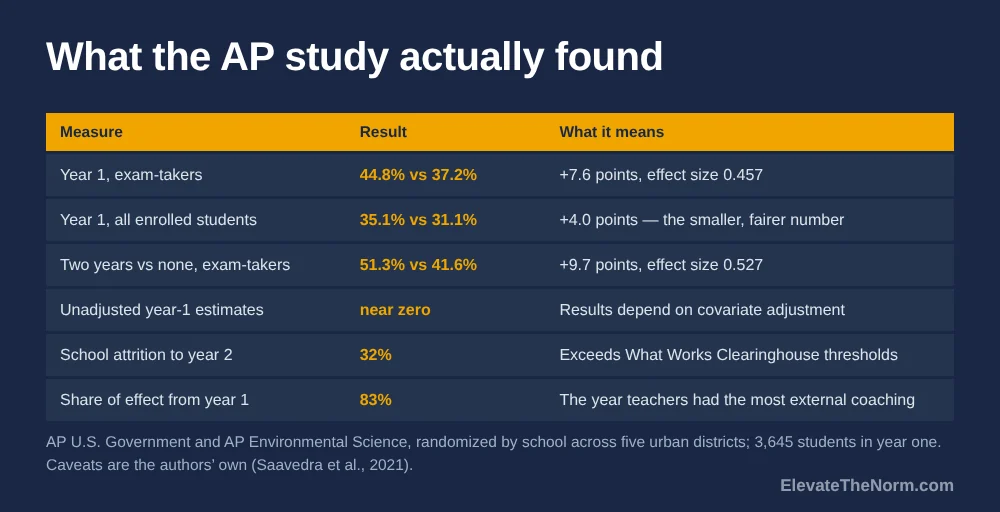
Researchers at USC ran a school-level randomized controlled trial of Knowledge in Action, a project-based version of AP U.S. Government and AP Environmental Science, across five primarily urban districts. In year one, 74 teachers in 68 schools and 3,645 students. Among students who actually sat the exam, 44.8% of the project-based group earned a qualifying score of 3 or higher, against 37.2% of the comparison group — a 7.6-point difference, effect size 0.457. Students who had a second-year KIA teacher did better still, 51.3% against 41.6% (Saavedra et al., 2021).
Now the caveats, which come from the authors themselves rather than from critics:
- The full-sample number is smaller than the headline. Counting every enrolled student rather than only exam-takers, the year-one gap was 35.1% against 31.1% — four points, not eight.
- Unadjusted year-one estimates were close to zero. The results depend on covariate adjustment. The authors say so plainly.
- Attrition exceeded What Works Clearinghouse thresholds — 32% overall from randomization to year two, with a 22-point differential.
- Year two on its own was inconclusive. The year-two-versus-year-one difference was not statistically significant.
- Most of the effect was front-loaded. 83% of the exam-taker effect came from the first year, which is also the year teachers got the most external coaching (Saavedra & Rapaport, 2021).
So here is the honest summary. A carefully built, heavily supported project-based social studies course beat a lecture-based version of the same course on the same external exam, for low-income and higher-income students alike. That is a real result and it is better evidence than most instructional fashions ever produce. It is also one AP course, in urban districts, with coaching most of us will never get. Nobody has run that trial on 8th grade U.S. History. Anyone who tells you the research proves PBL works in social studies generally is quoting a study they did not read.
25 project based learning social studies projects for grades 6–12
Each of these starts with a question students cannot answer on day one, ends with something a person outside the classroom will read or watch, and uses the discipline’s actual tools to get from one to the other. Time estimates assume a standard period. Grade bands are a starting point, not a ceiling — most of these scale up by raising the source difficulty rather than changing the task.
Civics and government (1–5)
| # | Project | Driving question | Grades | Time | Public product |
|---|---|---|---|---|---|
| 1 | Local ordinance audit | Which city ordinance most needs updating, and what would we replace it with? | 9–12 | 3 weeks | Written proposal delivered to a council member’s office |
| 2 | School policy review board | Is our school’s phone policy achieving what it was written to achieve? | 7–12 | 2 weeks | Recommendation memo and presentation to administration |
| 3 | Ballot measure explainer | What is actually on our ballot, and what would each option change? | 9–12 | 2 weeks | Nonpartisan voter guide distributed before an election |
| 4 | Rights case file | Where is the line between student speech and school disruption? | 8–12 | 2 weeks | Case brief and moot argument before a visiting attorney |
| 5 | Budget tradeoff hearing | If the district had to cut three percent, where should it come from? | 9–12 | 2–3 weeks | Costed proposal with tradeoffs named, presented publicly |
Why these are PBL and not reports: every one has a decision at the end that a reasonable person could make differently. A report on how a bill becomes a law has a right answer in the textbook. “Which ordinance most needs updating” does not, so students have to defend a choice. If you want more in this strand, the civics project ideas collection goes deeper on the government side.
United States history (6–10)
| # | Project | Driving question | Grades | Time | Public product |
|---|---|---|---|---|---|
| 6 | Monument review | Who does our town’s commemorative landscape remember, and who is missing? | 8–12 | 3 weeks | Proposed marker text submitted to a historical commission |
| 7 | Census block biography | Who lived on this street in 1940, and what happened to them? | 7–12 | 2 weeks | Annotated neighborhood map for the public library |
| 8 | Oral history archive | How did people here experience a decade the textbook summarizes in a paragraph? | 9–12 | 4 weeks | Transcribed, indexed interviews donated to a local archive |
| 9 | Textbook audit | What does our textbook leave out about this event, and does it matter? | 8–12 | 2 weeks | Supplement written for next year’s students |
| 10 | Disputed photograph | Can we establish when and where this image was taken, and who it served? | 7–10 | 1 week | Source analysis published as a museum-style wall label |
Why these are PBL: each one requires corroboration. A student cannot finish #7 without reconciling a census record against a city directory, and that reconciliation — not the map — is the learning. Projects 6 through 10 all build toward the same skill the local legend evidence lesson uses as a warm-up: separating what the record supports from what people repeat.
World history (11–15)
| # | Project | Driving question | Grades | Time | Public product |
|---|---|---|---|---|---|
| 11 | Trade route investigation | What moved along this route besides goods, and which movement mattered most? | 6–10 | 2 weeks | Layered map with an argued caption, displayed in the hall |
| 12 | Revolution comparison | Why did two revolutions with similar grievances end so differently? | 9–12 | 3 weeks | Comparative essay defended in a seminar with outside guests |
| 13 | Translation problem | How much does a founding document change depending on who translates it? | 10–12 | 2 weeks | Side-by-side annotated edition for the school library |
| 14 | Famine or epidemic inquiry | Was this catastrophe natural, political, or both — and how would we know? | 9–12 | 3 weeks | Evidence-weighted briefing paper for a community panel |
| 15 | Artifact repatriation | Who should hold this object, and what principle decides? | 8–12 | 2 weeks | Position paper and recorded debate shared with a museum educator |
Why these are PBL: none of them resolve cleanly. Project 14 is the one I would hand a strong class, because the honest answer is almost always “both,” and getting a sixteen-year-old to argue for a weighted “both” with evidence attached is harder and more valuable than getting them to pick a side.
Geography and human systems (16–20)
| # | Project | Driving question | Grades | Time | Public product |
|---|---|---|---|---|---|
| 16 | Food access mapping | How far is a full grocery store from each part of our town, and for whom? | 7–12 | 2 weeks | Map and findings sent to a food bank or planning office |
| 17 | Redlining overlay | Do lines drawn eighty years ago still show up in our city today? | 9–12 | 3 weeks | Overlay analysis presented at a public meeting |
| 18 | Walkability survey | Which route to our school is the most dangerous, and what would fix it? | 6–10 | 2 weeks | Field-data report to the city engineer |
| 19 | Migration story map | Why did people come to or leave this county in the last fifty years? | 8–12 | 3 weeks | Digital story map with sourced interviews |
| 20 | Place-name origins | What do our road and building names reveal about who had power here? | 6–9 | 1–2 weeks | Researched name index for the local historical society |
Why these are PBL: students generate original data. Project 18 cannot be completed from a browser — somebody has to walk the route with a clipboard and count the crossings without a signal. That is the cheapest authentic fieldwork in the whole list and it consistently produces the findings administrators actually act on.
Economics and civic data (21–25)
| # | Project | Driving question | Grades | Time | Public product |
|---|---|---|---|---|---|
| 21 | Real cost of a first job | What does it cost to get to and keep a minimum-wage job in this town? | 9–12 | 2 weeks | Budget model and guide for graduating seniors |
| 22 | Local business case study | Why did this business close, and could anything have been done? | 10–12 | 3 weeks | Case study shared with a chamber of commerce |
| 23 | Tax dollar trace | Where does a dollar of local sales tax actually go? | 8–12 | 2 weeks | Explainer infographic with sourced figures, published online |
| 24 | Price history investigation | Has this everyday good gotten more or less affordable since our parents were our age? | 7–11 | 1–2 weeks | Data brief with an argued conclusion |
| 25 | Survey the school honestly | What do students here actually believe about a question adults keep guessing at? | 9–12 | 3 weeks | Methodologically documented survey report to staff |
Why these are PBL: project 25 is the one that teaches the most and goes wrong the most. Students discover that a badly worded question produces a useless answer, that response rates matter, and that they cannot claim what their sample will not support. Make them publish the limitations section. That section is the assignment.
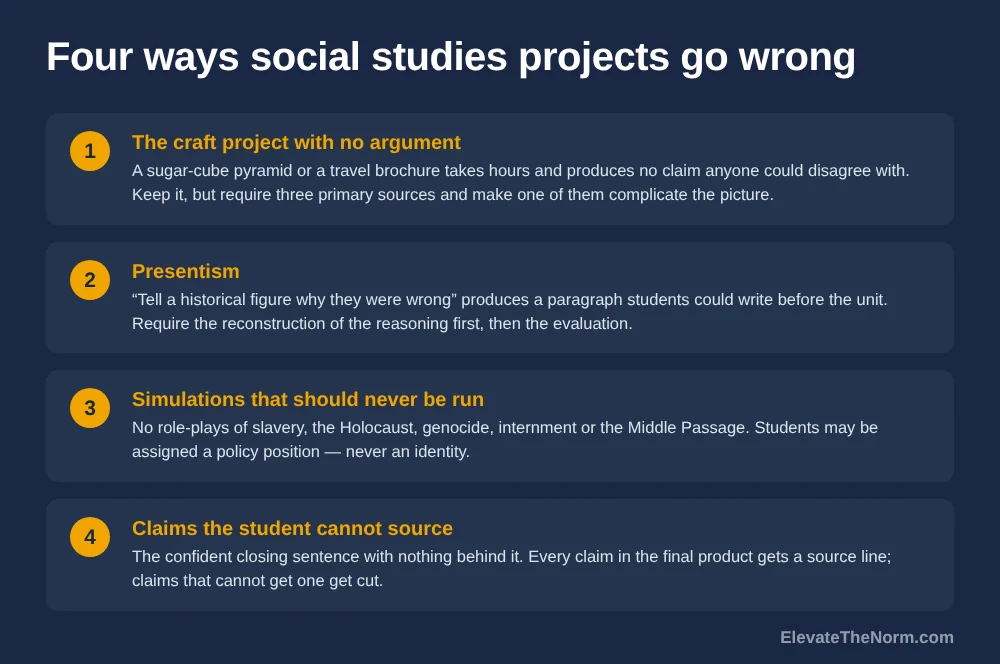
Four ways social studies projects go wrong
Every subject has its own failure modes. These four are ours, and three of them are things a well-meaning teacher does on purpose.
1. The craft project with no argument
Building a model of something is not studying it. A sugar-cube pyramid, a shoebox diorama, a hand-drawn travel brochure for ancient Rome — these take hours and produce no claim anybody could disagree with. The diagnostic question is simple: could a student get an A on this without having read a source? If yes, it is a craft, and the class time belongs somewhere else. The fix is usually small. Keep the travel brochure, but require that it cite three primary sources and that one of them complicate the picture.
2. Presentism
Judging the past purely by present standards feels like moral clarity and teaches almost nothing. “Write a letter telling a historical figure why they were wrong” produces a paragraph any student could write before the unit started. The harder and more useful task is explaining why a decision made sense to the people who made it, and then evaluating it. Students can do both. Asking for the second without the first skips the history.
This is not an argument for neutrality about atrocity. It is an argument that “they were monsters” is a conclusion, not an analysis, and that a student who can reconstruct the reasoning of someone they disagree with has learned something a student who cannot has not.
3. Simulations that should never be run
Do not simulate slavery, the Holocaust, genocide, internment, lynching, or the Middle Passage. Not as a role-play, not as an auction, not as a “walk in their shoes” exercise, not with desks arranged as a ship’s hold. These make the news every year, they humiliate the students who most identify with the victims, and no learning objective requires them. The United States Holocaust Memorial Museum’s guidelines for teaching the Holocaust state plainly that “simulating experiences from the Holocaust remains pedagogically unsound” — even when great care is taken to prepare a class — because students are “left with the impression that they now know what it was like to suffer.” The museum recommends primary sources and survivor testimony instead, and the reasoning generalizes to the rest of the list.
Politically loaded simulations are a smaller version of the same problem. A mock election is fine — students research platforms and argue. A simulation that assigns students to argue for a position about their own identity group is not. The rule I use: students may be assigned a policy position, never an identity.
4. Claims the student cannot source
The most common defect in a finished social studies project is a confident sentence with nothing behind it. It usually appears in the conclusion, where the student has run out of evidence and reaches for a summary that sounds like the end of a documentary. Catch it with a mechanical check: every claim in the final product gets a footnote, a bracket, or a source line. Claims that cannot get one get cut. Students hate this for about a week and then start writing more carefully, because they can see the cuts coming.
How to run your first one without blowing up the semester
Pick one unit, one project, one class period — not the whole course. The research above is a useful caution here, not just an endorsement: the strongest gains in the AP study came in the year teachers had the most external coaching. If a funded program with on-call coaches saw effects concentrate in year one, a teacher converting five preps alone over a summer should expect a rough first attempt. That is not a reason to skip it. It is a reason to make the first attempt small enough to survive.
- Choose the unit you are most tired of teaching. You know its content cold, which frees your attention for managing the process.
- Write the driving question before anything else. It should be answerable in more than one defensible way and not answerable by a single search. The driving question examples page has a revision formula for this.
- Name the audience out loud on day one. “This goes to the city engineer” changes the quality of student work more than any rubric line ever has.
- Build the checkpoints before students start. Three is usually right: sources approved, draft claim, revision after critique.
- Score the thinking, not the poster. A rubric that awards points for neatness will get you neatness. The PBL rubric template separates content knowledge from presentation so collaboration points cannot hide a weak argument.
- Keep the first one to two weeks. You will find the problems faster and you will still have a semester left to use what you learned.
What to do next
Pick one project from the list above that fits a unit you are teaching in the next two months. Write its driving question down. Then find the audience — the council office, the historical society, the librarian, the engineer — and send one email asking whether they would look at student work. That email is the whole difference between project based learning social studies and a unit that ends in a poster, and it takes about four minutes to write.
If the audience says no, run it anyway and send the work to next year’s class. An audience of the students who come after you is still an audience, and it is the one that never falls through.
Before you go: grab the free Social Studies Project Planner (PDF) — ElevateTheNorm.com branded, printable, no email required.
Teaching the other half of the schedule? The companion piece on 25 science projects for grades 6–12 follows the same structure and adds the lab-safety constraints a social studies project never has to plan around.
Frequently Asked Questions
What is project based learning in social studies?
It is an approach where students investigate an open question using the discipline’s own tools — primary sources, maps, data, competing interpretations — and produce something for a real audience. The question comes first and the content is learned in order to answer it. A project assigned after the unit is taught is a dessert project, not project based learning.
Does project based learning actually raise social studies test scores?
The strongest study says yes, in one course, under good conditions. A randomized trial of a project-based AP U.S. Government and AP Environmental Science curriculum across five urban districts found 44.8% of exam-takers scored a qualifying 3 or higher against 37.2% of the comparison group. The same researchers caution that the full-sample gap was smaller (35.1% vs 31.1%), that unadjusted estimates were near zero, that attrition exceeded What Works Clearinghouse thresholds, and that most of the effect came in the year teachers had external coaching. No equivalent trial exists for general middle or high school social studies.
How long should a social studies project take?
One to three weeks for a first attempt. Oral history and mapping projects that involve outside people or fieldwork run three to four. Resist the semester-long project until you have run two or three short ones — long projects hide their problems until it is too late to fix them.
How do I grade a project without group work hiding a weak student?
Separate the scores. Give an individual grade for content knowledge and evidence use, assessed from something each student produces alone, and a separate grade for collaboration and the group product. If one number covers both, a strong group will carry a student who learned nothing and the grade will not show it.
What if I have no budget, no technology and no field trips?
Most of the twenty-five projects here need a clipboard, a free online archive and a stamp. Census records, Chronicling America, state archives and National Register nomination forms are free. Walkability surveys and place-name research require no technology at all. The expensive part of project based learning is time, not money.
How do I keep a project from becoming political in a way that gets me in trouble?
Assign policy positions, never identities, and require every claim to carry a source. A student arguing for a budget tradeoff they did not choose is doing analysis. A student assigned to argue about their own identity group is being put in an unfair position. Tell families what the project is before it starts — a one-paragraph note heads off almost every complaint.
Can project based learning work if my students read below grade level?
Yes, and this is where social studies has an advantage: you control source difficulty independently of task difficulty. A seventh grader who reads at a fourth-grade level can still corroborate two sources, notice a disagreement and defend a claim — if the sources are excerpted, the vocabulary is pre-taught and the graphic organizer does the structural work. Lower the reading load, not the thinking.
What is the difference between the C3 Framework and project based learning?
The C3 Framework is a set of standards guidance from the National Council for the Social Studies, built around a four-dimension Inquiry Arc: developing questions, applying disciplinary tools, evaluating sources and evidence, and communicating conclusions and taking informed action. It is not a PBL program. But the arc and a well-built project are the same shape, which makes C3 a useful way to show an administrator which standards a project serves.
Sources
- Saavedra, A. R., Liu, Y., Haderlein, S. K., Rapaport, A., Garland, M., Hoepfner, D., Morgan, K. L., & Hu, A. (2021, February 22). Knowledge in Action Efficacy Study Over Two Years. USC Dornsife Center for Economic and Social Research. Read the limitations section — the authors are more careful about these results than most people citing them. https://files.eric.ed.gov/fulltext/ED616435.pdf
- Saavedra, A. R., & Rapaport, A. (2021, November). Project-based learning in AP classrooms: Lessons from research. Phi Delta Kappan. https://kappanonline.org/research-project-based-teaching-and-learning-saavedra-rapaport/
- National Council for the Social Studies. (2013). College, Career, and Civic Life (C3) Framework for Social Studies State Standards. https://www.socialstudies.org/standards/c3
- United States Holocaust Memorial Museum. Guidelines for Teaching the Holocaust. https://www.ushmm.org/teach/fundamentals/guidelines-for-teaching-the-holocaust
- College Board / Lucas Education Research. Project-Based Learning Boosts Student Achievement in AP Courses (research brief). https://apcentral.collegeboard.org/media/pdf/project-based-learning-boosts-student-achievement-in-ap-courses.pdf
- Library of Congress. Chronicling America: Historic American Newspapers. https://chroniclingamerica.loc.gov/
- National Park Service. National Register of Historic Places database and research guide. https://www.nps.gov/subjects/nationalregister/database-research.htm