The Elevate Blog banner: Real Classrooms. Practical Ideas. Higher Expectations. Three students climb a rocky ridge at sunrise, each pulling the next one up, toward a teacher reaching down to help.

Tag: teacher wellbeing

  • Special Education Teacher Burnout: The Three Loads That Are Not on the General List

    Special Education Teacher Burnout: The Three Loads That Are Not on the General List

    By Clay Shumate

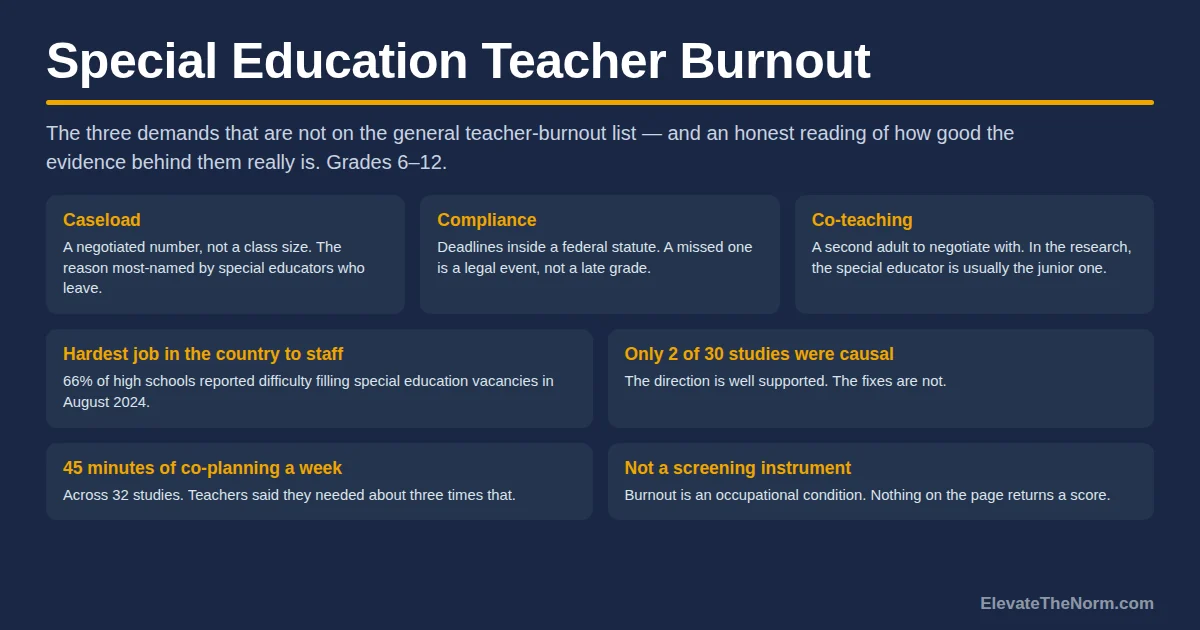
    Teacher burnout in special education runs on a set of demands that does not appear on the general list at all. A caseload is a negotiated number, not a class roster. The paperwork carries statutory deadlines. The second adult in the room is a relationship to manage rather than a resource to use. The research on all three is consistent in direction and thinner in quality than you would hope.

    This page does not restate the general list. The general demand ledger every teacher is working from already covers behavior, hours and out-of-pocket spending, and all of it applies here too. For the word itself, start with the three dimensions the word is actually made of. What follows is narrower: the demands belonging to this job specifically, in grades 6–12, and how good the evidence behind them really is.

    Key takeaways

    • Three demands separate this job from the general one: caseload as a negotiated number, compliance work with statutory deadlines, and co-teaching as a relationship rather than a resource. None gets smaller by managing your time better.
    • Caseload is the most-named reason in the retention research: 33 percent of leavers in one urban district’s exit survey, more than any other factor — though that is 99 people in one district, not a national rate.
    • Paperwork was third in the same survey, at 24 percent, and lands differently because a missed deadline is a legal event rather than a late grade. The system behind it is large and mostly never touches individual teachers: 29,490 due process complaints filed nationally in 2021–22, 2,645 fully adjudicated.
    • In the co-teaching research the special educator is repeatedly observed in a subordinate role, most of all at secondary level. Across 32 studies, teachers reported roughly 45 minutes a week of joint planning and said they needed about three times that.
    • Special education is the hardest area in the country to staff: in August 2024, 66 percent of high schools reported difficulty filling it, and only 77 percent of those vacancies went to a fully certified teacher.
    • The evidence is directionally consistent and methodologically weak — of 30 studies in the major review, only two used designs supporting causal claims. The familiar “75 percent leave within five years” figure is one state’s data from 1987 to 2001, not a current rate.
    • None of these numbers is a statement about you, and none is a diagnosis. Burnout is an occupational condition; nothing here is a screening instrument and nothing returns a score.
    Free download

    The Special Education Workload Audit

    Two printable pages. A write-in grid for the four things on this page — caseload and where the number came from, compliance events counted by week, co-planning scheduled versus actual, and unfilled positions — plus how to read the four answers together and who to take them to. Counts and dates only, never a student’s name. It is not a screening instrument and it returns no score. Free. No email address required. Designed for grades 6–12.

    Download the free PDF

    What makes special education a different burnout problem?

    Three demands a general education teacher never meets, none of which you control the shape of. A caseload is set by somebody else, a compliance calendar by federal statute, a co-teaching partnership by a master schedule you did not build. Time-management advice is aimed at demands whose shape you can change, which is why it does not land here — and being told to work smarter about something you do not control is a reliable way to feel worse about it.
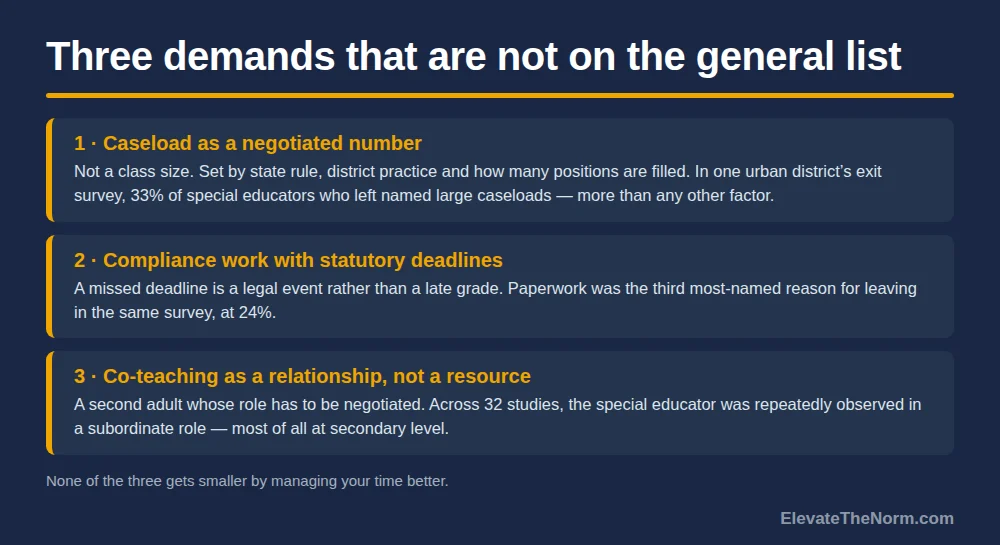
    Graphic listing three demands specific to special education: caseload as a negotiated number with 33 percent of leavers in one urban district naming it, compliance work with statutory deadlines with paperwork third at 24 percent, and co-teaching as a relationship with the special educator repeatedly observed in a subordinate role across 32 studies.
    The three demands that belong to this job and not to the general list.

    One thing to settle before the numbers start. Special educators report heavier loads and leave at higher rates, and it is easy to read that as a statement about the people who do the job. It is not. Every figure below is an average across thousands of teachers in very differently resourced buildings, and an average says nothing about any individual in it. Reading it as a verdict on yourself is statistically wrong, and it is the self-blame that makes a hard year harder.

    How many students is a special education caseload?

    Nobody can tell you, and that is the problem. A caseload is not a class size. It is a number produced by state rule, district practice, how many positions are filled, and what got decided in a meeting in July. Two teachers with the same title in the same state can be carrying very different loads.

    It is also what special educators name first. In a survey of teachers who left or moved out of one large urban district, 33 percent named large caseloads as an important reason — more than any other single factor. A teacher quoted in the same research put it plainly: “I currently see well over 75 students a day with little support.”

    Label that number before you carry it anywhere. It comes from 99 special educators, one district, three years. It is not national, and it does not tell you what a reasonable caseload is — no study does. It tells you what people say on the way out, and they have been saying it for a long time.

    The useful consequence: because a caseload is negotiated rather than given, it is one of the few demands here that somebody with a title can change in a scheduling meeting. That is not easy, but the conversation has a right address.

    Why does special education paperwork land differently?

    Because a missed deadline is a legal event rather than a late grade. Every teacher has paperwork. Very little of it sits inside a federal statute with a dispute-resolution process attached to the far end.

    Paperwork was third in that same district survey, at 24 percent. One teacher described it in terms any teacher will recognise: the IEPs ate up much of the time previously spent on students. The complaint is not that the documents are pointless, but that the documents and the students compete for the same hours.

    The system behind those deadlines is genuinely large. In 2021–22, states and outlying areas reported 29,490 due process complaints filed nationally, 6,160 written state complaints and 10,806 requests for mediation — up from 17,118 due process filings a decade earlier, with the share still pending at year end rising from 12 percent to 43 percent.

    Two qualifications, because this is the kind of number used to frighten people. Most of that volume never reaches a hearing — 2,645 were fully adjudicated — and the overwhelming majority of special education teachers finish a career without being personally involved in any of it. The point is not that you are about to be sued. It is that the deadlines are not negotiable the way a grading deadline is, which makes the pressure attached to them rational rather than something to talk yourself out of.

    What does co-teaching do to the job?

    In the research it repeatedly turns the special educator into the junior adult in somebody else’s room, and it does this most at secondary level. That is not a complaint about colleagues; it is what falls out of a structure where one adult owns the content and the other is assigned to the students.
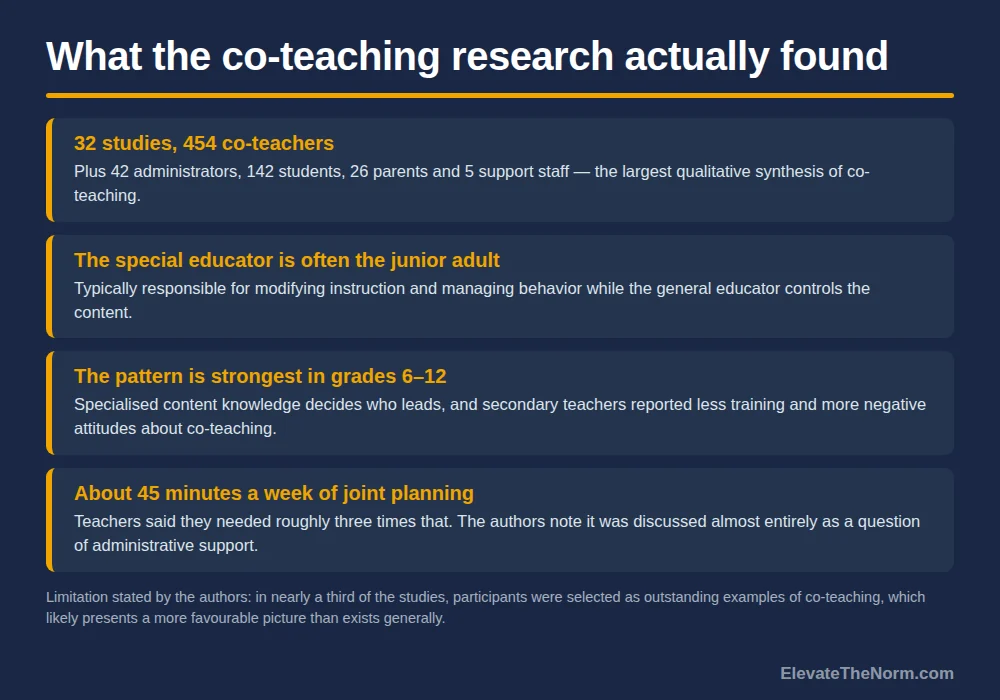
    Graphic summarising a synthesis of 32 co-teaching studies covering 454 co-teachers: the special educator is often the junior adult, the pattern is strongest in grades 6 to 12, and teachers reported about 45 minutes of joint planning a week against a stated need of roughly three times that.
    The co-teaching findings, with the authors’ own selection-bias limitation printed underneath them.

    The largest qualitative synthesis of co-teaching covered 32 studies, 454 co-teachers, 42 administrators, 142 students, 26 parents and 5 support staff. Its central finding: the special education teacher was often observed to play a subordinate role, typically responsible for modifying instruction and managing behavior while the general educator controlled the content. One special educator described the job as being an aide sometimes, an interpreter sometimes, and sometimes a teacher.

    The pattern sharpened at secondary level, where specialised content knowledge decides who leads and teachers reported less training and more negative attitudes about co-teaching than elementary counterparts. If you teach grades 6–12, that is your setting, not a footnote. The six recognised co-teaching structures divide that work very differently, and it is worth knowing what the research has actually measured for each one before a partnership is assigned to you.

    The pressure point is planning time. Teachers reported about 45 minutes a week of joint planning and said they needed close to three times that — and the authors note it was discussed almost entirely as a question of administrative support. That is the right framing, because planning time is a scheduling decision somebody signs off on, not a personal organisational failing.

    This is the one item on the page that genuinely responds to coaching. The subordinate pattern is produced by defaults — who stands where, whose name is on the gradebook, who the class looks at when directions are given — and an explicit division of roles, said out loud in front of students in the first week, changes what the room assumes for the year. If you are the general education teacher in that room, most of that fix is yours. Though a coaching cycle offered instead of staffing relief will be read as exactly what it is.

    Does the staffing shortage make all three worse?

    Yes, and it is the mechanism connecting them. Every unfilled special education position is a caseload that gets distributed, a compliance calendar absorbed, and a co-teaching assignment covered by whoever is available.

    The federal survey data is unambiguous about where the shortage bites. In a national panel of 1,392 public schools surveyed in August 2024, special education was the hardest teaching area in the country to staff: 66 percent of high schools and 74 percent of middle and combined schools reported difficulty filling those vacancies, and only 77 percent of the ones filled went to a fully certified teacher — eleventh of thirteen subject areas, against 89 percent for social studies.

    Read that last figure the right way. It is no judgement on people hired under emergency credentials, who are usually doing a hard job with less preparation than they deserved. It is a statement about what the building asks of everyone else, because an under-prepared colleague needs support that comes out of somebody’s week — usually the experienced special educator already carrying the largest caseload. A first-year special educator is short of both at once: short of the stock every new teacher lacks, and short of specialised knowledge the role needs on day one.

    What the data does not tell us is where inside a district those gaps land. The major review notes that few studies examined school poverty or student demographics at all. It is reasonable to suspect the shortfall concentrates in the schools least able to absorb it — but that has not been established, and a district that wants to know should look at its own vacancy and caseload numbers by school rather than assume either way.

    How good is the evidence behind any of this?

    Consistent in direction, weak in design, and worth knowing before you quote it at anybody. This literature has a myth problem, and a number that falls apart under scrutiny costs more than it gains.

    The major review of special educator attrition covers 30 studies from 2002 to 2017, and its accounting of itself is blunt. Only two of the 30 used methods permitting causal inference. Only 13 examined teachers actually leaving; the rest measured intent to leave or administrator perceptions, which are related but not the same. Mentoring, which teachers called valuable in the qualitative studies, showed insignificant direct effects on retention in the quantitative ones.

    The most recent burnout synthesis, covering 29 studies from 2013 to 2023, describes its own base as predominantly cross-sectional analyses of convenience samples — a snapshot of whoever responded, not a study over time.

    The co-teaching synthesis carries a limitation its authors state outright: in nearly a third of the studies, participants were selected as outstanding examples of co-teaching, which they say likely presents a more favourable picture than exists generally. That cuts in an unusual direction — it suggests the real picture is worse, not better — and that is a reason to hold the finding loosely, not a licence to assume the worse version.

    The number to stop repeating. “Seventy-five percent of special educators leave within five years” is a real finding — Illinois administrative data on teachers who entered between 1987 and 2001, 42 percent leaving teaching and 34 percent moving schools. One state, and a cohort that started work before most teachers now in classrooms were born. It is not a current national rate. The nearest national figure in the same review is older than it sounds too: 17.1 percent of special educators left their schools in 2012–13.

    And one finding that cuts against the simple story. A study of novice teachers in their first three years found, as expected, that special educators rated their workloads significantly less manageable than general educators did, and that workload manageability predicted emotional exhaustion, which predicted whether they meant to keep teaching. But the effects were stronger for the novice general educators. One reading is that special educators arrive expecting an unmanageable workload and are less shaken when they get one, which is not comforting. Another is that the measure misses what is heavy about this job. That study sampled elementary and middle school novices in two states, so it is not a high school result either.

    The honest summary: the direction is well supported and the fixes are not. Special educators consistently report heavier, less manageable workloads, name caseload and paperwork first when they leave, and are harder to replace than anyone in the building. What almost nothing here establishes is that any particular intervention fixes it.

    What can you actually check, and who do you take it to?

    Four things, all facts about the job rather than judgements about you. The point is to turn a feeling of being underwater into four numbers somebody with a title can act on. Short on time, which is the whole premise? Do items one and three only — five minutes, and the pair most likely to produce a change.
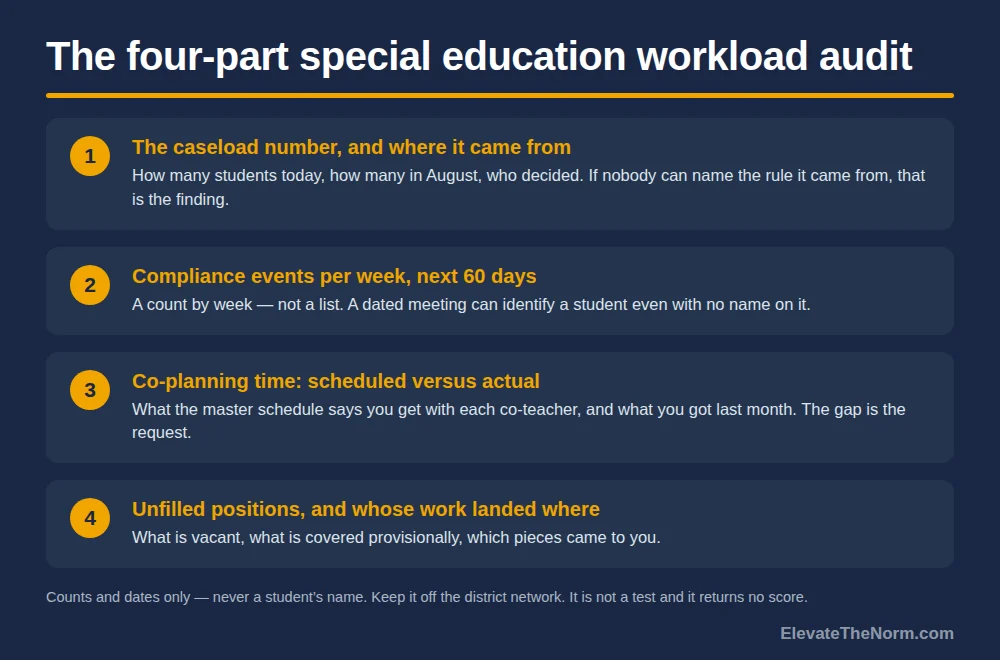
    Graphic showing a four-part workload audit: the caseload number and where it came from, compliance events counted per week for the next 60 days, co-planning time scheduled versus actual, and unfilled positions with whose work landed where.
    Four facts about the job. Counts and dates only, never a student’s name.
    1. The caseload number, and where it came from. How many students today, how many in August, who decided. If nobody in the building can name the rule it came from, that is itself the finding.
    2. Compliance events per week for the next 60 days. A count by week — meetings, evaluations, reviews. Not to panic about; to see whether the load is spread or stacked into two weeks that were always going to break.
    3. Co-planning time, scheduled versus actual. What the master schedule says you get with each co-teacher, and what you got last month. The gap is the request.
    4. Unfilled positions, and whose work landed where. What is vacant, what is covered provisionally, which pieces came to you.

    Three rules for keeping it. Write counts and dates, never names or initials — item two can identify a student with no name on it at all, because a dated meeting is traceable, which is why it is a count per week rather than a list. Keep it somewhere that is yours; a district device is not a private place to write that you are not coping. And keep it separate from compliance itself: this is a record of workload, not a log of deadlines you expect to be missed. If you believe a legal deadline is about to be blown, that goes to your coordinator today, on its own, in writing.

    It goes to the special education coordinator or department chair first, then whoever builds the master schedule. Open it as a question rather than a case — “here is what I am carrying, can we look at whether this is the intended distribution” lands differently from a document handed over in silence. Ask for the criterion rather than the favour: the conditions worth asking to have changed work better when the rule for who qualifies is written down first. A load lightened by private arrangement creates a fairness problem down the hall.

    If you are the only special educator in your building — common in small secondary schools — there is no department to take this to. The chain then runs to the district’s special education director, and sideways to a counterpart at another school or your state’s technical assistance center. Do not skip the step because the usual person does not exist.

    One thing this sheet is not. It is not a test, it produces no score, and it cannot tell you whether you are burned out. There is no validated cutoff that turns numbers into a finding about a person. If what you are carrying has stopped being about the job — if it follows you home, into the weekend, into how you feel about yourself — that is a conversation with your doctor or a counsellor, not with a worksheet. A short weekly record you can actually keep beats any one-off audit, because it shows a direction instead of a verdict.

    Are the students the reason?

    No. This needs saying directly, because “special education is exhausting” slides easily into “these students are exhausting,” and that is both untrue and corrosive.

    A caseload is a staffing decision. A compliance calendar is a federal statute. An unfilled position is a labour market. A co-teaching structure is a master schedule. Every load on this page came from an adult decision, and a student with an IEP is who those decisions exist to serve. Where the research finds this job heavy, it is heavy because of how it was resourced.

    And if you have an IEP and you have noticed your teacher is stretched: none of it is yours to carry. The services on your plan are yours by law regardless of how the building is staffed, asking for them is not making trouble, and a staffing shortage is never a reason to ask for less than you are owed.

    This matters practically as well as decently. A teacher who quietly concludes the students are the problem starts lowering the bar, and that is the one response that makes everything worse for everyone. Holding the bar where it belongs while the supports do their job is the whole design.

    What to do next

    Fill in the audit this week, or just items one and three. Most of it is already in your email and the master schedule. Then take the two biggest gaps to the person who can change them, in writing, as a question about the criterion rather than about you.

    If the answer is no, you have still done something useful: a written record of a load and a dated request is what makes a pattern visible when somebody finally asks why the position turned over again. And if the honest answer is that this job cannot be made survivable where you are, that is a real answer, not a failure of nerve. Nobody gets credit for absorbing a staffing shortfall until it breaks them.

    Want the audit as a printable? Download The Special Education Workload Audit (2 pages, free, no email required) and fill in items one and three before your next scheduling conversation.

    Frequently asked questions

    What causes burnout in special education teachers specifically?

    Three demands that do not appear on the general teacher-burnout list. Caseload is a negotiated number rather than a class size, set by state rule, district practice and how many positions are filled — and in one urban district’s exit survey, 33 percent of special educators who left named large caseloads as an important reason, more than any other factor. Paperwork was third in the same survey at 24 percent, and it lands differently because the deadlines sit inside a federal statute rather than a gradebook. And co-teaching is a relationship to negotiate rather than a resource to use: across 32 qualitative studies the special educator was repeatedly observed in a subordinate role, most of all at secondary level. The general demands — behavior, hours, out-of-pocket spending — apply on top of all three.

    Is special education teacher burnout worse than general education teacher burnout?

    The direction of the evidence says special educators carry more, but the size of the gap is not settled. Special educators report heavier and less manageable workloads, name caseload and paperwork first when they leave, and are the hardest group in the country to replace. Against that, a study of novice teachers in their first three years found that although special educators rated their workloads significantly less manageable, the link running from workload manageability through emotional exhaustion to career intentions was actually stronger for the novice general educators. That study sampled elementary and middle school novices in two states, so it is not a high school result. The honest answer is that the job is differently loaded, and that anyone claiming a precise multiplier is going beyond what the research supports.

    Do 75 percent of special education teachers really quit within five years?

    Not as a current national figure. That number is real but it comes from Illinois administrative data on teachers who entered the profession between 1987 and 2001 — 42 percent leaving teaching and 34 percent moving schools. One state, and a cohort that started work before most teachers now in classrooms were born. It should not be quoted as today’s rate. The nearest national figure in the same literature review is also older than it sounds: 17.1 percent of special educators left their schools in 2012–13. Leaving is also not the same thing as burning out; people move for pay, family, geography and promotion.

    How big should a special education caseload be?

    No study answers that, and no national standard sets it. Caseload limits, where they exist at all, are set by state rule and vary widely, and the actual number a teacher carries also depends on district practice and how many positions are currently filled. What the research establishes is that caseload is what special educators name first when they leave, not what a defensible ceiling would be. The practical move is not to argue for a number but to ask what rule your building used to arrive at yours — if nobody can name one, that is itself worth putting in writing.

    What can a principal or district actually change about this?

    Three things, all of them scheduling or staffing decisions rather than encouragement. Co-planning time is the clearest: in the co-teaching research teachers reported about 45 minutes a week and said they needed roughly three times that, and the authors note it was discussed almost entirely as a question of administrative support. Caseload distribution is the second, and it is negotiated in a scheduling meeting. The third is how the work of unfilled or provisionally covered positions gets allocated, which currently tends to land on whoever is most experienced. Whatever is changed, write the criterion for who qualifies before applying it to anybody — a load lightened by private arrangement creates a fairness problem down the hall.

    I am a parent and my child’s special education teacher seems overwhelmed. What should I do?

    Ask the school about staffing rather than about the teacher. The useful questions are whether the position is fully staffed, what the caseload is, and whether the services on your child’s plan are being delivered as written — those are answerable and they are the school’s responsibility. Your child’s entitlement to the services on the plan does not depend on how the building is staffed, so raising a gap in delivery is entirely reasonable. What is worth avoiding is treating an individual teacher’s apparent state as the subject, both because a teacher’s wellbeing is not a matter for the class group chat and because the loads described on this page are almost entirely produced by decisions made above the classroom.

    I am a student with an IEP. Is my teacher stressed because of me?

    No. A caseload is a staffing decision, a compliance calendar is a federal statute, an unfilled position is a labour market and a co-teaching structure is a master schedule. Every load described on this page came from an adult decision, and none of it is yours to carry or to fix. The services on your plan are yours by law regardless of how your school is staffed, asking for them is not making trouble, and a staffing shortage is never a reason to ask for less than you are owed. If you are worried about a teacher, talk to a counselor about the class rather than about the person.

    Is there a test that tells you whether you have special education teacher burnout?

    No, and this site does not publish one. Burnout is an occupational condition rather than a clinical diagnosis, and the research instruments used to measure it lack a clinically validated cutoff, which means there is no threshold that turns a set of answers into a finding about an individual person. A checklist can tell you useful things about your job — how big the caseload is, how the compliance load is distributed, how much co-planning time you actually get — and that is what the audit on this page does. If what you are carrying has stopped being about the job, that is a conversation with your doctor or a counsellor, not with a worksheet.

    Sources

    • Billingsley, B., & Bettini, E. (2019). Special education teacher attrition and retention: A review of the literature. Review of Educational Research, 89(5), 697–744. A systematic review of 30 studies published between 2002 and 2017. Source of the 33 percent caseload and 24 percent paperwork figures (from Billingsley, 2007 — 99 special educators who left or moved from one large urban district over three years), the 17.1 percent national attrition figure for 2012–13 (Goldring, Taie & Riddles, 2014), and the “75 percent within five years” figure (DeAngelis & Pressley, 2011 — Illinois administrative data, 1987–2001). Limitations stated by the authors: only two of the 30 studies used methods permitting causal inference, only 13 examined teachers actually leaving rather than intent to leave, and few studies examined school poverty or student demographics. journals.sagepub.com
    • Brunsting, N. C., Morin, L. E., Gómez, L. R., Jones, B., Bettini, E., Cumming, M. M., Garwood, J. D., & Ruble, L. A. (2026). Burnout and occupational wellbeing of special education teachers: Recent research synthesized. Review of Educational Research. A synthesis of 29 studies published between 2013 and 2023, extending the 2014 Brunsting, Sreckovic & Lane synthesis. The authors describe the evidence base as predominantly cross-sectional analyses of convenience samples and call for longitudinal and intervention designs. journals.sagepub.com
    • Scruggs, T. E., Mastropieri, M. A., & McDuffie, K. A. (2007). Co-teaching in inclusive classrooms: A metasynthesis of qualitative research. Exceptional Children, 73(4), 392–416. 32 qualitative reports covering 454 co-teachers, 42 administrators, 142 students, 26 parents and 5 support personnel. Source of the subordinate-role finding, the secondary-level intensification, and the 45.5 minutes of weekly joint planning against a stated need of roughly three times that. Limitation stated by the authors: in nearly a third of the investigations participants were selected as outstanding examples of co-teaching, which they say likely presents a more favourable picture of co-teaching than exists in general. ncipp.education.ufl.edu (PDF)
    • Bettini, E., Jones, N., Brownell, M., Conroy, M., Park, Y., Leite, W., Crockett, J., & Benedict, A. (2017). Workload manageability among novice special and general educators: Relationships with emotional exhaustion and career intentions. Remedial and Special Education, 38(4), 246–256. Novice teachers in their first three years, drawn from the Michigan–Indiana Early Career Teacher Study. Special educators rated workload manageability significantly lower than general educators; workload manageability predicted emotional exhaustion, which mediated the relationship with intentions to keep teaching. Effects were stronger for novice general educators, and the sample was elementary and middle school teachers in two states — not a high school result. journals.sagepub.com
    • National Center for Education Statistics (2024). School Pulse Panel, hiring and vacancies collection. 1,392 participating public K–12 schools, surveyed 13–27 August 2024. Special education was the hardest teaching area to staff: 74 percent of elementary and of middle and combined schools and 66 percent of high schools reported difficulty filling those vacancies, and only 77 percent of filled special education vacancies went to a fully certified teacher — eleventh of thirteen subject areas, against 89 percent for social studies. ies.ed.gov
    • CADRE (Center for Appropriate Dispute Resolution in Special Education). IDEA dispute resolution data summary for U.S. and outlying areas. Data for the 2021–22 school year, reported by states under IDEA Section 618: 29,490 due process complaints filed, 2,645 fully adjudicated, 6,160 written state complaints filed and 10,806 mediation requests; due process filings rose from 17,118 in 2011–12, and the share still pending at year end rose from 12 percent to 43 percent over the same decade. A more recent summary covering 2023–24 exists but could not be opened from this session, so only the 2021–22 figures are used here. cadreworks.org (PDF)

    Every source above was opened and read for this article. Where a figure could not be confirmed in the original, it is not on this page.


    About Clay Shumate

    Clay Shumate is a certified secondary Social Studies teacher in the public schools of West Alabama, with seven years of classroom experience, a B.A. in History, and an M.Ed. in Secondary Education. He writes about project-based learning, student responsibility, respect, and practical ways to hold young people to a higher standard while giving them room to learn from mistakes.
  • How Teacher Burnout Affects Students: What Shows Up, and What Doesn’t

    How Teacher Burnout Affects Students: What Shows Up, and What Doesn’t

    By Clay Shumate

    Teacher burnout shows up in students’ experience of the classroom long before it shows up in their test scores. The largest review to date links it clearly to weaker emotional support, weaker classroom management and lower student motivation — and almost not at all to achievement. The larger measured cost to students is what happens after a teacher leaves.

    This page is about outcomes measured on students, and it is the one article in this series written mostly for administrators and families rather than for the teacher carrying the load. For the word itself, start with the definition and the three dimensions behind every number on this page; for what a principal or district can change, the conditions an administrator can actually change and the measured size of each one covers it and this page does not restate it. What follows is narrower: when a teacher is burned out, what actually happens to the kids in the room, and how strong that evidence really is.

    Key takeaways

    • The effect lands on the classroom experience, not the score. In a 2026 meta-analysis of 86 studies and 38,457 teachers, burnout correlated with weaker emotional support, classroom management and instructional support at r = −.13 to −.30.
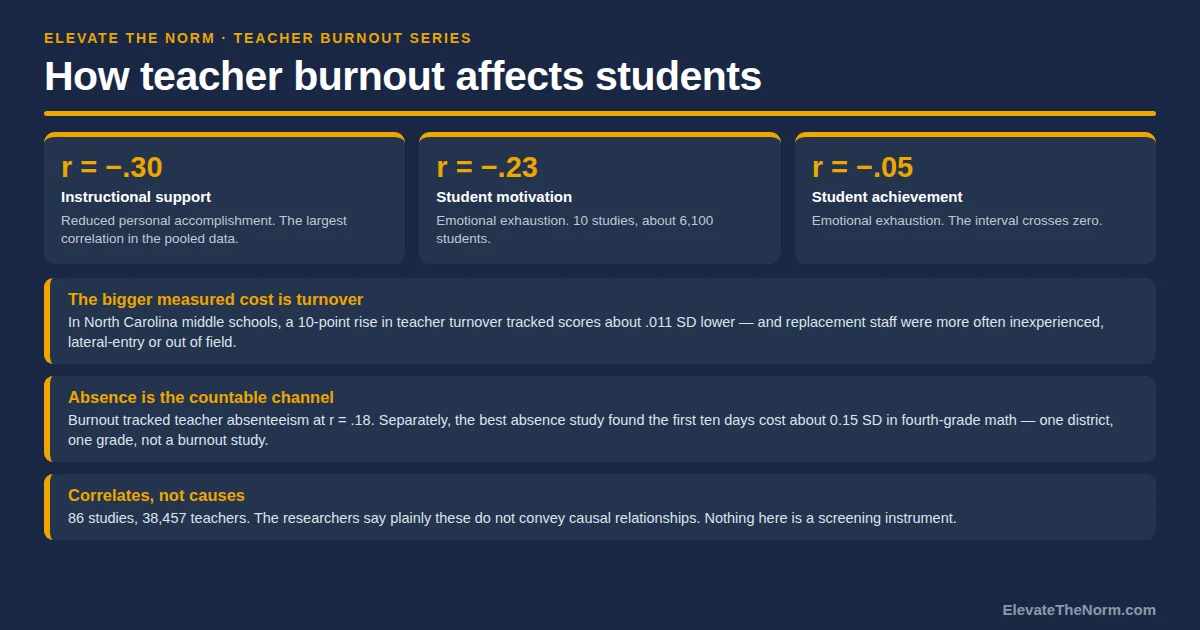
    • Student motivation is the clearest student-side link, at r = −.23 across ten samples and about 6,100 students. Achievement is the weakest link in the field: r = −.05, with a confidence interval that crosses zero.
    • There is little evidence linking teacher burnout to students’ depressive symptoms or emotional distress. The alarming version of this claim is not supported.
    • None of those pooled numbers says anything about an individual teacher. A correlation is a statement about tens of thousands of people at once.
    • The bigger measured student cost is turnover. In North Carolina middle schools a 10-point rise in turnover tracked about .013 standard deviations lower math scores, and replacement staff were more often inexperienced, lateral-entry or teaching out of field.
    • Those effects are largest in the highest-poverty and lowest-performing schools, which makes this an equity question and not only a staffing one.
    • Almost none of this is causal. These are correlates — signals about conditions, not proof that one thing produced the other.
    • Burnout is an occupational condition, not a diagnosis anyone gives from a web page. Nothing here is a screening instrument or a way to assess an individual teacher.
    Free download

    The Student-Side Continuity Check

    Two printable pages. A write-in grid for the four building-level conditions behind every finding on this page, plus how to read the four answers together and what to do before acting on them. It measures a building, not a person. It is not a screening instrument and it returns no score. Free. No email address required. Designed for grades 6–12.

    Download the free PDF

    How does teacher burnout affect students?

    Mostly through the quality of the interaction, not the quantity of the learning. When researchers pool the studies, the strongest and most consistent associations are with how the room runs and how supported students feel in it. The weakest association in the whole pile is the one people quote most: test scores.

    The best current summary is a 2026 meta-analysis in Review of Educational Research by Gyde Wartenberg, Karen Aldrup, Simon Grund and Uta Klusmann, pooling 86 studies and 90 independent samples covering 38,457 teachers. It reports burnout’s three dimensions separately, which matters, because they do not behave alike.

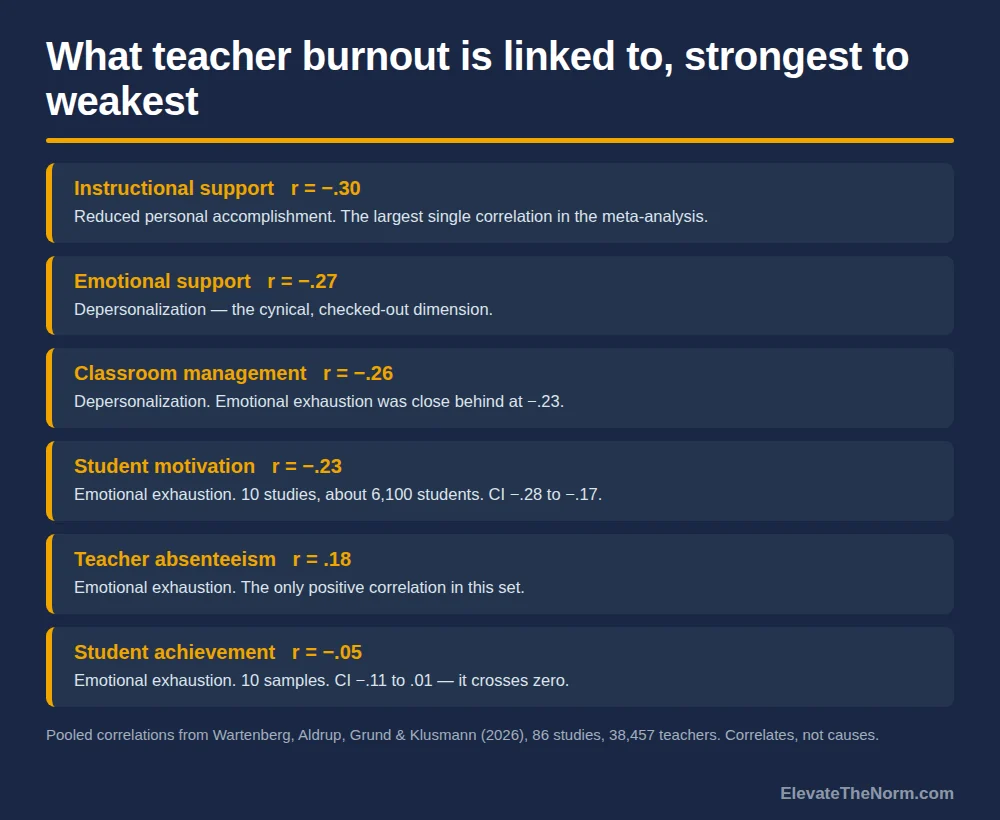
    Depersonalization — the cynical, checked-out dimension — is the one most tied to how students are treated. It correlated with lower emotional support at r = −.27 and with weaker instructional support at r = −.27. Emotional exhaustion tracked with classroom management at r = −.23. Reduced personal accomplishment tracked with instructional support at r = −.30, the largest single correlation in the set.

    Those are small to moderate correlations — a real signal, not a large one. A correlation of −.27 does not mean a burned-out teacher stops supporting students; it means the two move together across tens of thousands of people.

    One thing has to be said before anybody reads further, particularly any teacher who found this page while having a hard year. None of these numbers is about you. A pooled correlation across 38,457 people describes a tendency in a population. It cannot tell you anything about one classroom, and it is not a verdict on whether you are failing your students. Reading it as one is statistically wrong and it is also the exact self-blame that makes a hard year harder. What follows is an argument about how schools are staffed and scheduled, not evidence against any individual.

    Ranked list graphic of six pooled correlations between teacher burnout and outcomes: instructional support minus .30, emotional support minus .27, classroom management minus .26, student motivation minus .23, teacher absenteeism .18, and student achievement minus .05.
    The six pooled correlations in order of size. Student achievement is the weakest link in the set, not the strongest.

    Does teacher burnout lower students’ test scores?

    The evidence does not support it, and it is the single most repeated claim about teacher burnout and students. Emotional exhaustion and student achievement pooled to r = −.05 across ten independent samples, 95 percent confidence interval −.11 to .01. An interval that crosses zero means the data cannot rule out no relationship at all.

    The authors do not treat that as a surprise. They write that “individual student characteristics such as intelligence, prior knowledge, and conscientiousness…determine achievement to a large extent, thereby reducing the potential of teacher characteristics to influence student achievement.” Test scores are a noisy, slow-moving outcome with a lot of other things pushing on them.

    The earlier systematic review is a little more generous. Daniel Madigan and Lisa Kim, in the International Journal of Educational Research, went through 14 studies covering 5,311 teachers and 50,616 students — eight primary, six secondary. They found burnout associated with worse achievement “more often than not,” in four of seven studies, at small-to-medium effect sizes. Their verdict on the field is blunt: “It is almost cliché to bemoan the lack of longitudinal and rigorously designed studies.”

    So: four of seven studies found something, and the pooled estimate across ten samples is roughly nothing. Anyone telling you burned-out teachers demonstrably lower test scores is reporting half of that.

    What changes in the room that a student would actually notice?

    Autonomy, patience, and the sense that the teacher is present. This is where the secondary-specific evidence lives.

    Bo Shen and colleagues, in the British Journal of Educational Psychology, surveyed 1,302 high school students and their 33 physical education teachers across 20 schools in two demographically similar Midwestern districts, at the start and end of a semester. Teachers’ emotional exhaustion was negatively related to how much autonomy support students perceived. Depersonalization was inversely related to students’ autonomous motivation even after controlling for that perceived autonomy support — so the cynical dimension had a link to motivation running past the obvious channel.

    Two labels belong on that: physical education rather than a typical grades 6–12 academic classroom, and correlational over one semester. But it is a high school sample, which most of this literature is not, and the pattern matches the pooled numbers.

    What that looks like in practice is not dramatic. Fewer choices offered, because choices take setup. A shorter fuse on the fourth redirect. Feedback that gets thinner in March than it was in September. Students read all of that accurately, and they usually read it as being about them.

    One finding here a coach can genuinely use: the largest single correlation in the meta-analysis was between reduced personal accomplishment — the “none of this is working” dimension — and weaker instructional support. That dimension responds to evidence, because the belief underneath it is a factual claim about whether the work is landing, and claims like that can be checked. Making growth visible is a real intervention. It is also not a substitute for fixing a load that is genuinely too heavy, and a coaching cycle offered in place of staffing relief will be read as exactly what it is.

    Does it affect how students feel about school?

    Motivation, yes. Mental health, there is no good evidence for it.

    Motivation is the clearest student-reported finding in the meta-analysis: emotional exhaustion correlated with student motivation at r = −.23, 95 percent CI −.28 to −.17, across ten studies and about 6,108 students. That interval does not cross zero.

    The wellbeing claim is a different story, and it is worth saying out loud to any parent who has read a frightening headline. Madigan and Kim looked and reported “little evidence to suggest an association between teacher burnout and students’ depressive symptoms, emotional distress, or attempted suicide.” One study found exhaustion linked to slightly lower school satisfaction, a small effect. That is the whole finding. A teacher having a hard year is not measurably damaging children’s mental health, and claiming otherwise borrows a weight the research does not carry.

    Which is also why a teacher’s apparent state is not a subject for the class group chat. Speculating in public about whether a particular adult is struggling is a guess about somebody’s health, it travels faster than any correction, and it does nothing about the conditions that produced the problem.

    What happens to students when a teacher leaves?

    This is the largest measured student-side cost in the literature, and it has the strongest designs behind it. Burnout is not the only reason teachers leave, so treat it as a downstream consequence rather than a direct burnout effect.

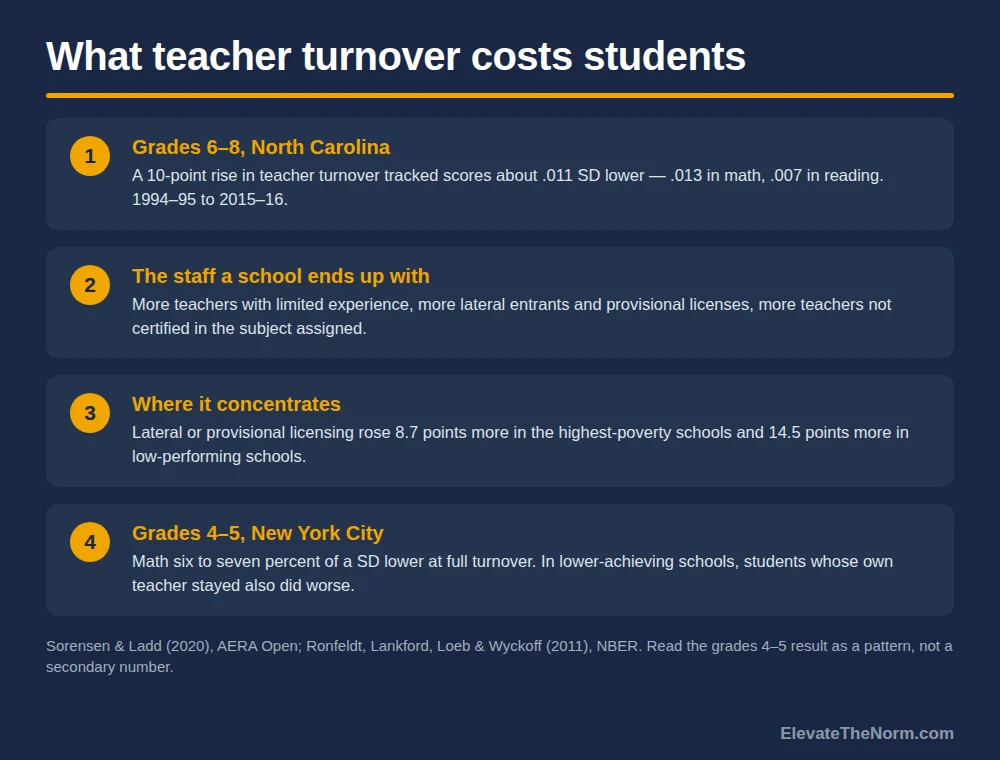
    The most relevant study for grades 6–12 is Lucy Sorensen and Helen Ladd’s analysis in AERA Open, covering North Carolina middle schools — grades 6 through 8 — from 1994–95 through 2015–16. A 10 percentage point rise in teacher turnover was associated with scores about .011 standard deviations lower overall: .013 in math, .007 in reading. Small per unit, and they accumulate in buildings where turnover is chronic.

    Be honest about how small that is. A hundredth of a standard deviation is close to nothing for any individual child, and citing this study as proof that turnover is devastating students oversells it. The reason to act is not the effect size. It is the second finding, about what the school is left holding.

    Turnover has “marked, and lasting, negative consequences for the quality of the instructional staff.” Schools with more churn ended up with higher proportions of teachers with limited experience, more lateral entrants and provisional licenses, and more teachers not certified in the subject they were assigned. And the effect concentrated: the increase in lateral or provisionally licensed staff was 8.7 percentage points larger in the highest-poverty schools and 14.5 points larger in low-performing schools.

    An earlier New York City study points the same way. Across roughly 625,000 observations of fourth and fifth graders, Matthew Ronfeldt and colleagues found math scores six to seven percent of a standard deviation lower in a grade-year with complete turnover than in one with none. The finding that matters most: the damage was not limited to students who got a new teacher. In lower-achieving schools, students whose own teacher stayed also did significantly worse when turnover around them was high; in higher-achieving schools there was no such effect. That is grades 4 and 5, so read the pattern, not the number.

    Four-card graphic on teacher turnover and student achievement: the North Carolina grades 6 to 8 finding, the change in staff composition, where the effects concentrate by school poverty, and the New York City grades 4 to 5 result.
    The turnover evidence, with each study labelled by its grade range. The grades 4–5 result is a pattern, not a secondary number.

    Do teacher absences cost students learning?

    The best study on this found a real effect — and it is a fourth-grade result in one district. Raegen Miller, Richard Murnane and John Willett examined 6,166 students and 231 teachers across 73 schools in a large urban district over two school years. The first ten days of teacher absence were associated with about 0.15 of a standard deviation lower fourth-grade math achievement.

    That is the biggest number on this page, which is exactly why the caveats travel with it. One district, one grade, mathematics only — English Language Arts effects were smaller and inconsistent — leaning on instrumental variables with 16 to 24 percent of prior achievement values imputed. It is also not a burnout study. People are absent for many reasons unrelated to the job.

    It matters here for one reason: the meta-analysis found emotional exhaustion associated with absenteeism at r = .18. If exhaustion raises absence a little and absence costs learning a lot, coverage is one of the few places where the student cost of a depleted staff becomes visible and countable. It sits alongside the student-attendance side of the same problem, tracked closely for the same reason.

    One wrong turn is worth naming before somebody takes it. A school that answers a coverage number by leaning on staff not to take sick days has reduced nothing except its own visibility into the problem. Absence is a symptom of a staffing plan with no slack. Suppressing it leaves the plan as it was and adds sick adults to a building full of teenagers.

    How much of this is actually cause and effect?

    Very little of it, and the researchers say so first. This section exists because the honest version of this topic is weaker than the version that circulates.

    The meta-analysis authors are explicit that they “refer to teacher absenteeism, teacher–student interactions, and student motivation and achievement as correlates” and that these “do not convey causal relationships.” Of 31 longitudinal studies they identified, only 11 reported longitudinal correlations between earlier burnout and later outcomes, and that evidence was mixed — it supported the motivation finding better than the achievement finding.

    There is also a measurement problem that cuts against the strongest numbers. Correlations were stronger when the classroom-quality rating came from the teacher’s own self-report than from an outside observer. A tired teacher rating both their exhaustion and their own classroom management harshly produces a correlation without anything happening in the room. The external-observer estimates were weaker.

    And the arrow may run backwards. A class that is genuinely hard to teach can exhaust a teacher, rather than an exhausted teacher making the class hard. Nothing in a cross-sectional correlation can separate those, and both are probably true at once. The practical reading is the uncomfortable one: you should take these findings seriously enough to fix conditions, and not seriously enough to blame a person.

    What can a school check, without turning it into a file on a teacher?

    Check the conditions, not the people. Everything above points at building-level facts that are already recorded somewhere. None of it requires assessing an individual teacher’s state of mind, and none of it should ever be written down next to a teacher’s name.

    Four things are countable, and all four sit with whoever builds the schedule and the budget rather than with the person in the classroom.

    • Continuity. How many sections changed teachers mid-year, and how many positions turned over between June and August? Sorensen and Ladd’s finding is about the staff a school ends up with, so watch who arrived, not only who left. Mostly central office — hiring and retention.
    • Assignment fit. How many teachers are teaching outside the field they are certified in? That was one of the specific quality losses the North Carolina data documented, and it is already in the staffing file. Shared — and often a supply problem rather than a choice, which makes it a diagnostic rather than an accusation.
    • Coverage load. How often is a class covered by someone other than its teacher, and how is that spread across the building? Absence is not a behavior problem to manage down. High coverage says the staffing plan has no slack in it. Building level — a principal can usually see and change this one.
    • What students say about the room. Not about the teacher — about the room. Do they get choices in how they show what they know? Do they know what happens next? Climate surveys already ask this, and answers aggregate by course or grade without naming anybody. Building level.

    Three lines stay attached to that list. It measures a building, not a person, so never write a teacher’s name on it and never let it feed an evaluation — a name in a box turns a diagnostic into an informal personnel record with none of the protections a real evaluation carries. It is not a burnout screen: no validated cutoff turns any of these numbers into a finding about an individual, and treating a bad number as evidence that a particular teacher is burned out is unsupported and unfair. And if you act on what you find, write the rule for who qualifies before you apply it to anyone, because a private fix for one teacher creates a fairness problem for everyone else in the hallway.

    Numbered list graphic of four building-level conditions a school can check: continuity, assignment fit, coverage load, and what students say about the room, with a highlighted note that it measures a building rather than a person and is not a burnout screen.
    Four conditions that are already somewhere in a school’s data. None of them assesses an individual teacher.

    Is student behavior why teachers burn out?

    No. This series has answered that four times now and the answer does not change. Managing behavior is real work and the most commonly named stressor in the national survey data, but a class of teenagers behaving like teenagers is the job, not a malfunction. What turns ordinary classroom demand into burnout is how much of it one person absorbs without help, and that is a scheduling and staffing decision. the demand side, and how good the evidence behind each piece of it is goes through that in detail.

    The students who need the most redirecting usually have reasons nobody in the room has been told about, and handling the behavior itself without spending the relationship is a separate skill from carrying an unreasonable load. The two problems get confused constantly, and only one of them is fixable inside the classroom.

    If you are a student reading this because you are worried about a teacher: you did not cause it, and it is not your job to fix it. Being decent to them is a good thing to do and it is not the solution to a workload problem.

    What to do next

    If you are an administrator, pull those four numbers for one grade level and look at them together. They are already in your data. If any of them is bad, the fix is a schedule or budget decision, not a conversation about resilience — which decisions those actually are is the companion page.

    If you are a parent, the useful question at a conference is not whether a teacher seems tired. It is whether the course has had the same teacher all year, whether it is taught by someone certified in the subject, and how often it is covered by someone else. Those are answerable, and they are about the school’s plan rather than a person.

    If you are a teacher and this page is why you are here: the research says the cost of an under-resourced job lands on your relationships with students before it lands on their scores. what getting back on your feet actually involves is the recovery side. Nobody gets credit for absorbing a staffing problem quietly, and students do not benefit from it either.

    Want the four conditions as a printable? Download The Student-Side Continuity Check (2 pages, free, no email required) and fill it in for one grade level before your next leadership meeting.

    Frequently asked questions

    How does teacher burnout affect students?

    Mostly through the quality of the classroom interaction rather than through achievement. In a 2026 meta-analysis of 86 studies covering 38,457 teachers, burnout correlated with weaker instructional support (r = -.30 for the reduced-personal-accomplishment dimension), weaker emotional support and classroom management (around r = -.27), and lower student motivation (r = -.23). Its correlation with student achievement was r = -.05, with a confidence interval that crosses zero. All of these are correlates. The researchers state plainly that they do not convey causal relationships.

    Does teacher burnout lower test scores?

    The pooled evidence does not support that claim, even though it is the version most often repeated. Across ten independent samples, emotional exhaustion and student achievement came out at r = -.05, 95 percent CI -.11 to .01. An earlier systematic review of 14 studies found burnout linked to worse achievement in four of seven studies at small-to-medium effect sizes, so the literature is split. The honest summary is that the achievement link is the weakest one in the field, not the strongest.

    Should I move my child out of a burned-out teacher’s class?

    The research gives you very little support for that decision. The measured achievement effect is close to zero, and a mid-year schedule change has real costs of its own: a new teacher who does not know your child, a break in the relationships that make a class work, and a knock-on effect for whoever gets moved to make room. The more useful questions are about the course rather than the person: has this section had the same teacher all year, is it taught by someone certified in the subject, and how often is it covered by somebody else. If your child is telling you something specific about how the class runs, that is worth raising directly with the school. A guess about an adult’s mental state is not.

    I think my teacher has checked out. Is there anything I can do?

    Describe the class, not the person. “I don’t know what we’re supposed to be doing most days” is something a counselor, a department chair or another trusted adult can act on. “My teacher is burned out” is a diagnosis you are not in a position to make, and it will usually land as a complaint about someone rather than a description of a problem. Be clear that you are trying to learn, not trying to get anyone in trouble. And be straight with yourself about the limit here: an adult’s workload is not a student’s responsibility to manage, and nothing about a teacher having a hard year is your fault or your job to fix.

    Is student behavior the reason teachers burn out?

    No. Managing behavior is real work and teachers name it more often than anything else when national surveys ask what stresses them, but a room of teenagers behaving like teenagers is the job rather than a malfunction. What turns ordinary classroom demand into burnout is how much of it one person is expected to absorb without support, and that is a scheduling, staffing and budget decision made by adults with titles. Students are not the cause.

    Does a teacher leaving mid-year hurt students?

    The evidence on turnover is the strongest student-side evidence in this whole area, and the effects are real but small per unit. In North Carolina middle schools, a 10 percentage point rise in teacher turnover was associated with test scores about .011 standard deviations lower. The more consequential finding is about staff composition: schools with more churn ended up with more inexperienced teachers, more lateral entrants and provisional licenses, and more teachers assigned outside their certification, and those shifts concentrated in the highest-poverty and lowest-performing schools.

    How can a school tell whether burnout is affecting its students?

    By checking conditions rather than people. Four things are already in most schools’ data: how many sections changed teachers mid-year and how many positions turned over in the summer; how many teachers are assigned outside their certified field; how often classes are covered by someone other than their teacher and how that is distributed; and what students already say on climate surveys about choice and clarity in their courses. Read those four together for one grade level. None of them requires assessing an individual teacher, and none of them should ever be recorded next to a teacher’s name.

    Is there a way to screen teachers for burnout?

    Not one that belongs in a school’s hands, and this site does not publish one. The research instruments used in these studies have no clinically validated cutoff, which means there is no defensible threshold at which a number becomes a finding about a person. A school using an informal checklist to decide that a particular teacher is burned out is making an unsupported judgment and creating a quasi-personnel record at the same time. Burnout is an occupational condition, not a diagnosis anyone should be handing out. If a teacher is struggling, the next step is a conversation with a person, and for their own health, with their doctor or a counselor.

    Sources

    • Wartenberg, G., Aldrup, K., Grund, S., & Klusmann, U. (2026). How strongly is teachers’ burnout related to teacher absenteeism, teacher–student interactions, and student motivation and achievement: A meta-analysis and systematic review. Review of Educational Research. 86 studies, 90 independent samples, 38,457 teachers. Pooled correlations used on this page: instructional support −.30 (reduced personal accomplishment), emotional support and instructional support −.27 (depersonalization), classroom management −.26 (depersonalization) and −.23 (emotional exhaustion), student motivation −.23 (95% CI −.28 to −.17, 10 studies, ~6,108 students), absenteeism .18, student achievement −.05 (95% CI −.11 to .01, 10 samples). Limitations stated by the authors: these are correlates and “do not convey causal relationships”; only 11 of 31 longitudinal studies reported longitudinal correlations; self-reported classroom quality produced stronger correlations than external ratings. Egger’s tests indicated no evidence of publication bias. journals.sagepub.com
    • Madigan, D. J., & Kim, L. E. (2021). Does teacher burnout affect students? A systematic review of its association with academic achievement and student-reported outcomes. International Journal of Educational Research, 105. 14 studies, 5,311 teachers and 50,616 students; 8 primary settings and 6 secondary; 8 cross-sectional, 4 longitudinal, 2 experimental. Burnout associated with worse achievement in four of seven studies at small-to-medium effect sizes; “little evidence to suggest an association between teacher burnout and students’ depressive symptoms, emotional distress, or attempted suicide.” Read as the accepted manuscript in the White Rose repository. eprints.whiterose.ac.uk (PDF)
    • Shen, B., McCaughtry, N., Martin, J., Garn, A., Kulik, N., & Fahlman, M. (2015). The relationship between teacher burnout and student motivation. British Journal of Educational Psychology, 85(4), 519–532. 1,302 high school students and 33 physical education teachers across 20 schools in two demographically similar Midwestern U.S. districts, surveyed at the start and end of a semester and analysed with hierarchical linear modelling. Emotional exhaustion negatively related to perceived teacher autonomy support; depersonalization inversely related to student autonomous motivation controlling for autonomy support. Read via the abstract in the ERIC record; the full text sits behind Wiley and was not accessible, so nothing beyond the abstract is claimed here. eric.ed.gov
    • Sorensen, L. C., & Ladd, H. F. (2020). The hidden costs of teacher turnover. AERA Open, 6(1). North Carolina middle schools, grades 6–8, 1994–95 through 2015–16, math and English Language Arts. A 10 percentage point increase in turnover associated with about .011 standard deviations lower scores overall (.013 math, .007 reading); “marked, and lasting, negative consequences for the quality of the instructional staff”; the rise in lateral or provisionally licensed staff was 8.7 percentage points larger in the highest-poverty schools and 14.5 points larger in low-performing schools. Limitations stated by the authors: no value-added measures of teacher quality, and some student characteristics available only in select years. journals.sagepub.com
    • Ronfeldt, M., Lankford, H., Loeb, S., & Wyckoff, J. (2011). How teacher turnover harms student achievement (NBER Working Paper No. 17176). Roughly 625,000 observations of 4th and 5th grade students in New York City, 2000–2002 and 2004–2007. Math scores six to seven percent of a standard deviation lower in grade-years with 100 percent turnover than with none; in lower-achieving schools, students whose own teacher stayed also performed significantly worse when turnover was high, while in higher-achieving schools there was no such effect. Grades 4–5, not a secondary result. Later published as Ronfeldt, Loeb & Wyckoff (2013), American Educational Research Journal, 50(1); the working paper is the version read here. nber.org (PDF)
    • Miller, R. T., Murnane, R. J., & Willett, J. B. (2006). The impact of teacher absences on student achievement. Harvard Graduate School of Education / NBER Summer Institute. 6,166 fourth-grade students, 231 teachers, 73 schools in one large urban district, school years 2003 and 2004. The first ten days of teacher absence associated with about 0.15 of a standard deviation lower fourth-grade mathematics achievement. Limitations stated by the authors: one district, one grade, mathematics only (English Language Arts effects smaller and inconsistent), reliance on instrumental variables, and 16–24 percent of prior achievement values imputed. Grade 4, and an absence study rather than a burnout study. Later published in Educational Evaluation and Policy Analysis, 30(2). conference.nber.org (PDF)

    Every source above was opened and read for this article. Where a figure could not be confirmed in the original, it is not on this page.


    About Clay Shumate

    Clay Shumate is a certified secondary Social Studies teacher in the public schools of West Alabama, with seven years of classroom experience, a B.A. in History, and an M.Ed. in Secondary Education. He writes about project-based learning, student responsibility, respect, and practical ways to hold young people to a higher standard while giving them room to learn from mistakes.
  • First Year Teacher Burnout: What Year One Is Missing, Not What You Are

    First Year Teacher Burnout: What Year One Is Missing, Not What You Are

    By Clay Shumate

    The first year is harder because you are doing the job without the things that make it doable later, not because you are weaker than the people around you. A fifth-year teacher opens a folder that already works. You are building that folder in real time, while the bell keeps ringing. Year one is a resource problem before it is a character problem.

    This page is about what is specifically different about year one. If you want the definition and the three dimensions of the word itself, start with the groundwork the rest of this series is built on. For the demand side at classroom resolution, what the loads actually consist of and how good the evidence is covers it and this page does not repeat it. This one answers a narrower question: what does a first-year teacher not have yet, and what can be done about it before June?

    Key takeaways

    • Most first-year teachers do not leave. In the federal study that followed a national cohort of about 1,990 first-year public school teachers, 10 percent were not teaching in year two and 17 percent were not teaching by year five. The line about half of new teachers quitting inside five years does not come from that data.
    • Year one is a resource problem more than a demand problem. The job is not heavier than it will be in year five. Your side of the ledger is emptier.
    • Five things a veteran has are accumulated, not innate: a bank of materials, a read on which behavior matters, relationships with families, a settled routine set, and somebody they can ask.
    • First-year teachers who had a mentor stayed at higher rates — about 86 percent against 71 percent at year five — but that is a correlation. The one large randomized trial of a full induction program found no effect on retention at all.
    • New teachers are often handed lower-achieving classes than colleagues in the same building. In a large district study covering grades 4–11, time at that particular school predicted a better assignment more than teaching experience elsewhere did.
    • Teachers improve fastest in their first few years. Year one is the steep part of a learning curve, not a verdict.
    • Burnout is an occupational condition, not a diagnosis you can give yourself from a web page. Nothing here is a screening instrument.
    Free download

    The Year-One Inventory

    Two printable pages. A write-in sheet for the five things a first-year teacher has not built yet, plus the request that goes with each one and who to take it to. It is a sorting sheet, not a screening instrument, and it returns no score. Free. No email address required. Designed for grades 6–12.

    Download the free PDF

    Why is the first year harder than the years after it?

    Because almost everything a veteran teacher runs on was built over time, and you are building yours while teaching full time.

    Think of it as stock and flow. The flow — five classes a day, the grading, the emails, the duty — is roughly the same for you as for the teacher across the hall. The stock is not. They have four years of lessons that already survived contact with actual teenagers. You have a syllabus and a pacing guide. Every single thing you teach this year is a first draft written the night before, and first drafts take three times as long as revisions.

    The same gap shows up in decisions. A veteran walking into a room where two students are arguing has seen that exact shape of argument forty times and knows in a second whether to say anything. You have not, so you think about it. Multiply that by every small call you make in a day and the same job is genuinely more tiring for you than for the person next door.

    None of that is a statement about your ability. It is a statement about elapsed time.

    The research on how teachers get better says the same thing from the other direction. Papay and Kraft tracked more than 3,500 teachers in one large urban district over nine years and found improvement is fastest early — roughly 0.08 standard deviations in math and 0.05 in reading across the first five years, then continuing afterward at 45 to 60 percent of that rate. Label it properly: grades 4 through 8, one district, test scores only. But the shape is the point. Year one sits at the steep part of a curve, struggling there is what that curve looks like from inside it, and it is also where practice and coaching pay back fastest.

    Do most first-year teachers burn out and quit?

    No. The federal data says most of them stay.

    The National Center for Education Statistics followed a national cohort of roughly 1,990 first-year public school teachers who started in 2007 or 2008, and checked on them every year for five years. Ten percent were not teaching in year two. Twelve percent were not teaching in year three, 15 percent in year four, and 17 percent in year five.

    Read the limits with the number. That is one cohort, and it ran from 2007–08 through 2011–12, so it is not a report on this year’s teachers. NCES also notes that people leave and come back, so the year-by-year figures are not a simple running total of departures. And it measures leaving, which is not the same thing as burning out — plenty of people stay in the classroom and are not all right. that is a different question with its own answer.

    Still, the myth matters. New teachers get told the half-quit-in-five-years version constantly, usually by someone who means it kindly. What it tells somebody having a bad October is that failure is the normal outcome. It is not.

    What does a first-year teacher not have that a fifth-year teacher does?

    Five things, and all five are accumulated rather than innate.

    List graphic of five resources a first-year teacher has not accumulated: a bank of materials, a read on behavior, relationships with families, a settled routine set, and somebody to ask.
    The resource side of the ledger at year one. Every item is accumulated, not innate.
    • A bank of materials. Lessons, readings, slides, assessments and rubrics that have already been run once and fixed. This is the biggest single one, and it is the reason your evenings are longer than theirs.
    • A read on behavior. Knowing which behavior needs a response right now, which is a student having a bad morning and will pass on its own, and which never needed one. That is a judgment about situations, not about which students are worth your time, and it is learned by seeing a few hundred of them.
    • Relationships with families. A fifth-year teacher has often taught an older sibling. The families are not the problem here; the cold start is. That first phone call is simply a different call when the name on the other end already means something.
    • A settled routine set. Entry, transitions, materials, closing. A veteran runs these without thinking. You are inventing and revising them at the same time you are enforcing them. the mechanics of building those is most of the work of a first semester.
    • Somebody to ask. A specific person who will answer a question in 40 seconds without it turning into a meeting or a referral. This is the one most often missing entirely.

    Notice what is not on that list: talent, toughness, or how much you care. Every item is something a person acquires by being somewhere for a while. That is also why the year-one money problem is real — with no accumulated classroom stock you buy more of it, and teachers in RAND’s 2026 national survey reported spending a little over $600 out of pocket on school supplies. that spending is part of a wider pattern and it lands hardest on the person who has nothing in the cupboard yet. If you are stocking a room from scratch, spend first on the inexpensive supplies every class period actually uses.

    Does having a mentor actually keep new teachers in the job?

    The correlational evidence says yes. The one large randomized trial says no. The honest answer depends on what the word mentor means in your building.

    Comparison graphic of four studies on mentoring and new teacher retention, each labelled with whether it shows an association, a prediction, a review, or a randomized causal test.
    Three studies find an association. The one randomized trial found no retention impact, and it was run in elementary schools.

    Start with the association. In that same federal cohort, first-year teachers who were assigned a mentor were still teaching at year five about 86 percent of the time, against about 71 percent of those who were not. That is a fifteen-point gap and it is not nothing. It is also not an experiment: nobody assigned mentors by coin flip, and schools that bother to assign mentors differ from schools that do not in a dozen other ways.

    Two more studies point the same way. Ronfeldt and McQueen, using three rounds of the federal Schools and Staffing and Teacher Follow-Up surveys plus that same beginning-teacher cohort, found induction supports in the first year predicted less migration and less attrition among nationally representative samples of first-year teachers. Ingersoll and Strong’s review of 15 empirical studies found most reported positive associations between induction and commitment, retention, practice and achievement.

    Then there is the experiment. The Institute of Education Sciences randomly assigned 1,009 beginning teachers across 418 schools in 17 urban districts and 13 states either to a comprehensive induction program — a full-time mentor, structured observation, ongoing professional development — or to whatever their district already did. The finding, in the report’s own words, was that there was no impact on teacher retention over the first four years of the teachers’ careers. Trained observers also found no significant differences in classroom practice. Districts that ran two years of the program showed a student achievement gain in the third year, 0.11 standard deviations in reading and 0.20 in math, but that result shrank away when the sample was widened.

    Two things have to be said about that trial rather than around it. The schools in it were elementary schools, so it is the best-designed study in the pile and it is not a grades 6–12 result. And what it tested was a program, delivered at district scale, which is not the same object as the person two doors down who actually answers your questions.

    The summary that survives all four studies: a real mentor is worth asking for, and a mentor on paper is not the thing that will save your year. If yours is nominal, that is a fact about the assignment, not a fact about you, and it is worth naming to somebody with a title rather than absorbing.

    There is a district-level reading of that null result too, and it is not that induction is pointless. It is that buying an induction program is not the same transaction as buying retention. The trial spent real money on full-time mentors and structured observation and moved no retention needle in four years, which suggests the thing that keeps a new teacher is closer to the daily conditions of the job than to the program wrapped around it.

    Are you being handed a harder schedule than the teacher across the hall?

    Often, yes, and it usually reflects standing inside the building rather than any judgment about your teaching.

    Kalogrides and Loeb looked at 67,697 teacher-year records in one of the largest districts in the country, covering grades 4 through 11 from 2003–04 through 2010–11. Less experienced teachers were assigned lower-achieving students. A ten-year increase in experience was associated with roughly a third of a standard deviation increase in the average prior achievement of a teacher’s students, and teachers with 10 to 20 years had classes whose prior achievement ran .10 to .20 standard deviations above their first-year colleagues in the same school.

    The detail that matters most is which kind of experience did the work. Time at that school predicted a better assignment; experience at other schools in the district did not. That pattern points at seniority and standing rather than at skill, which is the honest reading and also the uncomfortable one.

    Read it carefully, though. It is one district, it is observational, and the authors say outright that they cannot fully separate deliberate preference from habit, though they report similar patterns in two other large districts. What it gives you is permission to stop treating your schedule as evidence about your ability. If your day really is harder than your neighbor’s, you may simply be right — and a schedule is one of the few things somebody with a title can change in an afternoon.

    It is worth saying the other half of that finding out loud, because it is not really about teachers at all. If the least experienced staff systematically get the lowest-achieving classes, then the students with the furthest to go are the ones most often taught by somebody in their first draft of the job. That is a scheduling decision made building by building, usually without anyone intending it, and it is a fairness problem that belongs to whoever builds the master schedule rather than to the new teacher standing in front of the room.

    What can you change in year one without anyone’s permission?

    Less than the advice books promise, but not nothing — and the useful moves all build stock rather than spend energy.

    • Pick three routines and run them identically every day. Entry, transitions, closing. Consistency is cheaper than improvisation and it buys back more minutes than any app. the new-teacher version of that is the place to start.
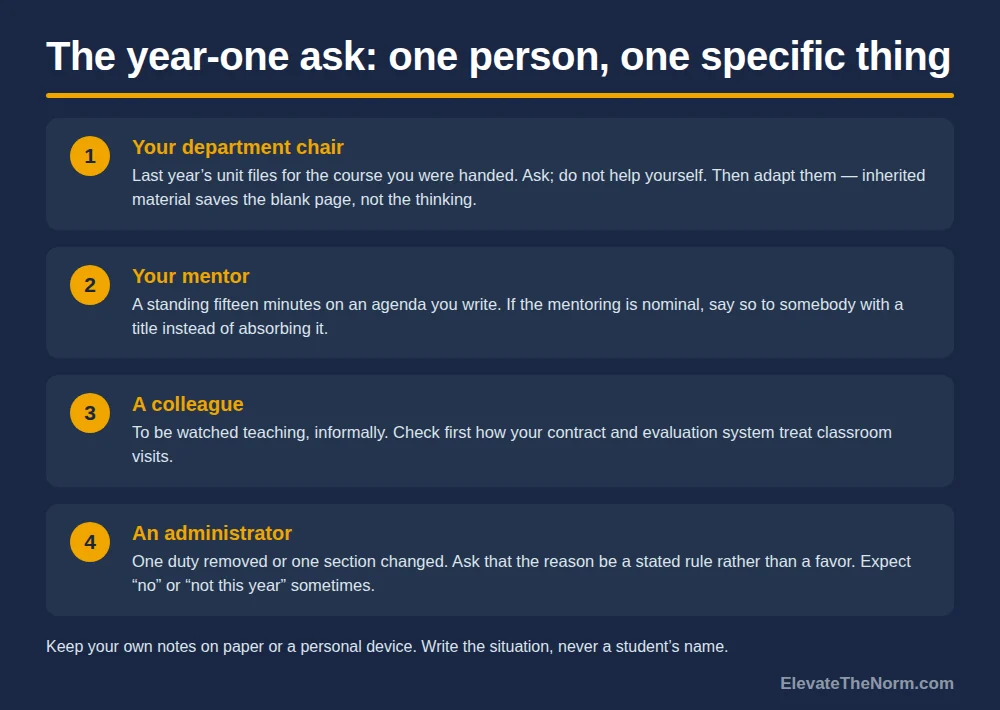
    • Stop building what already exists. Ask your department for last year’s unit files before you write a single slide. Most people hand them over and are mildly insulted nobody asked. Ask rather than help yourself — some of it is the district’s and some of it is that person’s own work — and adapt what you get to your students instead of running it blind. Inherited materials save you the blank page, not the thinking.
    • Make one thing reusable per week. One lesson cleaned up and saved properly. By May that is thirty-odd pieces of stock you did not have in August, which is the entire mechanism by which year two is easier.
    • Write down what happened, not how it felt. Two lines after the class that went wrong: what you did, what the room did. kept this way it is a record you can act on, and in a month it is data rather than a mood. Write the situation, never a student’s name. A private notebook about your own teaching is a useful thing; a running file on individual teenagers is a different object with rules attached to it, and you do not want to have made one by accident.

    What is not on the list is pushing through. Nobody in your building gets credit for outlasting a badly resourced year, and treating exhaustion as a rite of passage is how a fixable first year becomes a much longer problem to climb back out of.

    What should you ask for, and who should you ask?

    Ask one named person for one specific, small thing, and expect to hear no or not this year sometimes.

    Four-step graphic showing who a first-year teacher should ask and what for: a department chair for existing unit files, a mentor for a standing fifteen minutes, a colleague for an informal classroom visit, and an administrator for one duty removed or one section changed.
    Four requests, in rough order of how easy they are to say yes to.

    Vague requests get vague answers. “I’m drowning” is true and unanswerable. “Can I have the unit files for the course I picked up in August” is answerable in ten seconds. Four requests worth making, roughly in order of how easy they are to say yes to: existing materials from your department chair; a standing fifteen minutes with your mentor on an agenda you write; one colleague willing to be watched teaching, informally; and, from an administrator, one duty removed or one section changed. Check how your contract and evaluation system treat classroom visits before you set the informal one up, since in some places an observation is a defined thing with paperwork behind it.

    That list assumes a department to ask, and plenty of secondary teachers do not have one. If you are the only person in the building teaching your course — which happens constantly in electives, in small schools, and in any position that turned over in July — the request changes shape rather than disappearing. Ask whoever taught the course last, if they are still on staff. Ask your state department or subject association, which usually publish sequenced units for free. Ask a teacher of the same course at another school in the district; people say yes to that more often than new teachers expect. The goal is the same either way: do not write from a blank page if a page already exists.

    Go through the normal chain first — chair, then assistant principal, then principal. And if a duty does come off your plate, it is fair to ask that the reason be a rule rather than a favor, because a public criterion protects you from resentment down the hall more than quiet special treatment does.

    One practical caution. Keep your own notes about how the year is going on paper, or on a personal device. A district laptop and a district account are not private places to write down that you are not coping.

    When is this bigger than a first-year problem?

    When it stops lifting on weekends and breaks, or when it is showing up in your sleep, your body or your health.

    Burnout is an occupational condition — something that happens to a person in a job, described by how the job is going. It is not a diagnosis, and nothing on this page or any page can tell you whether you have one. That is also why this site publishes no burnout quiz: a score would imply a threshold, and there is no clinically validated cutoff to put a threshold on.

    So the honest answer here is the unglamorous one. If the exhaustion is not lifting when you are away from the building, or if you are seeing it in your sleep, your appetite or your health, talk to your doctor or a counselor. That is a conversation with a person, not a result from a page.

    What to do this week

    Three things, in order. Ask one person for one existing set of materials — that is the single highest-return hour available to you right now. Pick the one routine that is costing you the most minutes and run it the same way five days running. And save one lesson properly, cleaned up, where you will find it next year.

    Then write down what the week actually took, so that when you ask for something bigger you have specifics instead of a feeling. The inventory below is that, on two printed pages. Year one is short of stock, not short of you, and most of that gap closes by simply still being there in September.

    Want the inventory as a printable? Download The Year-One Inventory (2 pages, free, no email required) and fill it in before your next conversation with your chair.

    Frequently asked questions

    Is first year teacher burnout normal?

    Finding year one exhausting is close to universal, and it is not the same thing as burnout. The first year is harder because you have none of the accumulated stock a fourth or fifth year runs on — materials that already work, a read on behavior, relationships with families, settled routines, and a person you can ask. Burnout is a specific occupational condition with three dimensions, and a hard first year is not automatically it. If the exhaustion does not lift on weekends and school breaks, that is the signal worth paying attention to, and the next step is a conversation with a person rather than a checklist.

    Do half of new teachers really quit within five years?

    No. That figure does not come from the federal data. The National Center for Education Statistics followed a national cohort of about 1,990 first-year public school teachers who started in 2007 or 2008 for five years: 10 percent were not teaching in year two, 12 percent in year three, 15 percent in year four and 17 percent in year five. Three caveats belong with it. It is a single cohort, it ran from 2007–08 to 2011–12 rather than today, and NCES notes that teachers leave and return, so the yearly figures are not a running total of permanent departures.

    Does having a mentor stop new teachers from burning out?

    The evidence is genuinely mixed and it is worth knowing why. In the federal cohort, first-year teachers assigned a mentor were still teaching at year five about 86 percent of the time against about 71 percent of those who were not — but nobody assigned mentors at random, so that is an association, not a cause. The one large randomized trial, which assigned 1,009 beginning teachers across 17 urban districts to a comprehensive induction program or to business as usual, found no impact on retention over four years and no measurable difference in classroom practice. Those schools were elementary schools. The practical reading: a mentor who actually answers your questions is worth asking for, and a mentor who exists only on a form is not the thing that will carry your year.

    Is my child worse off with a first-year teacher?

    On average, less experienced teachers are somewhat less effective on test-score measures, and it is fair to want to know that. The size matters, though: the research on how teachers improve finds gains of roughly 0.08 standard deviations in math across the first five years, which is real but modest, and improvement continues well past year five. The larger fairness question is not about any individual teacher. It is that assignment is systematic — in a large district study covering grades 4 through 11, the least experienced teachers were consistently given the lowest-achieving classes, with time at that particular school predicting a better assignment more than teaching experience did. That is a scheduling decision, and it is a reasonable thing to ask a principal about.

    Are students to blame when a new teacher struggles?

    No. A first-year teacher is doing the job without materials, without a read on which behavior matters, and often without anyone to ask, and those gaps would make the year hard with any group of students in the room. Behavior shows up as a workload in the research, and that is a statement about how much of the job is unstructured, not about who is sitting in the desks. Nothing a student does makes them responsible for how a school resourced someone’s first year.

    What should a first-year teacher ask for, and from whom?

    One named person, one specific request, small enough to say yes to. Existing unit files from your department chair, a standing fifteen minutes with your mentor on an agenda you write, one colleague willing to be watched teaching informally, and from an administrator one duty removed or one section changed. Work the normal chain — chair, then assistant principal, then principal — and expect “no” or “not this year” sometimes without reading it as a verdict. If a duty does come off your plate, it is fair to ask that the reason be a stated rule rather than a favor.

    What if there is no department to ask for materials?

    This is common in secondary schools — electives, small buildings, and any position that turned over in July can leave one person teaching a course alone. The request changes shape rather than disappearing. Ask whoever taught the course last if they are still on staff. Your state department of education and your subject association usually publish sequenced units for free. Teachers of the same course at other schools in the district say yes more often than new teachers expect. The principle holds either way: do not write from a blank page when a page already exists.

    Is a bad first year a sign I chose the wrong career?

    Not on its own, and the timing makes that judgment unreliable. Year one sits at the steepest part of the improvement curve and at the emptiest point of your resources, which is the worst possible moment to evaluate a long-term fit. That is not an argument for staying no matter what, and there are good reasons people leave. It is an argument for making the call with better information — after you have asked for what is missing and seen what the answer is — rather than in February of a year you were under-equipped for.

    Sources

    • Gray, L., & Taie, S. (2015). Public School Teacher Attrition and Mobility in the First Five Years: Results From the First Through Fifth Waves of the 2007–08 Beginning Teacher Longitudinal Study (NCES 2015-337). National Center for Education Statistics. Approximately 1,990 first-year public school teachers, followed 2007–08 through 2011–12. 10, 12, 15 and 17 percent not teaching in years two through five; first-year mentor associated with 85.5 percent versus 71.4 percent still teaching at year five. The report notes that teachers may leave and later return, so the annual figures are not cumulative departures. nces.ed.gov (PDF)
    • Glazerman, S., Isenberg, E., Dolfin, S., Bleeker, M., Johnson, A., Grider, M., & Jacobus, M. (2010). Impacts of Comprehensive Teacher Induction: Final Results From a Randomized Controlled Study (NCEE 2010-4027). Institute of Education Sciences. 1,009 beginning teachers in 418 schools across 17 urban districts in 13 states, randomly assigned. “There was no impact on teacher retention over the first four years of the teachers’ careers.” No significant differences in observed classroom practice. A third-year student achievement impact in two-year districts (0.11 reading, 0.20 math) did not hold when the analytic sample was broadened. The schools were elementary schools, which this article states in the text. files.eric.ed.gov (PDF)
    • Ingersoll, R. M., & Strong, M. (2011). The impact of induction and mentoring programs for beginning teachers: A critical review of the research. Review of Educational Research, 81(2), 201–233. A review of 15 empirical studies since the mid-1980s across three outcomes — commitment and retention, classroom practice, and student achievement — with most reporting positive associations, and the large randomized trial above noted as the exception. Abstract read via ERIC; the full text sits behind a publisher paywall and is cited here as a review rather than as a source of effect sizes. eric.ed.gov
    • Ronfeldt, M., & McQueen, K. (2017). Does new teacher induction really improve retention? Journal of Teacher Education, 68(4). Drawing on the three most recent administrations of the Schools and Staffing and Teacher Follow-Up Surveys plus the Beginning Teacher Longitudinal Study, receiving induction supports in the first year predicted less migration and less attrition among nationally representative samples of first-year teachers. Predictive, not experimental. Abstract read via ERIC. eric.ed.gov
    • Kalogrides, D., & Loeb, S. (with Béteille, T.) (2013). Systematic sorting: Teacher characteristics and class assignments. Sociology of Education, 86(2). 67,697 teacher-year observations in Miami-Dade County Public Schools, 2003–04 through 2010–11, grades 4–11. A ten-year increase in experience was associated with about a third of a standard deviation increase in students’ average prior achievement; teachers with 10–20 years had classes .10 to .20 standard deviations higher than first-year colleagues. School-specific experience predicted assignment where district experience did not. Limitations stated by the authors: a single district (with similar patterns reported in Milwaukee and San Francisco), limited teacher characteristics, and no way to fully separate preference from bias. edpolicyinca.org (PDF)
    • Papay, J. P., & Kraft, M. A. (2015). Productivity returns to experience in the teacher labor market: Methodological challenges and new evidence on long-term career improvement. Journal of Public Economics, 130, 105–119. More than 3,500 teachers and over 200,000 student-year records in one large urban southern district, 2000–01 to 2008–09, grades 4–8. Improvement of roughly 0.08 standard deviations in mathematics and 0.05 in reading over the first five years, continuing afterward at 45 to 60 percent of that rate in mathematics. Limitations stated by the authors: a single district, insufficient statistical power for later-career estimates, four modeling approaches producing different estimates, and test scores as “only one important educational outcome.” matthewakraft.com (PDF)
    • Steiner, E. D., Levine, R. S., & Doan, S. (2026). Teacher Well-Being, Pay, and Intentions to Leave in 2026: Selected Findings From the 2026 State of the American Teacher Survey (RR-A4404-2). RAND. American Teacher Panel, nationally weighted. Teachers reported spending a little more than $600 out of pocket on school supplies, and 18 percent intended to leave their jobs. Teachers have been more likely than similar working adults to report poor well-being on every indicator since 2021. rand.org

    Every source above was opened and read for this article. Where a figure could not be confirmed in the original, it is not on this page.


    About Clay Shumate

    Clay Shumate is a certified secondary Social Studies teacher in the public schools of West Alabama, with seven years of classroom experience, a B.A. in History, and an M.Ed. in Secondary Education. He writes about project-based learning, student responsibility, respect, and practical ways to hold young people to a higher standard while giving them room to learn from mistakes.
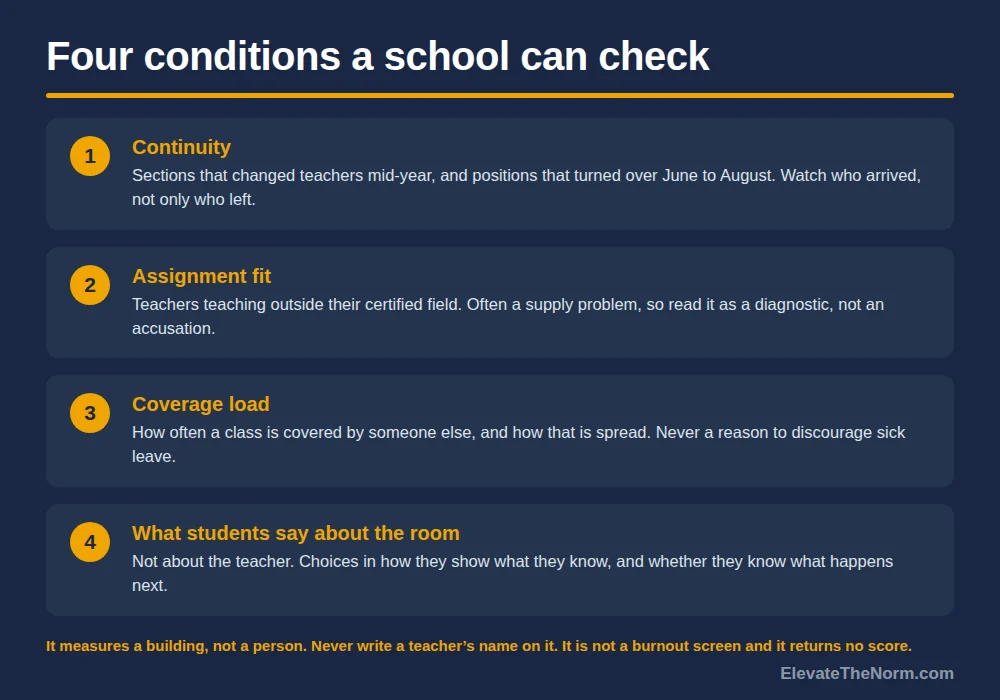
  • Causes of Teacher Burnout: What the Research Blames, and What It Can’t Prove

    Causes of Teacher Burnout: What the Research Blames, and What It Can’t Prove

    By Clay Shumate

    Teacher burnout is caused by working conditions, not by personal weakness. Asked directly, teachers rank managing student behavior first, low salary second, and hours worked outside the contract third. The strongest longitudinal research supports those as real causes, and what those conditions end up costing the students in the room is a separate question with its own evidence. It also shows the arrow runs both ways: burnout changes how heavy the same job feels.

    This page is about those causes at classroom resolution — what the loads actually consist of in a grades 6–12 job, and how strong the evidence behind each one really is. If you want the definition and the three dimensions, start with what the word actually means before you go looking for a cause. If you are trying to work out whether what you are feeling is burnout at all, whether what you are feeling is the thing with the name is the better door. This one answers a narrower question: why does this happen, and where does the research actually point?

    Key takeaways

    • About half of teachers named managing student behavior a top source of job-related stress in RAND’s 2026 national survey. Low salary followed at 33 percent, hours outside contract hours at 32 percent.
    • Student behavior is the most consistently measured cause: across 21 samples, misbehavior correlated with emotional exhaustion at a median of .42. That is behavior measured as a workload, not students measured as a problem.
    • Teachers reported working 53 hours a week against a contract of 40 or less. About 12 of the 15 extra hours appeared to be uncompensated.
    • No national survey establishes what those extra hours consist of. RAND says so outright. Anyone telling you grading is the number one cause is guessing.
    • In the best change-score evidence available, missing resources predicted burnout slightly more strongly than excess demands. What you do not have hurts about as much as what you have too much of.
    • Cause runs both directions. Burnout at one wave predicted higher job demands two waves later, which is a feature of the condition and not a character flaw.
    Free download

    The One-Week Teacher Demand Log

    Two printable pages. A five-day write-in log for finding out which demand is actually driving your week, plus a page on how to read it and how to make the request. It is a sorting sheet, not a screening instrument, and it returns no score. Free. No email address required. Designed for grades 6–12.

    Download the free PDF

    What causes teacher burnout?

    Job conditions cause it — more precisely, a long-running mismatch between what the job demands of you and what the job gives you to meet those demands with. When teachers are asked to name the source themselves, three answers dominate.

    RAND’s 2026 State of the American Teacher survey put the question to 829 K–12 public school teachers, alongside 498 similar working adults, between late January and late February 2026, weighted to be nationally representative. On sources of job-related stress, the ranking came out like this.

    • Managing student behavior — about half of teachers.
    • Low salary — 33 percent.
    • Too many hours working outside contract hours, or doing administrative work — 32 percent.
    • The intrusion of political issues into teaching — 16 percent.
    • Physical safety or job security concerns — 3 percent.

    Two honest notes before anyone uses that list. First, it ranks what teachers name, which is not the same as ranking what does the most damage. Second, RAND’s own press release rounds the behavior figure to 52 percent while the report’s figure reads closer to 50 and its caption says “about half.” I am using “about half,” because that is the version both documents support.

    Why does student behavior outrank low pay?

    Because it is the demand you meet forty times a day, and because handling it is the part of the job with the least structure around it.

    Ranked list of the five sources of job-related stress teachers named in RAND's 2026 survey, from managing student behavior at about half of teachers down to physical safety or job security at 3 percent.
    What teachers themselves name, in rank order. RAND, 2026 State of the American Teacher.

    It is also the most consistently measured cause in the literature. Aloe and colleagues pooled 21 independent samples and 63 effect sizes and found student misbehavior correlated with emotional exhaustion at a median of .42, ranging from .09 to .74 across studies — the largest of the three burnout dimensions. Depersonalization came second, .10 to .71. Reduced personal accomplishment was smallest. Grade level was one of the moderators that explained variation between studies, so a figure pooled across elementary and secondary is not automatically a secondary figure, and a good deal of the variation stayed unexplained. The authors say so plainly.

    Here is what “student misbehavior” means at grades 6–12 resolution, because the phrase sounds like fights and mostly it is not. It is the phone that comes back out ninety seconds after you asked. It is the fourth redirect to the same student in one period, in a voice you are working to keep level. It is the kid who will not start and will not say why — and who very likely has a reason you do not know yet. Each one costs almost nothing. Thirty of them in an hour costs something real, and five periods of thirty is the load.

    Be clear about where that leaves the blame, because this research gets quoted as though it lands on students. It does not. A fourteen-year-old testing a boundary is doing what fourteen-year-olds do, and it is not a student’s job to protect an adult’s wellbeing. The burnout driver is not the behavior. It is whether you are absorbing the volume of it alone, with no agreed rule, no second adult, and no answer when you ask for one — all of which are decisions somebody with a title can make.

    How much of the job happens outside the paid day?

    About fifteen hours a week, and most of it is unpaid.

    Five numbered cards showing that teachers reported working 53 hours a week against a contract of 40 hours or less, leaving a 15-hour gap of which about 12 hours appeared uncompensated.
    The workweek against the contract. RAND, 2023 State of the American Teacher.

    RAND’s 2023 survey asked 1,439 K–12 public school teachers and 527 comparison working adults. Teachers reported working 53 hours in a school-year week against 46 for the working adults, even though nearly all of them said their contract was for 40 hours or less. Of the roughly 15 uncontracted hours, about 12 appeared to be uncompensated — about one hour in every four worked. A quarter of teachers said they were mostly or very satisfied with their weekly hours. Half of working adults said so.

    Now the part most articles skip. RAND did not ask what those hours were spent on. Their words: “Our survey did not ask teachers about the amount of time they spent on specific activities while they were working, so we cannot shed light on how teachers used their time.” So when you read that grading is the number one cause of teacher burnout, understand that no national survey establishes it. It may well be true for you. It may be family contact, or coverage, or meetings, or the four unrelated things you got asked for in a hallway. You cannot find out from an article, which is why this one ends in a log rather than a conclusion.

    One caveat that runs the other way. RAND notes that researchers comparing self-reported hours against time diaries generally find self-reports run high, with estimates of teachers’ overestimation ranging from two to six hours a week. Treat 53 as reported hours, not a stopwatch figure. The gap against the contract survives the correction. It just shrinks.

    It is also worth separating two different things that both live in those hours. Some of the load is genuinely too large for the time available and needs to be smaller. Some of it is larger than it needs to be because of how the work is built — an assessment that could be half the length and tell you the same thing, a gradebook structured so the evidence does not pile up, a family-contact routine with no rotation in it. The first needs a resource from somebody. The second is a design problem, and it is the kind of thing an instructional coach is actually useful for. Guessing which one you have is how people end up angry at the wrong thing. The log at the end of this article is built to tell you which.

    And on family contact specifically: the load is the volume and the absence of any system for it, not the fact that families want to talk to you. A parent who calls is not the problem. Forty parents who each reasonably expect an individual reply, with no rotation and no protected time to make the calls, is a staffing decision that has been quietly turned into a personal one.

    Does low pay cause burnout, or just make it harder to accept?

    Probably the second, and that still counts.

    A third of teachers named salary. In the same 2026 survey, average base pay was $75,599 against more than $105,000 for the comparison group of similar working adults, and teachers’ pay made up 60 percent of household income where other workers’ made up 68. Ninety-four percent reported spending their own money on classroom supplies, averaging around $665.

    The mechanism worth naming is not that low pay makes you tired. It is that fifteen unpaid hours is a different fact at different salaries. Unpaid overtime you can absorb reads as commitment. Unpaid overtime you cannot absorb reads as being taken advantage of, and that reading, rather than the hours themselves, is the corrosive part. Reward and fairness are two of the conditions the burnout literature keeps returning to, and pay sits in both of them.

    Do we actually know these are causes?

    Partly. The best evidence is decent, and it is not from teachers.

    The strongest design available asks whether changes in conditions predict changes in burnout, rather than measuring both once and calling it causation. Schaufeli, Bakker and Van Rhenen ran that design across two waves a year apart. Increases in job demands — overload, emotionally upsetting situations, work bleeding into home — predicted burnout, standardized beta .23. Decreases in job resources — social support, autonomy, opportunities to learn, feedback — predicted it slightly more strongly, beta .27.

    Read the label before using the number. The sample was 201 telecom managers at one large Dutch company, not teachers, and the authors call that sample’s homogeneity a weakness themselves. What transfers is the shape of the finding, not the coefficient: what you do not have hurts about as much as what you have too much of. That is the most useful line on this page, because the public conversation about teacher burnout is almost entirely about things being added, and half the mechanism is about what was taken away.

    Now the complication, which belongs here and not in a footnote. Cause runs in both directions. A four-wave Norwegian study of 272 employees found burnout at one wave predicted higher job demands two waves later, rho .12. Small, but real, and it matches what teachers describe: the year did not only get harder, you also got less able to carry the same weight, and the two fed each other. Same caution on the label — 272 people, heavy attrition from about a thousand starters, no occupational data, and a Norwegian sick-pay system behind the absence measures.

    Two things follow, and they pull in opposite directions, so hold both. One: do not read the reverse arrow as evidence the problem is in your head. Depletion changing how you read the job is a documented feature of the condition, not a character flaw. Two: do not wait for the conditions to change on their own before you do anything, because the loop runs whether or not anyone intervenes.

    What about autonomy and administrative support?

    Directionally supported. Thinly evidenced in teachers specifically.

    Autonomy is one of the four resources in the study above, and the absence of resources was on the stronger side of that ledger. The teacher-specific evidence is weaker than you would hope. A 2025 study of 824 US teachers found autonomy moderated the relationships between administrative support, job satisfaction and burnout — but the interaction effects were small, with delta R-squared between .006 and .016; the design was cross-sectional; the burnout measure was a three-item scale the authors themselves describe as less robust than the Maslach Burnout Inventory; and nearly half the sample taught PK–5. It is the weakest source on this page and I would rather say so than dress it up.

    The practical version does not need the statistics. Autonomy in a 6–12 job is mostly small and specific. Whether you choose the order of your units. Whether you can move a due date without asking. Whether the assessment you give is one you wrote. Every one of those is a decision somebody either leaves with you or takes off you. That is worth knowing when you are trying to name what is wrong, because “I have no autonomy” is nearly impossible to act on and “I cannot move a due date” is a sentence an administrator can answer.

    Which cause is actually yours? A one-week demand log

    You cannot get this from a list, including this one. National rankings tell you what is common. They do not tell you which load is taking you apart. So run a log for five teaching days. It takes a few minutes at the end of each day, and the first day takes longer than the rest.

    Four numbered cards describing the columns of a one-week teacher demand log: name the load in the concrete, log the hour rather than estimate it, mark it contracted or not, and name the missing resource.
    Four columns, five days. It is a sorting tool and it returns no score.

    Four columns. One row for every hour you work outside your contracted day, plus a row for any class period that cost more than it should have.

    1. Name the load in the concrete. Not “workload.” Thirty-four short-answer responses, two classes. Not “behavior.” Eleven redirects, fourth period. Count the redirects; never write a student’s name. This is a record of your workload, not a record about a child, and the moment it names kids it becomes something else entirely. The concrete version is also the only version anybody can act on.
    2. Log the hour, do not estimate it. Write the clock time you start and the clock time you stop. Estimates drift in both directions, and the point is to find out what is true rather than to win an argument.
    3. Mark it contracted or not. One letter, C or U. By Friday you will have your own version of the fifteen hours, for your own job.
    4. Name the missing resource. What would have made this cost less? More time. A decision that is not yours to make. Another adult in the room. A rule the whole team actually enforces. An answer from somebody who has been sitting on it. This column is what turns a complaint into a request.

    Then read it on Friday and look for one of three patterns.

    • One load dominates. Most of your unpaid hours are the same activity. That is the easiest kind of ask to make, because it is specific and somebody can say yes or no to it.
    • The hours are spread thin across six things. No single fix exists, which usually means the problem is the number of things rather than any one of them — so the conversation is about what comes off the plate, not how to do each one faster.
    • Column four keeps saying the same word. If “a decision” or “another adult” shows up five times, the missing resource is the finding. The load was never the story.

    If a week is more than you have right now, shrink it. Do one day. Or skip the first three columns entirely and fill in only column four for a week — what was missing, once a day, one line. Starting a five-day data-collection project is a strange thing to ask of somebody who is already underwater, and a partly filled sheet still tells you more than another month of guessing.

    A log is not a diagnosis and it does not score you. Nothing on this page can tell you whether you are burned out. There is no validated clinical cutoff for that, and a web page is the wrong instrument regardless. What the log can do is turn “I am drowning” into four lines somebody can act on. If the honest answer after five days is that you are not coping, the next conversation is with your doctor or a counselor, not with a checklist.

    One practical note. Keep it on paper, or somewhere that is not the school network. A district device is not a private place to write down that the job is beating you.

    What to do next

    Start with the concrete version of your worst week rather than the general one. Run the log for five days. Then take the single clearest row to whoever can act on it — your department chair or your direct administrator, through the normal chain rather than around it — and lead with the missing resource rather than the feeling, because a resource is something a person can say yes or no to in about ten seconds.

    If you are a special educator, this page’s log is only half your ledger — a demand set that does not appear on this page at all sits on top of it. Expect a fair number of those asks to come back as “no,” or “not this year.” The log is still worth running, because now you know precisely which no you are living with and whether you can live with it. And it is fair to ask what the criterion is. If relief goes to whoever asks best, it is unfair to every colleague who did not ask, and a public rule for who gets a duty removed is better for a staff than a favour quietly granted.

    If the log says the load itself is the problem and no resource fixes it, that is a real answer too. There are two honest directions from there: getting back on your feet once the cause has already done its work, and weighing the job you have against the one you might take. Neither is a failure. Both beat a fourth year of guessing.

    And if you are reading this as the person who assigns the loads rather than the one carrying them, that four-column log is also a short, specific agenda for a conversation you can start on Monday.

    Want the log as a printable? Download The One-Week Teacher Demand Log (2 pages, free, no email required) and run it for five teaching days.

    Frequently asked questions

    What is the number one cause of teacher burnout?

    When teachers are asked to name their top sources of job-related stress, managing student behavior comes first — about half of teachers named it in RAND’s 2026 national survey, ahead of low salary at 33 percent and hours outside the contract at 32 percent. Two cautions. That ranks what teachers name, which is not the same as ranking what does the most damage, and no single cause explains an individual case. The useful question is not which cause is biggest nationally but which one is taking up your week.

    Does this mean students are to blame for teacher burnout?

    No. A fourteen-year-old testing a boundary is doing what fourteen-year-olds do, and it is not a student’s job to protect an adult’s wellbeing. The research measures student behavior as a workload — the volume of redirects an adult absorbs in a day — not as a moral failing. What turns that volume into a burnout driver is the absence of support around it: no agreed rule, no second adult, no answer when a teacher asks for one. Those are adult decisions, made by adults.

    I am a student. Should I change how I act so my teachers do not burn out?

    That is a generous question and the honest answer is no — not for that reason. Your teacher’s working conditions are set by adults with authority you do not have, and carrying an adult’s wellbeing is not a job that belongs to you. Treating people decently is worth doing on its own merits. If a teacher of yours seems to be struggling, the right move is to mention it to another adult you trust, not to try to fix it yourself.

    Is grading the biggest cause of teacher burnout?

    Nobody knows, and any article that tells you otherwise is guessing. RAND asked teachers how many hours they work but states plainly that its survey “did not ask teachers about the amount of time they spent on specific activities,” so there is no national figure breaking the extra hours into grading, planning, meetings, coverage or family contact. Grading may well be the biggest load in your job. It is not established as the biggest load in the profession.

    How many hours do teachers actually work outside their contract?

    In RAND’s 2023 survey of 1,439 K–12 teachers, the average teacher reported working 53 hours in a school-year week while nearly all said their contract covered 40 hours or less. Of the roughly 15 uncontracted hours, about 12 appeared to be uncompensated — roughly one hour in every four worked. One honest caveat, which RAND raises itself: self-reported hours tend to run high, with estimates of teachers’ overestimation ranging from two to six hours a week. The gap survives the correction; it just shrinks.

    Can low pay by itself cause burnout?

    The more defensible reading is that pay changes what the rest of the job means rather than causing exhaustion directly. Fifteen unpaid hours is a different fact at different salaries: overtime you can absorb reads as commitment, and overtime you cannot absorb reads as being taken advantage of. Reward and fairness are both conditions the burnout literature keeps returning to, and pay sits in both of them.

    Does the research actually prove these things cause burnout?

    Partly, and the honest answer has caveats. The strongest available design measures whether changes in conditions predict changes in burnout. Schaufeli, Bakker and Van Rhenen found they do — but in 201 telecom managers at one Dutch company, not in teachers. And causation runs both ways: a four-wave Norwegian study found burnout at one point predicted higher job demands later. So the conditions are real causes, the teacher-specific causal evidence is thinner than the confident headlines suggest, and the loop feeds itself once it starts.

    Does burnout have one cause I can fix?

    Usually not one, and the combination is the point. That is why the last section of this article is a five-day log rather than a ranked list: it is built to tell you which load and which missing resource are actually yours. But a log is not a diagnosis and it returns no score. Nothing on a web page can tell you whether you are burned out. If the honest answer after a week is that you are not coping, the next conversation is with your doctor or a counselor.

    Sources

    • Steiner, E. D., Levine, S., & Doan, S. (2026). Teacher Well-Being, Pay, and Intentions to Leave in 2026: Selected Findings from the 2026 State of the American Teacher Survey. RAND, RR-A4404-2. 829 K–12 public school teachers and 498 similar working adults, surveyed late January to late February 2026, weighted to be nationally representative. Source of the ranked stressors, the pay and supply-spending figures. Note the discrepancy handled in the text: RAND’s press release rounds the student-behavior figure to 52 percent while the report’s own figure reads closer to 50 and its caption says “about half.” Report · Press release
    • Doan, S., Steiner, E. D., Pandey, R., & Woo, A. (2023). All Work and No Pay — Teachers’ Perceptions of Their Pay and Hours Worked. RAND, RR-A1108-9. 1,439 K–12 public school teachers and 527 comparison working adults. Source of the 53-hour week, the 15 uncontracted hours, the 12 uncompensated ones, and the satisfaction comparison — and of the self-report caveat quoted in the text. rand.org
    • Aloe, A. M., Shisler, S. M., Norris, B. D., Nickerson, A. B., & Rinker, T. W. (2014). A multivariate meta-analysis of student misbehavior and teacher burnout. Educational Research Review, 12, 30–44. 21 independent samples, 63 effect sizes. Median correlation with emotional exhaustion .42 (range .09–.74); depersonalization second (.10–.71); reduced personal accomplishment smallest. Grade level was among the moderators, and substantial variability remained unexplained. sciencedirect.com
    • Schaufeli, W. B., Bakker, A. B., & Van Rhenen, W. (2009). How changes in job demands and resources predict burnout, work engagement, and sickness absenteeism. Journal of Organizational Behavior, 30, 315–335. Two waves a year apart, 201 telecom managers in the Netherlands. Increases in demands predicted burnout (β = .23); decreases in resources predicted it more strongly (β = .27). Not a teacher sample, and the authors name the homogeneity of the sample as a weakness. Full text (PDF)
    • Øvergård, K. I., Gottenborg, S., Hoff, T., Johnsen, S. Å. K., & Rydstedt, L. (2025). A longitudinal path analysis of the reciprocal and cyclical relationships between sickness absence, job demands, job resources, and burnout. Frontiers in Psychology, 16, 1557898. Four waves, 272 Norwegian employees. Burnout at T2 predicted job demands at T4, ρ = 0.12. Limitations stated by the authors: heavy attrition from roughly 1,000 initial respondents, a predominantly female sample, no occupational data, and a Norwegian sick-pay context. frontiersin.org
    • Teacher voices matter: The role of teacher autonomy in enhancing job satisfaction and mitigating burnout (2025). PLOS ONE. 824 US teachers, cross-sectional, end of the 2021–22 school year. Autonomy moderated administrative support and job satisfaction in predicting burnout, with interaction effects of ΔR² = .006 to .016. The weakest source cited here, and labelled as such in the text: cross-sectional, a three-item burnout scale the authors themselves call less robust than the Maslach Burnout Inventory, and a sample that was 48 percent PK–5. journals.plos.org

    Every source above was opened and read for this article. Where a figure could not be confirmed in the original, it is not on this page. The same discipline applied to the headline figures is on the page that traces every burnout percentage to its own survey.


    About Clay Shumate

    Clay Shumate is a certified secondary Social Studies teacher in the public schools of West Alabama, with seven years of classroom experience, a B.A. in History, and an M.Ed. in Secondary Education. He writes about project-based learning, student responsibility, respect, and practical ways to hold young people to a higher standard while giving them room to learn from mistakes.
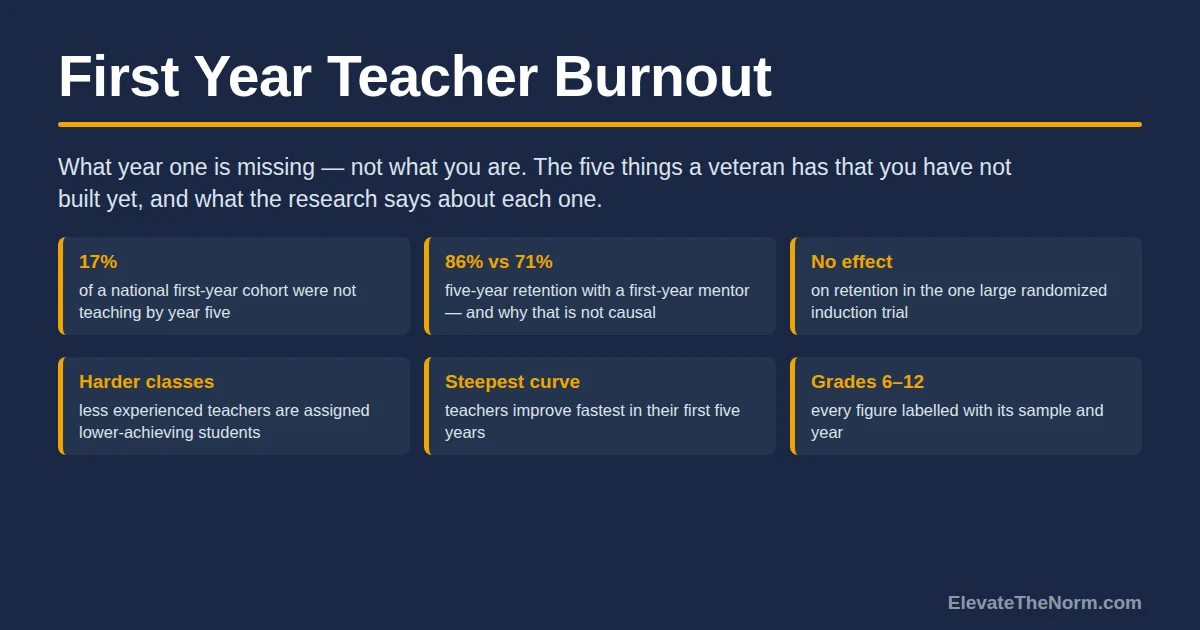
  • Jobs After Teacher Burnout: Where Teachers Actually Go

    Jobs After Teacher Burnout: Where Teachers Actually Go

    Most teachers who leave the classroom do not leave education. In the federal follow-up survey, 39 percent of former public school teachers were working for a school or district in K–12 in a job that was not regular classroom teaching, while about 12 percent had moved outside education entirely. What most of them said got better was time and control. What usually did not was pay or job security.

    This page is about a decision adults make with real consequences, so it does not push. It will not tell you to quit and it will not tell you to stick it out. Both of those are cheap advice from someone who does not have to live in your house. What it will do is put the actual numbers in front of you — where teachers go, what improves, what gets worse, and how many people who say they are leaving are still there a year later — and give you a way to test a job before you take it. If you are earlier in this than that, start with what the word means and who holds the levers, or with the recovery side of this, written for people who are staying.

    Key Takeaways

    • The most common destination is another job in K–12. Among former public school teachers, 39 percent were working for a school or district in a K–12 role that was not classroom teaching. Only about 12 percent were working outside education.
    • Time and control improve. Money and security usually do not. Of former teachers who were working, 65 percent said work–life balance was better than in teaching and 60 percent said autonomy was better — but only 38 percent said salary was better, and only 21 percent said job security was.
    • Nobody can promise you that leaving fixes burnout. The research overwhelmingly measures plans to leave, not what happens afterward. That gap is real and this article does not paper over it.
    • Burnout is a property of working conditions. A review of the measurement literature puts it flatly: it is “not a personal problem, but a consequence of certain characteristics of the work activity.” A new job with the same conditions is a new job with the same conditions.
    • Planning to leave is not leaving. In a study of 7,714 teachers, nearly three-fourths of those who said they planned to leave or retire were still in the same school the next year. Thinking hard about it is normal. It is not a commitment you have already made.
    • Do not research your exit on a school device or account. Those belong to your employer. Use your own phone and your own email.

    Free Download · 2-page PDF

    The Leaving Decision Worksheet

    Page one: the six conditions that produce burnout, side by side — the job you have against the job you are considering, with the blanks marking the questions to ask in the interview. Page two: which condition is actually broken, what would have to change for staying to win, the four boring things to do before you resign, and who to talk to first. It returns no score and it is not a screening instrument.

    Download the free PDF

    Free. No email address required. Designed for grades 6–12 educators.

    Where do teachers actually go after burnout?

    Mostly into other jobs in K–12 education. The National Center for Education Statistics runs a Teacher Follow-up Survey that tracks a national sample of teachers into the next school year. The 2021–22 round covered roughly 10,300 current and former teachers, including about 4,100 who had left, with data collected from January to July 2022. Eight percent of public school teachers had left the profession — a rate unchanged since it was last measured a decade earlier.

    Chart of where former public school teachers were working: 39.3 percent in a school or district K-12 job that is not regular classroom teaching, 11.8 percent outside education, 3.6 percent in K-12 outside a school or district, and 2.5 percent in pre-K or postsecondary education.
    Three in ten stay inside K–12 for every one who leaves education altogether.

    Of the former public school teachers who were working, 39.3 percent held a job with a school or district in K–12 education that was not regular classroom teaching. Another 3.6 percent were in K–12 education outside a school or district, and 2.5 percent had moved into pre-K or postsecondary education. Just 11.8 percent were working outside education, military service included.

    That single comparison — roughly three in ten staying inside K–12 for every one who leaves education — is the thing most articles on this keyword get backwards. The standard piece is a list of ten careers for former teachers, heavy on instructional design and corporate training. Those jobs exist and people take them. They are not where most people go.

    The survey does not publish job titles inside that 39 percent, so treat the following as examples rather than as data: instructional coaching, curriculum and assessment work, interventionist and MTSS roles, media and library positions, counseling if you hold or can add the certification, and district-office work in professional learning or scheduling. The honest summary is that the exit most teachers take is lateral, not away — the same building or the same district, a different set of demands.

    Do teachers who leave say the new job is better?

    On most measures yes, but not on the two people worry about most. The same survey asked former teachers who were working to compare their current position with teaching, one aspect at a time. The pattern in the answers is consistent enough to plan around.

    Ranked bar chart of what former teachers said was better in their current position than in teaching: balance of personal life and work 65 percent, autonomy 60, professional prestige 59, manageability of workload 58, advancement 54, general work conditions 50, intellectual challenge 45, salary 38, job security 21.
    The two shortest bars are the price. Salary and job security are where leaving usually costs you.

    Better in the current position: balance of personal life and work, 65 percent. Autonomy or control over their own work, 60 percent. Professional prestige, 59 percent. Manageability of workload, 58 percent. Opportunities for advancement, 54 percent. General work conditions, 50 percent.

    And then the other end. Intellectual challenge, 45 percent. Salary, 38 percent. Job security, 21 percent.

    Read those two low numbers carefully, because they are the price. Roughly three in five former teachers did not say they were making more money. Roughly four in five did not say their new job was more secure. Teaching, for all of it, is a job with tenure structures, a salary schedule you can read years in advance, and a public pension. Very little outside it works that way, and the people who left are telling you so.

    What they are also telling you is that the thing burnout takes from you — hours, control over your own day — is the thing that most reliably comes back. If your honest answer to “what do I want” is my evenings rather than more money, the data is on your side. If it is more money, the data is thinner than the career-change articles suggest.

    Does leaving actually fix burnout?

    Nobody can honestly tell you that it does. This is the most important sentence on this page and it is the one you will not find in a listicle. The burnout literature is enormous, and it is almost entirely about what predicts intending to leave. A 2025 National Academies paper reviewing burnout’s consequences says the research “has most commonly documented a relationship between burnout and… plans to leave their job,” and adds that because most of the underlying studies are neither longitudinal nor randomized, the results are “limited to describing associations.”

    So the field can tell you that burned-out people want out. It is much quieter on whether the ones who got out felt better afterward. Anyone who tells you a career change cures burnout is telling you something the evidence does not currently support.

    What the evidence does support is a reason to be careful about which job you take next. A 2022 review of burnout theory and measurement states the core finding of fifty years of work in one line: burnout is “not a personal problem, but a consequence of certain characteristics of the work activity.” Individual factors moderate it. Organizational factors generate it.

    Follow that through and the implication is uncomfortable. If burnout is produced by unmanageable workload, no control, no recognition, a bad community, unfairness and a values mismatch, then walking those six conditions into a new building does not leave them behind. It relocates them. A district office job with a worse workload than your classroom is not an escape. Neither is a startup that expects sixty hours.

    That is why the framework further down this page is about conditions rather than job titles. A job title tells you almost nothing about whether you will be well in it.

    How many teachers who plan to leave actually leave?

    Far fewer than say they will. Researchers at CALDER followed 7,714 teachers across 35 low-performing Michigan districts from 2018–19 through 2021–22, matching what teachers said on a survey against what they actually did the next year. Of the teachers who reported plans to leave the profession or retire, nearly three-fourths were still in the same school the following year. Of those planning to transfer, about two-thirds stayed put. That is a specific sample — districts already flagged as low-performing, where turnover pressure runs high — so the exact fractions should not be read as a national rate. The direction is the durable part: stated intentions badly overstate actual exits.

    The intention is not meaningless — teachers who said they planned to leave were about three times more likely to do so than teachers who said they planned to stay, 30 percent against 10 percent. But it is a weak predictor in the other direction too: only 46 percent of the teachers who actually left Michigan public education had said beforehand that they planned to.

    Two things follow, and they point in opposite directions on purpose.

    First, if you have been thinking about leaving, you are in enormous and entirely ordinary company, and you have not committed to anything. Most people who sit where you are sitting in March are back in the same room in August. That is not weakness and it is not a failure of nerve. It is what a hard decision looks like while it is being made.

    There is also a third group the numbers do not describe. Plenty of teachers would leave and cannot — a spouse tied to the area, insurance that covers somebody else, a mortgage, a pension eight years out, one district within driving distance. If that is you, an article about jobs after teaching is not much use to you, and the honest thing is to say so rather than pretend the door is open. What is still available is the audit below, run against the job you already have, and the case for holding the line where you are — and asking for one specific condition to change instead of asking for everything to be different.

    Second, and it is worth saying plainly to anyone who manages teachers: a survey that says a third of your staff is leaving is not a prediction that a third of your staff is leaving. It is a measurement of how bad the conditions feel right now. Those are different problems with different answers — and the second one is not the easier problem. A third of a staff reporting that they want out is a serious reading on working conditions whether or not those people go, and it stays serious after they stay.

    How do you test a job before you take it?

    Interview the conditions, not the title. The six features of a job that produce burnout — workload, control, reward, community, fairness and values — are the areas of worklife that Christina Maslach’s research identified, and they are the spine of every page in this series. Because they are features of a job, you can ask about all six directly in an interview, and the answers will tell you more than any description of the role. Here is the audit, in the order it is worth running.

    Six-row checklist of questions to ask about a job before taking it, one for each area of worklife: workload, control, reward, community, fairness and values.
    A job title tells you almost nothing about whether you will be well in it. These six do.
    1. Workload. How many hours does this actually take in the busy season, not the average week? Who did this job last and where are they now? A role nobody has held for more than eighteen months is telling you something.
    2. Control. What decisions are mine without asking? Teaching gives you more autonomy inside four walls than most people realize. Plenty of jobs give you less.
    3. Reward. Past salary — how does anyone here know when I have done well? If the answer is vague, the recognition will be too.
    4. Community. Who would I work with day to day, and do they like each other? Ask whether you can talk to one of them without the hiring manager in the room. If the answer is no, that is data.
    5. Fairness. How are raises, assignments and promotions decided, and is that written down anywhere? “We handle it case by case” is an answer.
    6. Values. What would I be asked to do here that I would be uncomfortable explaining to a student? If nothing comes to mind, good. If something does, believe it.

    You will not get honest answers to all six. You will get honest answers to some, and the pattern of what people dodge is information in itself. Run the same six questions against your current job while you are at it. Sometimes the audit says the problem is one condition, not six, and that one is fixable where you are — which is the case an administrator can be asked to answer before you go anywhere.

    What do the adjacent jobs actually pay?

    About the same as teaching, with the growth and the pay pulling in opposite directions. The Bureau of Labor Statistics puts the median annual wage for high school teachers at $72,040 as of May 2025, with employment projected to show little or no change from 2025 to 2035.

    Instructional coordinators — the curriculum, assessment and professional-learning roles that sit closest to the 39 percent above — had a median of $77,440 in May 2025. That is real money over a career. But the same source projects 2 percent growth over the decade, slower than average, and notes that public school instructional coordinators are required to hold a master’s degree in education or curriculum and instruction and typically need several years of experience as a teacher or instructional leader. It is a promotion-shaped job with few openings.

    Training and development specialists, the most common corporate landing spot, had a median of $69,280 and are projected to grow 11 percent, much faster than average, with a bachelor’s degree typically sufficient to enter.

    Put those together honestly. The adjacent job that pays more than teaching is barely growing and wants credentials you may need to go get. The one that is growing quickly pays less than the classroom median. That is the shape of the trade, and it matches what leavers reported: only 38 percent said the money was better.

    Two practical notes that cost nothing. Keep your certificate current even if you are leaving — renewal is cheap and rebuilding a lapsed license is not. And check what your state retirement system does with a partial year of service before you set a resignation date, because the arithmetic sometimes favors a specific month.

    What should you do next?

    Do the boring, private, reversible things first, in this order.

    Move the search off your employer’s property. Your school email, your district laptop and your school Google account belong to the district, not to you. Applications, resignation drafts and searches for “jobs after teaching” do not belong on any of them. Use your own phone, your own email address, your own machine. This is not paranoia; it is the same advice anyone would give about any employer.

    Write down which of the six conditions is actually broken. Not “I am done.” Which one. A blank reflection page is as much structure as this needs. People who can name it sometimes discover the problem is a schedule or a duty rather than a profession, and that is a much smaller thing to fix. People who name all six have learned something too.

    Talk to an actual person. Someone who left, someone who stayed, and — if what you are carrying is heavier than a job problem — a doctor or a counselor. This page cannot tell you whether you are burned out, and neither can any checklist, quiz or article, including the worksheet below; if you have not yet worked out whether what you are carrying is burnout or an ordinary hard stretch, that is a different question with a different answer. Burnout is an occupational condition described by researchers, not a diagnosis you can give yourself from a web page, and the measurement instruments used to study it do not have clinically validated cutoff scores. If you are wondering whether what you are feeling is something more than exhaustion, that question belongs to a person who can ask you follow-up questions.

    Then decide on your own clock. The people who leave well tend to leave with a destination, a date and their certificate intact. Some people do not get that choice — health, a family emergency, or a situation that has stopped being safe can end a year in March, and none of that is bad planning or a character problem. But when the timing is genuinely yours, the calendar is one of the few parts of this you control. You are allowed to take a year to decide, and the evidence says most teachers in your position do exactly that. You are also allowed to go. Neither one of those is the brave choice and neither one is quitting. Nobody in your building gets a medal for outlasting the job, and nobody should have to.

    One last thing, and it is the part students actually see. Leaving well means leaving the person who follows you something to work with: notice where you can give it, plans and passwords handed over, grades current, a word to the kids who will wonder where you went. Teenagers read how adults exit a room, and they read it accurately. Going is allowed. Disappearing is a different thing, and it is the only version of this that costs somebody else.

    Before you go: grab the free Leaving Decision Worksheet (PDF) — ElevateTheNorm.com branded, printable, no email required, and not a screener.

    Frequently Asked Questions

    Is it normal to think about leaving teaching?

    Yes, and thinking about it is not the same as doing it. Researchers who followed 7,714 teachers across 35 Michigan districts found that nearly three-fourths of those who reported plans to leave the profession or retire were still in the same school the next year. Nationally, 8 percent of public school teachers actually left between 2020-21 and 2021-22, a rate unchanged from a decade earlier. Far more people consider it than go. You have not committed to anything by wondering.

    What jobs do most former teachers actually take?

    Most stay in K-12. Among former public school teachers who were working, 39.3 percent held a job with a school or district in K-12 education that was not regular classroom teaching, while only 11.8 percent had moved outside education entirely. The federal survey does not publish titles inside that 39 percent, but the roles that sit there are things like instructional coaching, curriculum and assessment, intervention and MTSS work, media and library positions, and district-office professional learning. The typical exit is lateral, not away.

    Will I make more money if I leave the classroom?

    Probably not, and the data on this is clearer than most career-change advice admits. Only 38 percent of former teachers said salary was better in their current position than in teaching. For reference, the Bureau of Labor Statistics put the May 2025 median at $72,040 for high school teachers, $77,440 for instructional coordinators, and $69,280 for training and development specialists. The adjacent job that pays more is projected to grow 2 percent over the decade and usually requires a master’s degree plus teaching experience. The one growing quickly pays less than the classroom median.

    Does leaving teaching cure burnout?

    Nobody can honestly promise that. The burnout literature overwhelmingly measures intentions to leave rather than what happens afterward, and a 2025 National Academies review says the underlying studies are mostly neither longitudinal nor randomized, so results are limited to describing associations. What is well established is that burnout comes from conditions of the work rather than from the person, which means a new job carrying the same workload, the same lack of control and the same values mismatch is likely to reproduce it. That is the argument for auditing the conditions of the next job rather than its title.

    Is student behavior the reason teachers burn out and leave?

    No. This one matters, and the answer is not a soft one. Burnout is an occupational condition produced by how a job is structured — workload, control, recognition, community, fairness and values. Those are set by schedules, staffing, policy and budgets, which are adult decisions made by adults. Students are not the cause, and a student who is worried that a favorite teacher is exhausted because of their class is worrying about something that is not theirs to carry.

    Is it bad for students when a teacher leaves?

    Turnover is genuinely disruptive, and it is fair for a family to care about it. But the cause of turnover is working conditions, not articles about working conditions, and a teacher grinding through exhaustion for another two years is not a good outcome for students either. The thing that protects students is a teacher who either gets the conditions fixed or leaves well — with notice, with plans and grades handed over, and with a word to the kids about where they went. The version that costs students is the one where an adult disappears without any of that.

    How do I know if I am burned out or just tired?

    You cannot settle that from a web page, and this one will not pretend otherwise. The instruments researchers use to study burnout do not have clinically validated cutoff scores, so no checklist, quiz or article — including the worksheet on this page — can return a verdict. What a page can do is describe what the three symptoms look like in a classroom so you have better words for it. If what you are carrying feels heavier than a job problem, or has lasted past the breaks that usually help, that question belongs to a doctor or a counselor who can ask you follow-up questions.

    Can I use my school computer to apply for other jobs?

    Don’t. Your school email address, your district laptop and your school-issued accounts belong to your employer, and in most districts the acceptable-use policy says so explicitly. Job applications, resignation drafts, and searches about leaving should live on your own phone, your own machine and a personal email address. This is not about hiding wrongdoing — there isn’t any — it is the same basic advice anyone would give about any employer.

    Sources

    Every link above was opened and read on September 24, 2026. Where a figure could not be confirmed in the source document itself, it is not quoted here. This article describes burnout as an occupational condition. It is not medical advice, it is not a diagnosis, and neither this page nor the linked worksheet is a screening instrument. Nothing here is financial, legal or career advice about your particular situation — retirement and certification rules vary by state, and those questions belong to your own retirement system and certification office.


    About Clay Shumate

    By Clay Shumate — Clay Shumate is a certified secondary Social Studies teacher in the public schools of West Alabama, with seven years of classroom experience, a B.A. in History, and an M.Ed. in Secondary Education. He writes about project-based learning, student responsibility, respect, and practical ways to hold young people to a higher standard while giving them room to learn from mistakes. He is a member of the Society of Professional Journalists and writes to its Code of Ethics; this site’s editorial standards and corrections policy are published in full.

Teacher Emergency Toolkit — practical resources, real classroom support. Shop on TPT.Teacher Emergency Toolkit — practical resources, real classroom support. Shop on TPT.