Author: Clay Shumate

  • Teacher Reflection Journal: What to Write, How Often, and What to Skip

    Teacher Reflection Journal: What to Write, How Often, and What to Skip

    By Clay Shumate

    A teacher reflection journal is a running written record of what you tried in the classroom, what happened, and what you decided to do differently. It is not a diary and it is not a feelings log. Its value is not in any single entry — it is in what twenty entries show you about your own teaching that no single lesson ever could.

    That is the whole case for keeping one, and it is a narrower case than most professional development sells you. The evidence that reflective writing changes teaching is thinner than the enthusiasm for it. What follows is the honest version: what a teacher reflection journal is good for, what it is not, and a ten-minute routine that survives past October.

    Key Takeaways

    • The pattern is the product. One entry tells you about one lesson. Fifteen entries tell you that third period falls apart every time you open with silent reading, which is a thing you would never have noticed on a Tuesday.
    • Most reflective writing never gets past description. In a 2024 study of 198 reflective texts, exactly one reached a critical level. Writing it down is not the same as thinking about it.
    • The evidence is real but modest, and mostly indirect. Nobody has shown that journaling by itself raises student achievement. What the research supports is feedback and reflection as one ingredient inside sustained, content-focused professional learning.
    • Ten minutes a week beats forty minutes in August. Teachers already work about 49 hours a week. A journal that costs more than ten minutes will be the first thing you drop.
    • Write for the version of you that reads it in March. Not for an evaluator, not for a supervisor, and not for posterity.

    What Is a Teacher Reflection Journal?

    A teacher reflection journal is a dated, ongoing record in which a teacher writes down a specific thing that happened in their classroom, what they think caused it, and what they intend to change. Three parts. Take away the specific event and you have a mood ring. Take away the intended change and you have a diary.

    The word “journal” does a lot of damage here, because it imports the wrong picture — leather cover, evening, a cup of tea, long paragraphs about your calling. A teacher reflection journal is closer to a maintenance log. A mechanic writes down the noise, the suspected cause, and the part they replaced. You are doing the same thing with a fourth-period lesson.

    It is also worth separating the journal from two neighbors. It is not an individual reflection, though it is made of them — a reflection is one unit of thinking, a journal is the container that keeps them next to each other. And it is not an evaluation artifact, even though entries can feed one. The moment a journal exists to be read by an administrator, it stops being a place where you can write “I lost the room and I know exactly why.”

    What Does a Journal Give You That a One-Off Reflection Doesn’t?

    Patterns. That is the short answer, and it is the only thing a journal does that a good conversation in the hallway cannot.

    Any teacher can tell you what went wrong in the lesson they just taught. That is not hard, and it does not need writing down. What is genuinely hard — what memory is actively bad at — is noticing that the same thing has gone wrong eleven times since September, always on the same day of the week, always with the same kind of task. Human memory reconstructs. It keeps the vivid and drops the routine, which means the slow, boring, recurring failure is precisely the one you will never recall unprompted.

    A dated record does not have this problem. In February you can read October. Three things tend to show up when teachers actually do this:

    • Recurring conditions. The same period, the same day, the same task structure, the same twenty minutes of the block.
    • Your own repeated fixes. You will find that you have written “I need to model this first” six times and modeled it twice. That gap is more useful than any single entry.
    • What actually stuck. A change you made in September and forgot you made, still running in January because it worked.

    None of that requires deep insight in the moment. It requires the entries to exist and to be dated. That is a lower bar than “reflect critically,” and it is the bar most teachers can actually clear in a working week.

    Does Keeping a Teacher Reflection Journal Actually Work?

    The honest answer: the evidence supports reflection as part of a larger structure, and it does not support journaling on its own as a lever on student achievement. Anyone telling you otherwise is selling a notebook.

    Start with the most uncomfortable finding. A 2024 mixed-methods study by Michaela Gläser-Zikuda and colleagues analyzed 198 reflective texts written by 100 pre-service teachers, coded against Hatton and Smith’s four levels of reflection. Thirty-seven were purely descriptive. One hundred twenty-nine were descriptive-reflective. Thirty-one reached a dialogic level. One reached critical reflection.1 Those were novices writing for a course, which is not the same population as a working secondary teacher writing for themselves — but the direction is clear enough. Left alone, reflective writing defaults to retelling.

    Elizabeth Jaeger reviewed the field and reached a similar place from a different angle. Journal writing, she notes, is “the most frequently used means of professional reflection in teacher education,” and yet “gaps in the research make it difficult to claim that reflection is a transferrable skill… and that it will produce the desired result of improved student learning.” Her specific complaint about journals is that they run “too confessional in tone” rather than staying on teaching behavior and decisions.2 That is a fixable problem, and most of the practical advice below is aimed at it.

    There is a harsher version in the literature too. Pariwat Suphasri and Sumalee Chinokul, reviewing reflective practice in teacher education, describe journals that become “recipe-following” compliance — teachers who “focus on the quantity of the written journals rather than the quality,” writing “long, simple descriptions of classroom routines,” and some who “fake their reflection in order to get approval from their supervisors.”3 If your district has ever mandated reflection logs, you have seen this happen in real time.

    So where is the support? It is structural rather than direct. The Learning Policy Institute’s review of 35 methodologically rigorous professional development studies — studies with experimental or comparison-group designs — found seven shared features of PD that moved student outcomes. One of them is “offers feedback and reflection.” The others are content focus, active learning, collaboration, models of effective practice, coaching and expert support, and sustained duration.4 The authors are careful to say what that does and does not mean: because these studies evaluate whole programs, the review “cannot assess individual component effectiveness.” Reflection is in the recipe. Nobody has weighed it separately.

    The nearest thing to a clean number comes from coaching, which is reflection with another adult in the room. Matthew Kraft, David Blazar and Dylan Hogan’s meta-analysis of 60 causal studies found pooled effects of 0.49 standard deviations on instructional practice and 0.18 on student achievement — and, importantly, those effects shrank badly at scale, to 0.34 and 0.10 in programs with 100 or more teachers.5 That is worth holding onto for two reasons. It shows structured reflection with feedback does move practice. And it shows the effect is fragile enough that a district rollout can wring most of it out.

    A journal is the cheapest, weakest version of that structure. It is one person, no feedback, no expert. Expect it to do proportionally less, and it will still be worth ten minutes.

    What Goes In a Single Entry?

    Four lines: the event, the evidence, the likely cause, and the one change. If an entry has all four, it is doing its job. If it has three, it is probably missing the change, and an entry with no decision in it is a paragraph about your day.
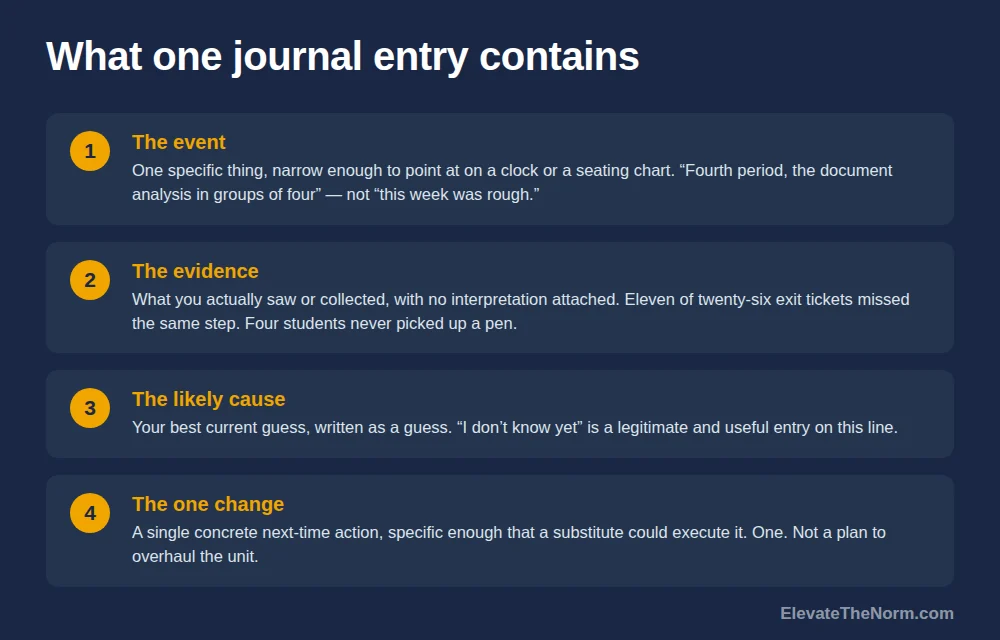
    Numbered graphic showing the four parts of a teacher reflection journal entry: the event, the evidence, the likely cause, and the one change, each with a short explanation
    Four lines. An entry missing the last one is a paragraph about your day.

    Here is what each line is actually asking for.

    The event is one specific thing, not a summary of the week. “Fourth period, the document analysis in groups of four” is an event. So is “the lab write-up, second block, the twelve minutes after I handed back the rubric.” “This week was rough” is not. Narrow it until you could point at it on a seating chart or a clock.

    The evidence is what you actually saw or collected, stated without interpretation. Eleven of twenty-six exit tickets missed the same step. Four students never picked up a pen. The room went quiet at minute six and never came back. This is the line teachers skip most often, and skipping it is how a journal turns into a mood log. Interpretation without evidence is just how you felt at 2:40.

    The likely cause is your best current guess, written as a guess. “Probably because I gave the directions once, orally, while they were still unpacking” is honest. So is “I don’t know yet.” Writing down that you do not know is genuinely useful — it is the entry you come back to when the same thing happens again and the cause becomes obvious.

    The one change is a single, concrete, next-time action. One. Not a plan to overhaul the unit. “Next time, written directions on the board and one student restates them before anyone moves” is a change. “Be clearer” is a wish.

    That is the whole format. Four lines, and the last one is the only one that is non-negotiable, because a journal full of observations with no decisions attached is the exact confessional drift Jaeger warns about.2 If you want a longer worked set of entries written out in full, the companion guide collects seven of them, including the awkward ones.

    How Often Should You Write In It?

    Once a week, at a fixed time, for about ten minutes. Daily is a trap and monthly is not a journal.

    The argument for weekly is arithmetic, not philosophy. RAND’s 2025 State of the American Teacher survey found teachers reporting an average of 49 hours of work per week — about ten hours beyond what they are contracted for — while remaining more likely than comparable working adults to report poor well-being on every indicator measured.6 Any professional habit that assumes you have spare capacity is a habit that will not survive a bad October.

    Weekly also happens to be the right grain for the thing a journal is actually for. Daily entries produce volume, and volume is the documented failure mode — long descriptions of routine, written to prove the log was kept.3 Weekly forces selection. You have to pick the one thing from five days that was worth writing about, and the picking is itself a piece of thinking.

    Two practical notes. Put it on the calendar at a specific time, not “Fridays.” Last twelve minutes of your planning period on Friday, or the ten minutes before you leave the building. And write in the building, not at home. An entry written from your couch four hours later has already lost the evidence line.

    One exception is worth making. When something big happens — a lesson that genuinely failed, a conflict with a student you handled badly, an assessment whose results blindsided you — write it that day, while you still have the details. Those entries are the ones you will reread.

    Paper, Document, or Phone — What Format Actually Survives?

    The one you will still be using in March. That is not a dodge; the format question is almost entirely a friction question, and the trade-offs are real.
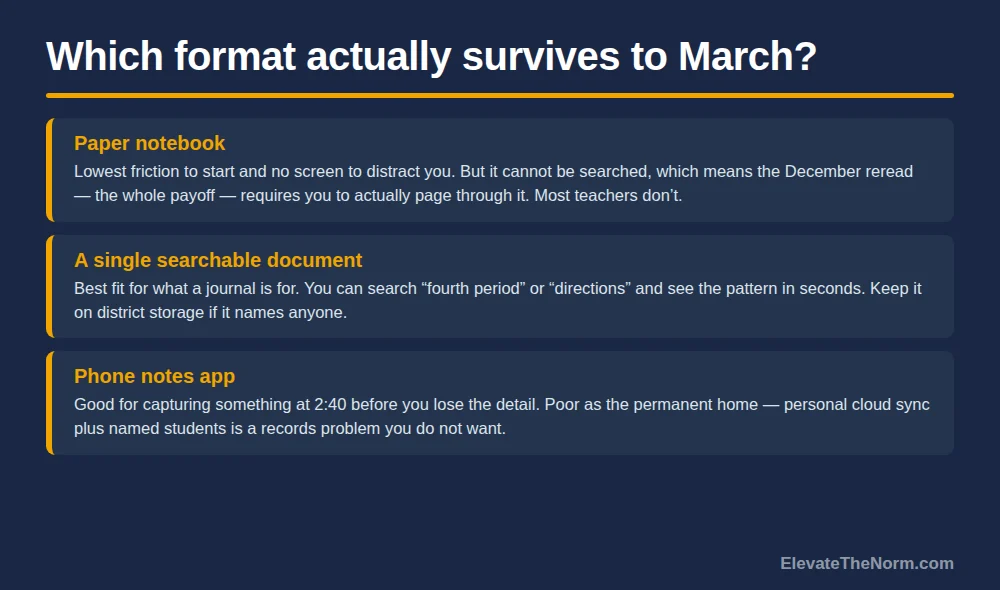
    Comparison graphic of three teacher reflection journal formats - a paper notebook, a single searchable document, and a phone notes app - listing the trade-offs of each
    Searchability is the whole argument. A pattern you cannot find is a pattern you do not have.

    A few things worth knowing before you pick.

    Searchability matters more than it sounds like it does. The entire payoff of a journal is finding the pattern, and finding a pattern in a paper notebook means rereading it. Realistically, you will not. A document you can search for “fourth period” or “directions” turns a stack of entries into something you can actually interrogate.

    Student names change what the document legally is. Under federal law, a teacher’s private notes fall outside the definition of an “education record” only if they meet all three conditions in 34 CFR 99.3: records “kept in the sole possession of the maker, are used only as a personal memory aid, and are not accessible or revealed to any other person except a temporary substitute for the maker of the record.”7 Share one entry with a colleague, a coach or an administrator and that entry has arguably left the exception. This is not a reason to panic, and it is not legal advice — check your district’s records policy, because districts routinely set stricter rules than the federal floor. It is a reason to do the simple thing: keep student names out. “A student in third period” carries every bit of the meaning you need, and a journal written that way can be shared, quoted in a coaching conversation, or left open on your desk without a second thought.

    Decide up front who can read it. If the answer is “only me,” the journal can be honest. If the answer is “me and my evaluator,” it will quietly become a performance document, and the research on that is not ambiguous.3 There is nothing wrong with keeping a second, shorter record for evaluation purposes. There is a lot wrong with pretending one file can be both.

    A Ten-Minute Weekly Routine That Survives October

    Five steps, in order, once a week. The order matters more than the timing: evidence before interpretation, and one decision at the end.

    Five-step graphic of a ten-minute weekly teacher reflection journal routine, running from picking one thing through writing evidence, guessing the cause, naming one change, and looking back four entries
    Ten minutes, once a week, in the building. Step five is the one people skip.
    1. Minute 1 — Pick one thing. Scan the week and choose a single lesson, moment or result. Prefer the one you have been avoiding thinking about.
    2. Minutes 2–4 — Write the evidence first. What you saw, counted, or collected. No causes yet. Numbers if you have them: how many exit tickets, how many students, what minute it turned.
    3. Minutes 5–7 — Guess at the cause, in writing. Then ask one follow-up of your own guess: what would I expect to see if that were true? This single question is what moves an entry off the description level.
    4. Minutes 8–9 — Write one change. Concrete enough that a substitute could execute it. If you cannot make it that concrete, the change is really a question, so write it as one.
    5. Minute 10 — Look back four entries. Not the whole journal. Four. Ask whether this week’s entry rhymes with any of them, and if it does, note that at the top.

    Step five is the one people skip, and it is the step that converts a pile of entries into a journal. Four entries back is roughly a month. A month is long enough for a pattern to show and short enough to reread in ninety seconds.

    If you would rather work from a prepared format than build your own, the site’s free teacher reflection journal and template pack is a printable version of this same structure — no email required, no form to fill in.

    What Do You Do With a Term’s Worth of Entries?

    Read them in one sitting, twice a year, with a pen. December and May are the natural windows. The reading is the point of the writing.

    Give it forty minutes and do three passes.

    First pass — circle repeats. Any condition that shows up three or more times. A period, a day, a task type, a transition, a time of the block. Do not interpret yet, just mark.

    Second pass — find the promises you did not keep. Read only the “one change” lines. Which ones did you actually do? The gap between what you decided and what you implemented is usually the single most useful thing in the whole document, and it is invisible week to week.

    Third pass — write one page forward. Not a reflection on the term. A short list of what you are carrying into the next one: two changes that worked and are now permanent, one recurring problem you have decided to actually solve, one thing you are going to ask someone for help with.

    If you are the coach or the administrator rather than the teacher, the useful move here is narrow: ask to hear about one entry the teacher chooses, and ask the follow-up question rather than the evaluative one — what would you expect to see if that guess were right? What does not work is asking to read the journal. A journal you can be asked to produce is a journal nobody writes honestly in, and the fastest way to kill the practice across a building is to require it.

    That last item is where a journal stops being a solitary exercise, which is the thing Jaeger flags as a core weakness of reflective practice — reflection that stays isolated tends not to go anywhere.2 The coaching evidence points the same direction: the versions of reflection with the strongest causal support are the ones with another adult involved.5 Bring one entry to a colleague. Bring one to your instructional coach if you have one. A journal is a good place to think and a bad place to stay.

    Three Ways a Teacher Reflection Journal Goes Wrong

    It turns confessional. Entries drift from teaching decisions to how you felt about the day, and eventually to how you feel about the job. This is the documented failure — Jaeger names the confessional tone directly as the problem with journals in practice.2 There is a second version of this drift that is worse, and it is worth naming: the journal quietly becomes a file of complaints about teenagers. If your entries are mostly a record of what students did to you, the document has inverted — a reflection journal is a record of your decisions, and the students in it are conditions you are responding to, not defendants. The fix for both versions is mechanical: if an entry has no evidence line and no change line, it is not an entry. Feeling terrible about fourth period is real and worth taking seriously; it is just not what this document is for. If the journal keeps pulling that direction week after week, that is information about workload and burnout, not about the lesson.

    It becomes compliance. Someone requires it, so it gets written for them. The reviewed literature is blunt about what happens next — volume over quality, descriptions of routine, and in some cases reflection written to secure approval rather than to figure anything out.3 If your journal is mandated, keep a private one anyway. The mandated one is a work product. The private one is the one that is any use to you.

    It never gets reread. This is the quiet one, and it is the most common. The entries are fine, the cadence holds, and nobody ever opens the file again. A journal that is only ever written is a very slow way of doing nothing. If you are going to skip something, skip an entry — never skip the December reading.

    Where to Start This Week

    Open one document. Title it with the school year. Put next Friday on your calendar with twelve minutes blocked and the word journal on it.

    Then write one entry, four lines, about something that already happened this week: the event, what you actually saw, your best guess at why, and one thing you will do differently. Do not try to make it good. The first twenty entries are not the product — they are the raw material for the forty minutes in December that will actually tell you something about your teaching.

    That is a modest promise, and it is the one the evidence will support. A journal will not raise your test scores. It will make you harder to fool about your own classroom, which is worth more over a career than most of what gets called professional development. The closest student-side analogue is student self assessment — criteria, evidence, gap, action — and it works for the same unglamorous reason: you cannot fix what you have not looked at squarely.

    Frequently Asked Questions

    Can my principal require me to hand over my reflection journal?

    Check your district policy and your contract, because this varies and this is not legal advice. What is worth knowing is that under federal law a teacher’s private notes sit outside the definition of an education record only when they are kept in the sole possession of the maker, used only as a personal memory aid, and not revealed to anyone except a temporary substitute (34 CFR 99.3). The practical answer is simpler than the legal one: keep student names out of the journal and the question mostly stops mattering. If your school mandates a reflection log, treat that as a separate work product and keep your own journal alongside it.

    Do parents have a right to see what I wrote about their child?

    If the entry names or identifies a student and you have shared it with anyone else, it may no longer qualify as a sole-possession record, and your district’s records policy takes over. The cleaner practice is to write “a student in third period” rather than a name. You lose nothing — you are writing about your own instructional decisions, not building a file on a teenager — and you avoid the whole question.

    How is this different from the reflection I already write for my evaluation?

    Audience, and it changes everything. An evaluation reflection is written to be read by someone who rates you, so it tends toward the defensible. A journal is written for the version of you who reads it in March, so it can say “I lost the room and I know exactly why.” There is nothing wrong with keeping both. There is a lot wrong with pretending one file can do both jobs.

    I have tried journaling before and quit by October. What should I do differently?

    Three things. Make it weekly rather than daily — volume is the documented failure mode, not the goal. Put it on the calendar at a specific time in the building, not at home. And cap it at ten minutes with a timer. Most abandoned journals were abandoned because they were designed for a version of the job that has more free time in it than the real one does.

    Does a teacher reflection journal actually improve student learning?

    There is no good evidence that journaling on its own moves student achievement, and you should be skeptical of anyone who tells you otherwise. Reviews of reflective practice describe the research base as thin, and reflective writing left unstructured mostly stays descriptive. What the research does support is reflection and feedback as one feature of sustained professional learning, and structured reflection with another adult — coaching — which shows pooled effects of about 0.49 SD on instructional practice and 0.18 SD on achievement, shrinking substantially at scale.

    What should a coach or administrator do with this?

    Ask about one entry the teacher chooses, and ask the follow-up question rather than the evaluative one: what would you expect to see if that guess were right? Do not ask to read the journal, and do not mandate it building-wide. Mandated reflection reliably produces compliance writing — long descriptions of routine, written for approval rather than for figuring anything out.

    Should I write about specific students or only about lessons?

    Write about your decisions. Students appear in a good entry as conditions you were responding to — four students never picked up a pen, eleven exit tickets missed the same step — not as subjects of a running file. If your entries are mostly a record of what teenagers did to you, the document has inverted, and it has stopped being useful for the thing it is for.

    Handwriting or typing — does it matter?

    Only in terms of whether you will still be doing it in March, with one real exception: you cannot search a notebook. The entire payoff of a journal is finding a pattern across months, and finding it in paper means rereading the whole thing, which almost nobody does. Start on paper if that is what gets you writing, but plan to end up somewhere searchable.

    Sources

    1. Gläser-Zikuda, Michaela, Chaoran Zhang, Florian Hofmann, Lisa Plößl, Lea Pösse, and Michaela Artmann. “Mixed methods research on reflective writing in teacher education.” Frontiers in Psychology, vol. 15, art. 1394641, 2024. https://pmc.ncbi.nlm.nih.gov/articles/PMC11496957
    2. Jaeger, Elizabeth L. “Teacher Reflection: Supports, Barriers, and Results.” Issues in Teacher Education, vol. 22, no. 1, Spring 2013, pp. 89–104. https://files.eric.ed.gov/fulltext/EJ1014037.pdf
    3. Suphasri, Pariwat, and Sumalee Chinokul. “Reflective Practice in Teacher Education: Issues, Challenges, and Considerations.” PASAA, vol. 62, 2021, pp. 237–264. https://files.eric.ed.gov/fulltext/EJ1334998.pdf
    4. Darling-Hammond, Linda, Maria E. Hyler, and Madelyn Gardner. Effective Teacher Professional Development. Learning Policy Institute, June 2017. ERIC ED606743. https://files.eric.ed.gov/fulltext/ED606743.pdf
    5. Kraft, Matthew A., David Blazar, and Dylan Hogan. “The Effect of Teacher Coaching on Instruction and Achievement: A Meta-Analysis of the Causal Evidence.” Review of Educational Research, vol. 88, no. 4, 2018, pp. 547–588. Full text (University of Maryland)
    6. Steiner, Elizabeth D., Phoebe Rose Levine, Sy Doan, and Ashley Woo. Teacher Well-Being, Pay, and Intentions to Leave in 2025: Findings from the State of the American Teacher Survey. RAND Corporation, RR-A1108-16, June 2025. https://www.rand.org/pubs/research_reports/RRA1108-16.html
    7. U.S. Code of Federal Regulations. “Education records” definition, 34 CFR § 99.3 (Family Educational Rights and Privacy Act). https://www.ecfr.gov/current/title-34/subtitle-A/part-99/subpart-A/section-99.3
    About Clay Shumate

    Clay Shumate is a certified secondary Social Studies teacher in the public schools of West Alabama, with seven years of classroom experience, a B.A. in History, and an M.Ed. in Secondary Education. He writes about project-based learning, student responsibility, respect, and practical ways to hold young people to a higher standard while giving them room to learn from mistakes. He is a member of the Society of Professional Journalists and writes to its Code of Ethics; this site’s editorial standards and corrections policy are published in full. More about Clay.

  • Teacher Burnout Quiz: What a Score Can Tell You, and What It Can’t

    Teacher Burnout Quiz: What a Score Can Tell You, and What It Can’t

    By Clay Shumate

    No online teacher burnout quiz can tell you whether you have burnout. The best-known instrument in the field, the Maslach Burnout Inventory, removed its cut-off scores in 2016 because they had no diagnostic validity, and its publisher says outright that it is not a clinical diagnostic tool. What is worth doing instead is describing the job rather than scoring yourself.

    If you typed the question at eleven at night and wanted a number, that is a reasonable thing to want. A number feels like permission. The problem is not that you wanted one — it is that nobody has built one that works on a person.

    This page is about the instruments. For the word itself, start with what the word covers, and the three dimensions every instrument is trying to catch; for what the three symptoms look like in a 6–12 room, the symptom picture, described rather than scored. What follows is the measurement question, and it ends in a reflection sheet that returns no score on purpose.

    Key takeaways

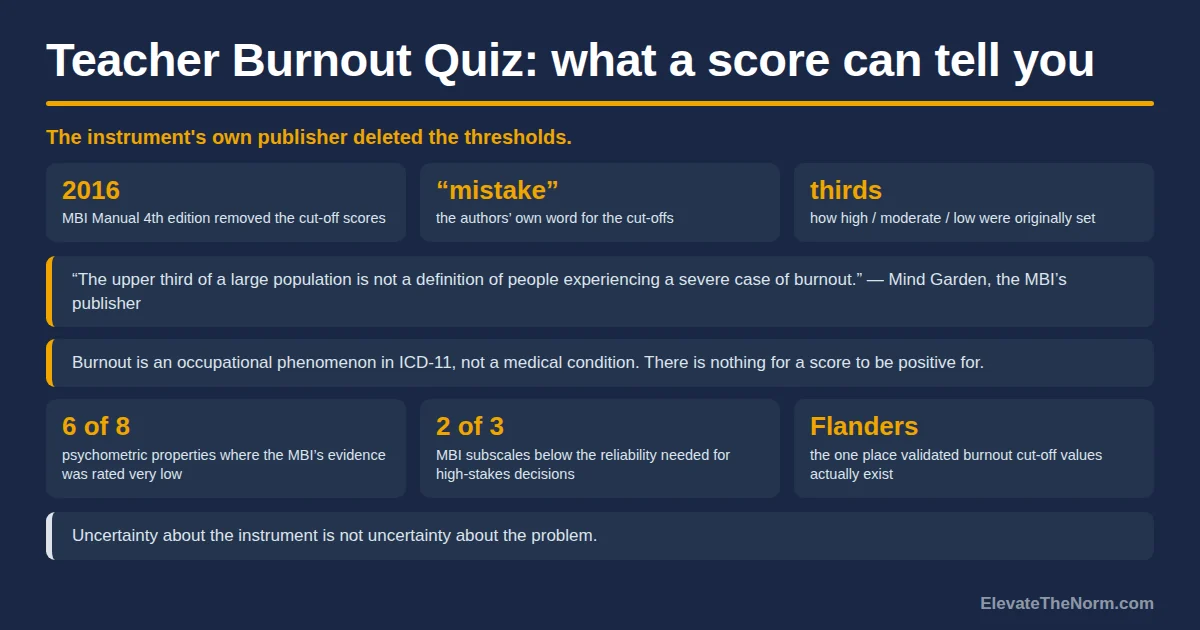
    • The Maslach Burnout Inventory deleted its cut-off scores in 2016. Its publisher says they went “due to having no diagnostic validity” and that the authors came to see them as a mistake.
    • The original “high / moderate / low” labels were population thirds. You were “high” in exhaustion if you landed in the top third of a sample. A third of any group is in the top third.
    • Burnout is not a medical diagnosis. The World Health Organization calls it an occupational phenomenon rather than a condition, so there is nothing for a score to be positive for.
    • Measurement is not hopeless. Cut-offs do exist for one newer instrument — validated on Belgian workers, not American teachers.
    • Uncertainty about the measure is not uncertainty about the problem. A weak instrument is no evidence that nothing is wrong.
    • A self-report survey hears least from the staff with least security. Anyone whose renewal is a live question answers their employer carefully.
    • Use five questions about the job instead. No rating scale, no total, no names. It ends with one sentence and one person to ask, not a result.
    Free download

    The Teacher Burnout Job Check

    Two printable pages. Page one is the five write-in questions — load, control, recovery, support and direction — with room to answer in sentences and a boxed rule about what never goes on it. Page two is how to read the five answers together, the one sentence and one name they are supposed to produce, and the two rules for any school thinking about handing these out. It is not a screening instrument, there is nothing to add up, and it returns no score. Free. No email address required. Designed for grades 6–12.

    Download the free PDF

    Is there a real teacher burnout quiz?

    Yes. It runs to 22 questions, it costs money, and it will not tell you whether you have burnout.

    The instrument teachers are looking for is the Maslach Burnout Inventory — Educators Survey, the version written for people who work in schools. Twenty-two items, ten to fifteen minutes, sold by Mind Garden — $20 for a self-report version, $50 for the manual, $2.75 a head to administer it with a fifty-person minimum.

    So the free quiz you found is not the MBI. It cannot be. What it usually is instead is somebody’s paraphrase of the MBI’s items with a scoring rule bolted on, and the scoring rule is the invented part.

    Then there is what the publisher says about its own product. Mind Garden’s page states that the MBI “is a research measure… but it is not a clinical diagnostic tool,” developed “to assess burnout as a continuum.” A continuum has no line on it that you cross.

    Why did the Maslach Burnout Inventory remove its cut-off scores?

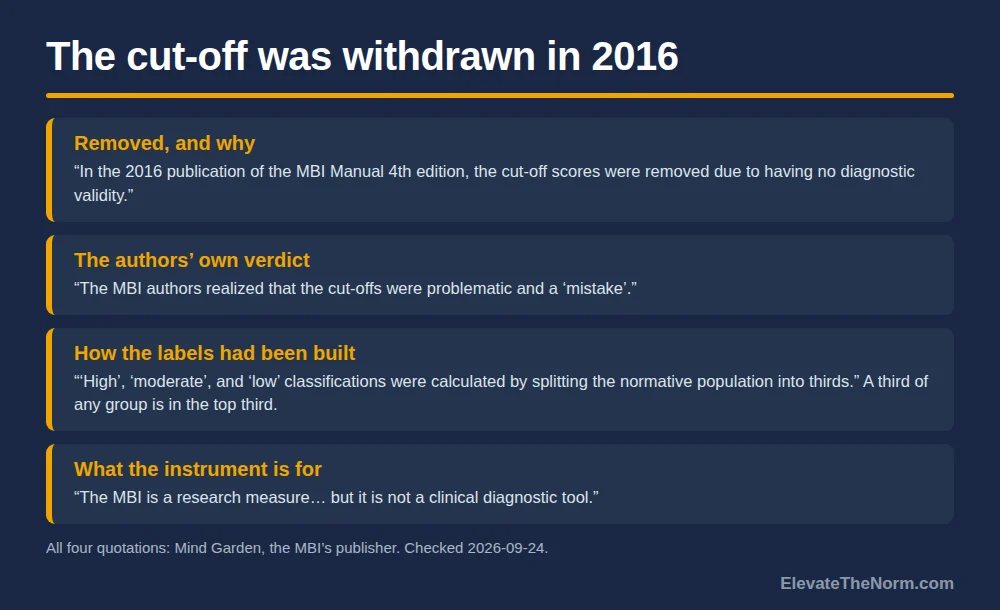
    Graphic headed The cut-off was withdrawn in 2016, summarising what the Maslach Burnout Inventory's publisher says about cut-off scores: that they were removed from the 2016 MBI Manual fourth edition due to having no diagnostic validity, that the authors came to regard them as a mistake, that high moderate and low were calculated by splitting a normative population into thirds, and that the MBI is a research measure and not a clinical diagnostic tool.
    The publisher’s own account of why the thresholds went. Source: Mind Garden, Cut-Off Scores for the Maslach Burnout Inventory.

    Because the people who built it decided the cut-offs were a mistake.

    Mind Garden publishes a short document about it, worth reading in the publisher’s own words. “In the 2016 publication of the MBI Manual 4th edition, the cut-off scores were removed due to having no diagnostic validity” — and “the MBI authors realized that the cut-offs were problematic and a ‘mistake’.”

    Here is how the original categories were built. “‘High’, ‘moderate’, and ‘low’ classifications were calculated by splitting the normative population into thirds — where a person was considered ‘high’ in emotional exhaustion simply because they scored in the upper third percentile of the population.” Then the line that should end the argument: “The upper third of a large population is not a definition of people experiencing a severe case of burnout.”

    Read it as arithmetic and it gets clearer. A third of any group is in the top third of that group. Score a thousand teachers, label the top third “high burnout,” and you will label a third of them every time — in a brutal year and in a good one. The label tells you where somebody sits in a queue, not whether anything is wrong.

    That is the machinery underneath most burnout quizzes online: a convenience the instrument’s own authors withdrew a decade ago, kept anyway.

    How well can burnout be measured at all?

    Graphic headed What the measurement research found, with four rows: a 2021 COSMIN review of nineteen studies and five instruments rated the Maslach Burnout Inventory very low quality of evidence on six of eight psychometric properties despite having the most validation studies; the same review reported that the absence of an accepted diagnostic standard prevented any sensitivity or specificity being calculated; a meta-analysis of 221 studies found depersonalisation and personal accomplishment reliabilities well below levels recommended for high-stakes decisions; and cut-off scores do exist for the newer Burnout Assessment Tool but only for Flanders.
    Four findings, including the one that cuts the other way. Sources: Shoman et al. 2021; Wheeler et al. 2011; BAT Manual 2.0.

    Better than nothing, worse than you would hope, and not well enough to draw a line.

    The most systematic answer is a 2021 review in Epidemiology and Psychiatric Sciences that put five burnout instruments through COSMIN, a standard framework for rating measurement quality. The MBI had more validation studies behind it than any of the others and still came out with “very low quality of evidence on validity for six psychometric properties out of eight.” Only the Copenhagen and, less so, the Oldenburg inventory met the reviewers’ bar for valid medical use.

    The same review explains why no quiz can honestly claim a threshold: “the absence of an accepted diagnostic standard precluded measuring sensitivity and specificity” for any of them. You cannot work out how often a test catches the thing, or cries wolf, when there is no agreed definition to check it against.

    A second problem sits inside the MBI itself. A meta-analysis of 221 studies, 84 supplying usable reliability figures, found emotional exhaustion holding up reasonably well while the other two subscales did not: depersonalization and personal accomplishment were “well below recommended levels for high-stakes decisions, such as the diagnosis of burnout syndrome.” Two of the three scores a quiz hands back are the least reliable two.

    One warning about how to read that. Uncertainty about the instrument is not uncertainty about the problem. Nothing here says teachers are fine, and none of it is a reason to answer a teacher who says the job has become unmanageable with a note about psychometrics. Correcting a measurement is not answering a complaint. For the size of the thing rather than the quality of the ruler, the same question asked of the national numbers.

    So does any burnout score mean anything?

    Yes, and this is the part a debunk usually skips.

    In 2001 a team led by Wilmar Schaufeli tested the MBI on people who had actually sought psychological treatment, rather than on working adults well enough to be at work: 71 employees with work-related neurasthenia under ICD-10 criteria against 68 without. The three-factor structure held up, burnout was partly distinguishable from anxiety and depression, and two of the three scales — emotional exhaustion and depersonalization — discriminated between the groups. It measures something real, and it tracks a clinical distinction.

    Cut-off scores exist too, for a newer instrument. The Burnout Assessment Tool’s manual reports norms against the Flemish and Dutch workforce, representative samples of 1,500 each, and states that “based on a group that suffers from serious burnout cut-off scores have been calculated. To date, such cut-off values are only available for Flanders.”

    So the honest summary is narrower than either headline. Burnout can be measured, and for one instrument, in one region of Belgium, there are cut-offs built on a clinical sample. None of that describes a free web page scoring an American teacher against a threshold nobody validated here. The BAT norms are Belgian and Dutch workers across all occupations, not teachers. And the 2001 sample was people already in treatment — the opposite end of the pipeline from somebody searching at eleven at night.

    Is burnout even a diagnosis?

    No, and that is not a technicality.

    The World Health Organization includes burn-out in ICD-11, but under “Factors influencing health status or contact with health services,” and states plainly that it is not classified as a medical condition. Its definition names the three dimensions the research uses: “feelings of energy depletion or exhaustion,” “increased mental distance from one’s job, or feelings of negativism or cynicism,” and “reduced professional efficacy.” It also “should not be applied to describe experiences in other areas of life.” It is a relationship with a job.

    Two things follow. When a quiz reports “you have moderate burnout,” it is borrowing the grammar of diagnosis for something that is not one — there is no condition to be positive for, so nothing for the result to be right or wrong about. And the things nearby that are diagnosable — depression, anxiety, a thyroid problem, sustained sleep loss — get diagnosed by a person who can ask you a follow-up question. The overlap with depression in particular is real and unsettled, and the symptom page goes through what is and is not distinguishable.

    What to use instead: five questions about the job

    Graphic headed Five questions about the job, listing load, control, recovery, support and direction as write-in prompts, followed by four rules: no rating scale and nothing to add up; question five compares the job to itself rather than you to other teachers; no student or colleague names on the sheet; and keep it on paper rather than a district device. A closing note states that the output is one sentence and one name, not a score.
    The sheet is a job description, not a self-rating. There is nothing on it to total up.

    Stop measuring yourself and start describing the job.

    That switch is not a way of dodging the question you came with. It is that between you and the job, the job is the part that can change. Every instrument above tries to detect a state inside a person; the research keeps pointing at the position instead — the demands loaded onto it, the resources attached to it. That is the Job Demands–Resources frame, and it makes the useful exercise a job description rather than a self-rating. Five questions, answered in sentences rather than scores.

    • Load. What is on my plate this year that was not on it last year?
    • Control. Which of those did I choose?
    • Recovery. In a normal week, when am I off the clock and actually off?
    • Support. Who do I ask when something goes wrong, and did I ask them this month?
    • Direction. Is this heavier, lighter, or about the same as three months ago?

    Four rules are the difference between this and a quiz.

    • No rating scale and no total. No one to five, no counting, no “if you answered yes to three.” Everything above about invented cut-offs applies to one you invent for yourself at the kitchen table.
    • Question five is the only comparison, and it compares the job to itself — not you to other teachers. Direction is the honest version of what a score was pretending to give you.
    • No names on it. Not a student’s and not a colleague’s; describe the situation. A sheet with a student’s name on it stops being private reflection and becomes a record about a child.
    • Paper, and off the district network. A work device is not a private place to write down that you are not coping.

    You should end with two things: one sentence describing the job, and the name of one person who could change one item on it. That is the output — not a number, not a category, not a verdict on whether you are the kind of teacher who copes. For which of your answers is even addressable, which items on that list somebody with a title can actually lift; to write it somewhere built for it, a blank page built for exactly this kind of writing.

    Question four most often has a fixable answer, and it is the one worth taking to a coach or a department chair, because knowing who to ask is learnable rather than a personality trait. But keep the categories straight: a coaching cycle offered in place of removing an item from question one will be read as exactly that. And take one item to that person, not the sheet — a completed sheet handed across a desk reads as the opening of a grievance, which is not what you were doing.

    If the honest answer to question four is that there is nobody — you are the only person teaching your course, the chair is the problem, the building is between principals — write the item down anyway. A written description of the job is what you need for every conversation after this one, including the one about whether to stay.

    A note for the people in a school who get scored most, which is the students. The question this page turns on is worth owning — what was this cut-off built from, and who decided where it went? — and it applies to a reading-level band or a benchmark percentile too. Sometimes the answer is solid. Sometimes somebody split a population into thirds. That is a fair thing for a sixteen-year-old to ask about a number attached to their name.

    What a school should never do with this

    Turn it into a threshold.

    The failure mode is easy to walk into with good intentions. A district likes the five questions, prints them for a faculty meeting, and adds one line at the bottom: three or more flagged, refer for follow-up. It has now built the kind of cut-off the MBI’s own authors withdrew in 2016 for having no diagnostic validity — except this one has no normative sample behind it at all, and it is attached to somebody’s employment.

    The second rule is do not collect them. A reflection sheet is honest precisely because nobody is going to read it; ask teachers to hand it in and what comes back is the set of answers people give their employer. Harder version of the same point: a collected sheet is a record, records can be requested, and a district holding staff-written statements that the workload is unmanageable has documented its own notice. If you are going to ask, intend to act — and the records a district already keeps are better material than a survey. Sections, preps, duties, coverage days and time-to-fill are facts, not self-reports.

    There is a constructive version of the five questions for an administrator, and it is not screening: ask them of a role rather than a person. Take one position on paper, before anybody is in it, and answer load, control, recovery and support about the job as written. That is a scheduling conversation, it belongs to whoever builds the master schedule, and it can be answered in August while something can still be done.

    One more reason to be careful with self-report, and it is not about psychometrics. The staff most likely to give a careful, unrevealing answer to a workplace questionnaire are the ones with the least security — anyone new, anyone whose renewal is a live question. A survey does not just measure the job imprecisely; it hears least clearly from the people whose jobs are hardest to refuse.

    What to do next

    Take the five questions onto any piece of paper, or print the sheet above. Answer question five first, because it is the one that tells you something. Write your sentence about the job, name the person who could change one item, and ask for that one thing.

    Then keep the two questions apart, because that is this page’s whole argument. “Is this job too heavy?” is answered by describing the job. “Am I all right?” is not, and if the honest answer is that something is wrong in a way a schedule change would not touch, that is a conversation with your doctor or a counselor — and if you are not sure who that would be, the checked list of who that person could be. A person who can ask you a follow-up question, not a page that hands back a score.

    Want it as a printable? Download The Teacher Burnout Job Check (2 pages, free, no email required) — five questions, no scale, and nothing to total up.

    Frequently asked questions

    Is there a free teacher burnout quiz that actually works?

    Not in the sense you are hoping for, and the reason is not that the free ones are cheap imitations of a good paid one. The paid instrument does not do it either. The Maslach Burnout Inventory’s publisher removed its cut-off scores from the 2016 manual “due to having no diagnostic validity” and states that the MBI “is a research measure… but it is not a clinical diagnostic tool.” A free quiz that hands you a category is using a threshold the instrument’s own authors withdrew. What a free page can honestly give you is a set of questions about the job and no score, which is what the sheet on this page is.

    Can I take the Maslach Burnout Inventory myself?

    You can buy access to it. Mind Garden sells a self-report version for $20 and the manual for $50, and the Educators Survey is the 22-item version written for people who work in schools. What you will not get is a verdict. You will get three subscale scores on a continuum with no cut-offs, because the cut-offs were deleted. Worth knowing before you spend the money: a 2011 meta-analysis of 221 studies found the depersonalization and personal accomplishment reliabilities “well below recommended levels for high-stakes decisions, such as the diagnosis of burnout syndrome.” Two of your three numbers are the shaky ones.

    Why does this site not publish a burnout quiz?

    Because a quiz implies a threshold and there is no validated threshold in this literature for a person to cross. A 2021 COSMIN review of five burnout instruments reported that “the absence of an accepted diagnostic standard precluded measuring sensitivity and specificity” for any of them — meaning nobody can say how often a burnout test is right, because there is no agreed definition of the condition to check it against. Publishing a scored quiz anyway would mean inventing a line and putting this site’s name on it. The five questions on this page return no score on purpose.

    Can a quiz tell burnout apart from depression?

    No. The one study that tried the clinical version of this question — testing the MBI on 71 employees in treatment for work-related neurasthenia against 68 who were not — found burnout could be partly distinguished from anxiety and depression, with two of three subscales discriminating between the groups. Partly, in a clinical sample, by researchers. That is a long way from a web page sorting the two from twenty questions. If the distinction matters to you right now, it matters enough for a doctor or a counselor rather than a page.

    My school wants to give the staff a burnout survey. Is that a good idea?

    It can be, with two conditions. Do not attach a threshold to it and do not tie it to any individual. A scoring line invented for a faculty meeting is the same mistake the MBI’s authors corrected in 2016, with no normative sample behind it and employment attached. And be realistic about what a survey hears: the staff with the least job security give the most careful answers, so the people whose workloads are hardest to refuse are the ones you will hear from least. Counting what the district already records — sections, preps, duties, coverage days, time-to-fill — is usually better material, and it is fact rather than self-report.

    If the measures are this shaky, is teacher burnout even real?

    Yes, and that inference is the one misuse of this page worth naming. Uncertainty about a ruler is not uncertainty about the thing being measured. The World Health Organization defines burn-out in ICD-11 as an occupational phenomenon with three dimensions; what it declines to do is call it a medical condition. Weak instruments make the rate hard to pin down. They say nothing about whether a particular job has become unmanageable, and answering a teacher who says so with a note about psychometrics is not a reply.

    I am a parent and I think my child’s teacher is burned out. What should I do?

    Start from the same place this page ends: you cannot score a person from outside, and a validated instrument administered by researchers struggles to do it from inside. What you can do is describe what you have actually seen — work coming back slowly, a class that seems to have lost its shape — and raise it with the school as a question about the class rather than a judgment about the adult. Two things to avoid: do not ask your child to report on how their teacher seems, which puts a kid in the middle of an adult problem, and keep it out of the class group chat. A teacher’s apparent state is not community information.

    I am a student and my teacher seems exhausted. Is that because of us?

    No. How many classes a teacher has, how many students are in each one, how many duties come with the job and whether there is any time in the day to recover are decisions made by adults, before you walked in. Nothing on this page measures a student and none of the research behind it asked one anything. You are allowed to notice that a class has gone flat, and if it is affecting your work the person to tell is a counselor or another teacher you trust — describe the class, not the person. What is not yours is fixing an adult’s workload.


    Sources

    • Mind Garden. Cut-Off Scores for the Maslach Burnout Inventory. The publisher’s statement that the cut-off scores were removed from the 2016 MBI Manual 4th edition “due to having no diagnostic validity,” that the authors regarded them as a “mistake,” and that high / moderate / low “were calculated by splitting the normative population into thirds.” mindgarden.com
    • Mind Garden. Maslach Burnout Inventory — Educators Survey (MBI-ES). 22 items, three subscales; prices as listed 2026-09-24. States the MBI “is a research measure… but it is not a clinical diagnostic tool.” mindgarden.com
    • World Health Organization. Burn-out an “occupational phenomenon” (ICD-11, QD85). Listed under “Factors influencing health status or contact with health services” and not classified as a medical condition. who.int
    • Shoman, Y., Marca, S. C., Bianchi, R., Godderis, L., van der Molen, H. F., & Guseva Canu, I. (2021). Psychometric properties of burnout measures: a systematic review. Epidemiology and Psychiatric Sciences, 30, e8. 19 studies, 5 instruments, COSMIN-rated. Read in full via KU Leuven Lirias. doi.org
    • Wheeler, D. L., Vassar, M., Worley, J. A., & Barnes, L. L. B. (2011). A reliability generalization meta-analysis of coefficient alpha for the Maslach Burnout Inventory. Educational and Psychological Measurement, 71(1), 231–244. 221 studies, 84 usable alphas. doi.org
    • Schaufeli, W. B., Bakker, A. B., Hoogduin, K., Schaap, C., & Kladler, A. (2001). On the clinical validity of the Maslach Burnout Inventory and the Burnout Measure. Psychology & Health, 16(5), 565–582. 71 employees in treatment for work-related neurasthenia (ICD-10) against 68 without. Read via the PubMed abstract; the full text was not reachable from this session and nothing beyond the abstract is claimed. pubmed.ncbi.nlm.nih.gov
    • Schaufeli, W. B., De Witte, H., & Desart, S. (2020). Manual Burnout Assessment Tool (BAT), version 2.0. Norms on representative Flemish and Dutch workforce samples, N = 1,500 each; workers across occupations, not teachers, and not a United States sample. burnoutassessmenttool.be
    • Hawrot, A., & Koniewski, M. (2018). Factor structure of the Maslach Burnout Inventory–Educators Survey in a Polish-speaking sample. Journal of Career Assessment, 26(3), 515–530. 1,206 teachers. The three-factor model did not fit well; a bifactor model fit best, so the MBI-ES behaves more like one overall measure than three independent dimensions. Polish primary school teachers — not a United States secondary result, cited for the structural finding only. doi.org

    Every source above was opened and read on 2026-09-24. Where one could not be opened in full, the list says which abstract was read instead. No figure on this page went unchecked against the document that produced it.


    About Clay Shumate

    Clay Shumate is a certified secondary Social Studies teacher in the public schools of West Alabama, with seven years of classroom experience, a B.A. in History, and an M.Ed. in Secondary Education. He writes about project-based learning, student responsibility, respect, and practical ways to hold young people to a higher standard while giving them room to learn from mistakes.

  • Teacher Burnout Support Groups: What Actually Exists, and What Each One Is For

    Teacher Burnout Support Groups: What Actually Exists, and What Each One Is For

    By Clay Shumate

    There is no free, national, teacher-only burnout support group you can look up and walk into this week. What exists is five different things that all get called support, and they answer different problems. The most useful one for most teachers is already paid for, sitting in a benefits packet nobody opens.

    If you have already spent an evening on this and turned up nothing but listicles, that is not a failure on your part. The help is genuinely not indexed, and knowing that in advance saves the evening.

    Every organisation below was checked before it was listed: what it is, who it is for, what it costs, where it stops. If you want the word defined first, start with what the word actually covers before you go looking for a room. If you want the work of getting back on your feet rather than a place to go, what recovery consists of once you have found the right room. One thing up front: a support group is not treatment. It is a room with people in it — worth a lot, and not the same as care.

    Key takeaways

    • The one route almost every teacher already has is the employee assistance programme — free, confidential, short-term counselling and referral, already bought by the employer. Most teachers do not know the number.
    • The largest teacher-specific support network in the country does not publish where its meetings are and says so outright. Its free national video meetings run quarterly.
    • The free 24/7 confidential helpline for education staff does exist — in the United Kingdom. Not here. That absence is a funding decision, not a fact of nature.
    • In the one randomised trial behind any of this, the employer gave people an hour on the clock every two weeks. Protected paid time was part of the intervention, not a nicety.
    • Across 23 controlled trials of teacher-burnout interventions the pooled effect was small — d = 0.18, and essentially nothing on depersonalisation. Nobody should promise you more.
    • Sort by the problem, not the label. Talking privately, talking to a peer, changing the job and getting clinical help are four needs, and only two are answered by a group.
    Free download

    The Teacher Burnout Support Finder

    Two printable pages. Page one is a write-in contact sheet for the four different needs that all get called support — talking privately, talking to a peer, getting something about the job changed, and getting clinical help — with room to fill in the real names and numbers for your own district. Page two is the checked national list: what each option actually is, what it costs, and where it stops. It is not a screening instrument and it returns no score. Free. No email address required. Designed for grades 6–12.

    Download the free PDF

    Is there a teacher burnout support group I can actually join?

    Probably not a local one you can find by searching. A national one by video, yes, four times a year. That gap is the real answer, and worth knowing before you spend an evening looking for something that is not indexed.

    The best-known teacher-specific network in the country is Happy Teacher Revolution, a Baltimore-founded organisation built on trained facilitators running peer meetings inside their own schools. It is real and active, and its own FAQ states that “HTR meetings are kept within their own communities and are not publicly listed. This is by design.” There is a decent reason for it — a room where staff talk honestly about a hard year is not something you advertise — but for a teacher searching at ten at night the network is invisible.

    What is open: the same organisation runs free quarterly Zoom meetings open to everyone, with sign-up on its site. What costs money: leading meetings at your own school requires its certification course, listed at $597 for twelve hours of asynchronous training. No certification is needed to attend a meeting. It is needed to run one.

    What are the five kinds of support, and what does each one cost?

    Five categories, three of them free at the point of use. They are not interchangeable. An employment route, a peer route and a clinical route answer different questions, and the common mistake is taking a problem to the wrong one.

    Graphic listing five kinds of teacher burnout support with the cost of each: an employee assistance programme, free, offering free and confidential assessments, short-term counseling and referrals per the US Office of Personnel Management; a teacher peer group, free quarterly with a $597 certification to lead one; a union or association, varying by state, where the NEA's own educator mental-health page lists no dedicated support group; a general peer support group, free, naming NAMI Connection as peer-led for adults 18 and over and DBSA online groups as free with registration required; and a referral line, free, naming the SAMHSA National Helpline at 1-800-662-HELP and 988. A closing note states that a peer group is not treatment and that none of the five diagnoses anything.
    Three of the five are free at the point of use. Only one of them is teacher-specific.

    1. Your employer’s employee assistance programme

    Check this one first. The federal Office of Personnel Management defines an employee assistance programme as “a voluntary, work-based program that offers free and confidential assessments, short-term counseling, referrals, and follow-up services to employees who have personal and/or work-related problems.” Free to you, already bought. Usually a number on the benefits page, the back of an insurance card, or one email to whoever handles benefits.

    It is not long-term therapy. Short-term means a set number of sessions, then a referral onward. It is still the fastest route most teachers have to actually talking to somebody.

    If you are reading this from a district office, the cheapest item on this page is making that number easier to find — on the staff landing page, in the first email of the year, on the back of the badge. Every teacher who cannot find the number is a service you are paying for and not delivering.

    2. A teacher-specific peer group

    Happy Teacher Revolution, above: free quarterly national video meetings, local meetings unlisted, $597 to certify to lead one. Alongside it, the informal version — a department, a grade-level team, a counterpart teaching the same course elsewhere. That is a peer group whether anyone calls it one — and if you are the only person in the building teaching your course, which plenty of secondary teachers are, it may not exist for you at all. That is the situation the free quarterly video meeting is actually for, along with your subject association and a counterpart at another school. In year one it is also most of the support that exists.

    3. Your union or professional association

    This varies so much by state that no page can tell you what yours has. What can be said is what the largest one publishes. The National Education Association’s own educator mental-health page lists AbleTo, a digital programme through member benefits, then points readers outward — a federal helpline, a mindfulness trainer, a state affiliate’s webinars, a third-party list. It does not list a dedicated support group for educators. Worth knowing before assuming your dues cover one. Ask your local rep; some state affiliates do more than the national page shows.

    4. A general peer support group

    Free, national, and not about teaching. NAMI Connection is a peer-led group for adults 18 and over living with mental health conditions, “free of cost to participants,” led by people with mental health conditions, and explicit that “no specific medical therapy or treatment is endorsed.” Many meet virtually and are open nationwide; NAMI runs a locator. DBSA runs online groups for people living with depression or bipolar disorder and states “all DBSA online support groups are free of charge” — registration required.

    Read the eligibility honestly: both are for people with a mental health condition. Burnout as the research uses the word is occupational rather than a diagnosis, so whether these are the right room is a question for somebody who can assess it — not for a web page.

    5. A referral line

    The SAMHSA National Helpline, 1-800-662-HELP (4357), is a free, confidential treatment referral and information service, 24 hours a day, 365 days a year, in English and Spanish. It does not counsel you; it tells you what exists near you. 988, the Suicide and Crisis Lifeline, is free and confidential by call, text or chat around the clock, and is not only for suicidal crisis: its site says it is for anyone “facing mental health struggles, emotional distress, alcohol or drug use concerns, or just need someone to talk to,” and that “the 988 Lifeline is for everyone.”

    Why is there no free national helpline for American teachers?

    Because nobody built one. That is the whole answer, and it is easiest to see next to a country that did.

    In the United Kingdom a charity called Education Support runs a helpline on 08000 562 561. Qualified counsellors, 24 hours a day, free from UK landlines and mobiles, support in over a hundred languages, and eligibility about as wide as it gets: “any serving, former or retired member of staff who has worked in any part of the education sector.” Former. Retired. Any part of the sector.

    American teachers cannot use it — it is funded for UK education staff — and it is named here so nobody reading this thinks what they want is unreasonable. A free, round-the-clock, confidential line answered by somebody who understands what a school is has been built and run for years. It is on the other side of an ocean.

    What exists here is general rather than educational: 988, the SAMHSA line, and whatever your employer bought. Those are real and worth using. But if you have wondered why this search turns up listicles instead of a phone number — there is no phone number to find.

    Graphic headed Protected paid time was part of the intervention, comparing what the randomised trial tested with what usually gets offered. The trial gave 74 physicians at one institution one facilitated hour every two weeks with a curriculum and employer-provided protected time, and found depersonalisation fell significantly at three months and at twelve while empowerment and engagement rose and held for a year, with the authors noting the small sample. What usually gets offered instead is an optional meeting at 4:15 on the teacher's own time with no facilitator and no end time, which has not been tested. Across 23 controlled trials of teacher-burnout interventions the pooled effect was d = 0.18, with depersonalisation at d = 0.03. A Cochrane review of four studies covering 2,199 teachers rated the evidence low to very low quality.
    The difference between the trial and the usual offer is an hour on the clock.

    Do support groups actually reduce burnout?

    A facilitated small group on paid time has the best evidence in this area, and it is still thin. All three findings are below, including the two that cut against the idea.

    The strongest design is not from education. West and colleagues (2014), in JAMA Internal Medicine, randomised 74 practising physicians at one institution into a facilitated small-group curriculum — one hour every two weeks, built on reflection, community building and meaning in work — or a control arm. Depersonalisation fell significantly at three months and at twelve; empowerment and engagement rose and held for a year. And the institution provided protected time for the meetings. That is not a footnote. It is part of what was tested.

    So the honest reading is not join a group. It is give people an hour on the clock, every two weeks, with a facilitator and a structure — a scheduling decision, and not one a teacher can make. It belongs to whoever builds the calendar and signs off the release time. A group meeting at 4:15 on your own time after a full teaching day is a different intervention from the one that worked, and nobody has tested it.

    One practical consequence, for anyone thinking of starting one. The person who facilitates the group must not be the person who evaluates the people in it. A principal who runs a staff support group becomes the administrator who knows which teachers are struggling, and that knowledge does not stay put — it turns up in next year’s master schedule, in who gets the hard section, in a renewal conversation. Nobody has to intend it. A department chair, coach or counsellor with no evaluative role over the group is the cleaner choice, and facilitating is a learnable skill rather than a personality trait: the curriculum that worked was structured, not improvised. And it is not a substitute: a facilitated hour offered instead of fixing the schedule will be read as exactly that.

    Now the parts that go the other way. Iancu and colleagues (2018) pooled 23 controlled trials of teacher-burnout interventions. The overall effect was small but significant, d = 0.18. Exhaustion and personal accomplishment moved similarly; the effect on depersonalisation was d = 0.03, indistinguishable from nothing. Mindfulness-based programmes did show significant effects on exhaustion and accomplishment, and anything running under a month showed the smallest effects. The breakdown by intervention type sits behind a paywall, so this page claims no separate effect size for peer or group formats. It does not have one.

    On changing the organisation instead of the teacher, the Cochrane review by Naghieh and colleagues (2015) found only four eligible studies covering 2,199 teachers and rated the evidence low to very low quality for attrition, reporting bias and underpowered designs. Verbatim: “We found low-quality evidence that organisational interventions lead to improvements in teacher wellbeing and retention rates. We need further evaluation.”

    A structured group with real time behind it is a reasonable bet. Anybody telling you a support group fixes burnout has gone past the evidence.

    Can a support group make things worse?

    It can, in two specific ways, and neither has been measured. That is not an argument against going. It is an argument for knowing which room you are in.

    The first is confidentiality. A group organised by your school, in your building, with your administrator’s knowledge, is a room where you describe your own difficulty inside your employer’s house. Usually nothing comes of it. But a teacher who is not tenured, or up for a renewal decision, is weighing something real, and pretending otherwise would be dishonest. Two rules: do not say anything in that room you would not put in writing, and do not research any of this on a district device or account. A work laptop is not a private place to type “I am not coping.” If the honest version cannot be said in the building, that is what the outside routes are for.

    The second is structure. The trial that worked had a curriculum, a facilitator and an end time. A standing group with none of those is a venting session, and whether that helps or hurts has not been tested in teachers. Complaining about a genuinely bad schedule is accurate description, not weakness, and nobody should be told to stop. The question after the hour is whether you left with anything — a next step, a name, one thing to try — or only with the hour gone.

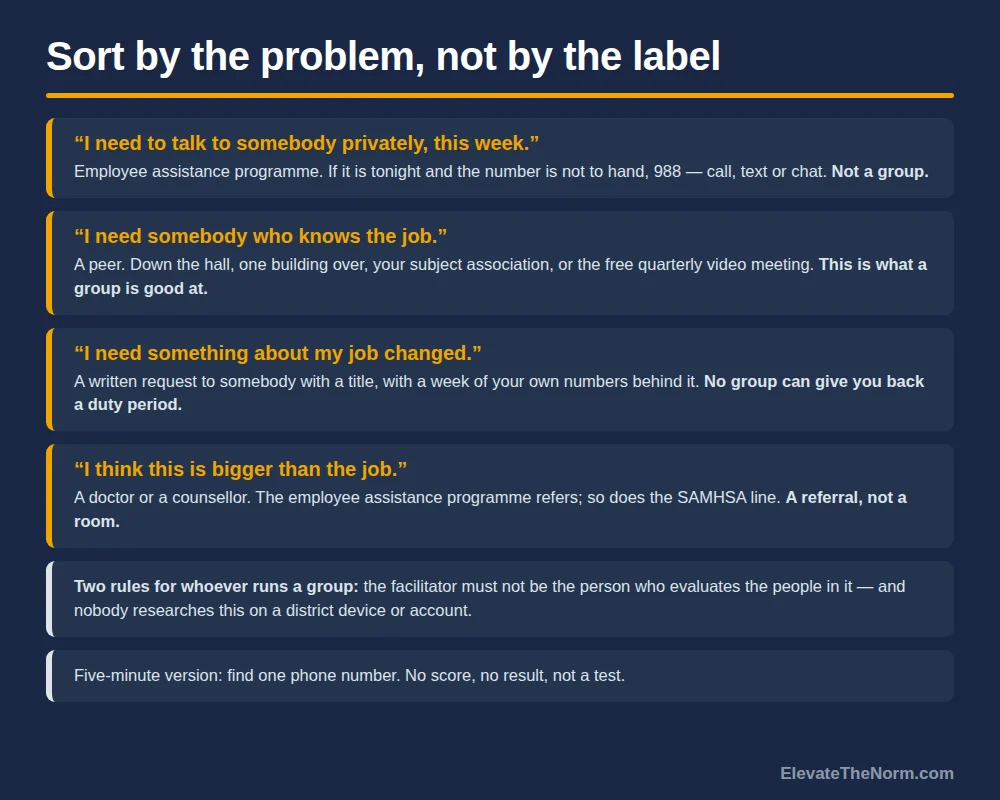
    Graphic headed Sort by the problem, not by the label, matching four stated needs to four answers: needing to talk privately this week points to the employee assistance programme or 988 and is marked not a group; needing somebody who knows the job points to a peer or the free quarterly video meeting and is marked as what a group is good at; needing something about the job changed points to a written request to somebody with a title, since no group can give back a duty period; and thinking the problem is bigger than the job points to a doctor or counsellor reached by referral. Two closing rules state that a group's facilitator must not be the person who evaluates the people in it, that nobody should research this on a district device, and that the five-minute version is to find one phone number.
    Two of the four are not support groups at all. That is the most common mistake.

    Which one fits the problem you actually have?

    Sort by the problem, not the label. Four needs get bundled under “support” and only two are answered by a group. This takes five minutes. It is not a test and there is no score.

    • “I need to talk to somebody this week, privately.” The employee assistance programme — free, confidential, short-term counselling and a referral onward. If it is tonight and the number is not to hand, 988 takes calls, texts and chats at any hour. Not a group.
    • “I need somebody who knows what a Tuesday in a 6–12 building is like.” A peer. Usually down the hall or one building over; the national version is the free quarterly video meeting. This is what a support group is genuinely good at, and nothing else substitutes for it.
    • “I need something about my job to change.” A support group is the wrong tool. No group can give you back a duty period. That is a written request to somebody with a title, and it lands better with a week of your own numbers behind it than with a description of how you feel.
    • “I think this is bigger than the job.” A doctor or a counsellor, and the route is a referral rather than a room. The employee assistance programme refers; so does the SAMHSA line, free, in English or Spanish, at any hour.

    And if reading a four-way sort is already more than you have in you this week, do the five-minute version instead: find one phone number. Not a group, not a programme, not a plan. The employee assistance number, written down somewhere that is not a school device. That is the whole task, and it is worth more than an evening of searching.

    Two of the four are not support groups, and that is the point. Most of the frustration teachers report comes from taking a structural problem into a room with no authority to solve it, then concluding support groups do not work. They work at what they do.

    Wherever you write this down: keep it on paper, off the school network, and put no student’s name and no colleague’s name on it. A private note about your own workload that starts listing other people is a different document, with different consequences.

    A word for any student who has ended up on this page. Nothing here is about you. The hours in a teacher’s day, the number of students in a room and whether there is an hour anywhere for an adult to talk to another adult are all decisions made by adults, usually before the school year started. Student behaviour is not why teachers burn out, and a teacher looking for support is a teacher doing the sensible thing rather than a teacher failing at something.

    When the answer is a person, not a group

    Some of this is not an occupational problem, and a group is not built to tell the difference. Neither is this page.

    Burnout in the research literature is a condition of the job — exhaustion, distance from the work, a collapsed sense of getting anywhere. It is not a clinical diagnosis, and there is no validated cut-off in it that a person crosses on a Tuesday. No checklist can tell you whether what you have is burnout, depression, grief, exhaustion from something at home, or several at once; the symptoms overlap enough that the distinction is hard even with training.

    So if you are not sleeping, not eating, not able to make yourself get out of the car in the parking lot, or having thoughts of hurting yourself, the next step is not a Thursday meeting. It is your doctor, a counsellor, or 988 — free, confidential, and in its own words for everyone rather than only for people in crisis. That is a conversation with a person, not a result from a page, and reaching it early is not an overreaction.

    What to do next

    Three things in this order, and the first takes five minutes.

    Find your employee assistance programme number today. Benefits page, insurance card, or one email to whoever handles benefits. Write it somewhere that is not a district device. You are not calling today; you are making sure that the day you want to, the number exists and you know where it is.

    Pick one person. Not a group, not a programme — one colleague whose job is close enough to yours to understand it. That is the peer support that actually gets used, and it requires nobody’s certification.

    And if what you need is the job changed, write the ask down. The version of this written before it gets bad is worth reading too, because the cheapest support group is the one you never end up needing. And if you arrived at that question by way of an online quiz, it is worth knowing what those scores are actually built on.

    Want it as a printable? Download The Teacher Burnout Support Finder (2 pages, free, no email required) and fill in the four numbers for your own district before you need them.

    Frequently asked questions

    Is there a free teacher burnout support group I can join near me?

    Probably not one you can find by searching, and that is not your fault. The largest teacher-specific network in the United States, Happy Teacher Revolution, states on its own FAQ that its meetings \u003cstrong\u003eare not publicly listed, and calls that a design decision\u003c/strong\u003e. What is open to anyone is its free quarterly national Zoom meeting. Beyond that, the free options are not teacher-specific: NAMI Connection and DBSA run free peer groups for adults living with mental health conditions, and your employer\u0026rsquo;s assistance programme offers free confidential short-term counselling. The free national helpline for education staff that this search is really looking for exists in the United Kingdom, not here.

    Where do I find my employee assistance programme number?

    Three places, in order of speed: your district\u0026rsquo;s benefits page on the staff intranet, the back of your health insurance card, and a one-line email to whoever handles benefits in the district office. It takes about five minutes and you do not have to explain why you are asking. Write the number somewhere that is not a school device, so that the day you want it, it already exists.

    Is the employee assistance programme confidential from my principal?

    It is designed to be. The federal Office of Personnel Management describes an employee assistance programme as \u003cstrong\u003e\u0026ldquo;a voluntary, work-based program that offers free and confidential assessments, short-term counseling, referrals, and follow-up services\u0026rdquo;\u003c/strong\u003e. But programmes are run by outside providers under contracts that differ, so the honest answer is to ask the provider directly what, if anything, goes back to the employer — and to ask the provider rather than your district. That is a reasonable question and a good provider will answer it plainly.

    Do teacher burnout support groups actually work?

    The best evidence is real and it is modest. A randomised trial of 74 physicians (West and colleagues, 2014) found that a facilitated small group meeting one hour every two weeks \u003cstrong\u003ewith employer-provided protected time\u003c/strong\u003e significantly reduced depersonalisation at three and twelve months. Across 23 controlled trials of teacher-burnout interventions the pooled effect was \u003cstrong\u003ed = 0.18, small but statistically significant\u003c/strong\u003e, with essentially no effect on depersonalisation (d = 0.03). A Cochrane review of organisational changes found only four eligible studies and rated the evidence low to very low quality. So: worth doing, and nobody should promise you it fixes burnout.

    Should my principal run the staff support group?

    No. \u003cstrong\u003eThe person who facilitates the group should not be the person who evaluates the people in it.\u003c/strong\u003e A principal who runs it becomes the administrator who knows which teachers are struggling, and that knowledge does not stay put — it shows up in next year\u0026rsquo;s master schedule, in who gets the hard section, and in renewal conversations. Nobody has to intend that for it to happen. A department chair, an instructional coach or a counsellor with no evaluative role over the group is the cleaner choice.

    Is a support group the same thing as therapy?

    No, and the good ones say so themselves. NAMI states that in its groups \u003cstrong\u003e\u0026ldquo;no specific medical therapy or treatment is endorsed\u0026rdquo;\u003c/strong\u003e. A peer group is people with similar experience talking to each other, which is genuinely valuable and is not clinical care. Nothing on this page or in any group diagnoses anything: burnout as the research uses the word is an occupational condition, and there is no validated cut-off in that literature that a person crosses. If the question is whether something clinical is going on, that is a doctor or a counsellor.

    Should I be worried if my child\u0026rsquo;s teacher is using a support group?

    No. A teacher who uses support is doing the sensible thing, and it is a better sign than the alternative. Two requests, though, if you are a parent reading this. \u003cstrong\u003eDo not ask your child whether their teacher seems stressed\u003c/strong\u003e — that puts a child in the middle of an adult\u0026rsquo;s working conditions, and they are not in a position to judge it. And a teacher\u0026rsquo;s apparent state is not material for the class group chat. If you are genuinely concerned about a classroom, the useful question to the school is about staffing and coverage, not about the person.

    Is it my fault that my teacher needs support?

    \u003cstrong\u003eNo.\u003c/strong\u003e If you are a student who found this page, nothing on it is about you. How many hours are in a teacher\u0026rsquo;s day, how many students are in a room, how much is graded outside the school day and whether there is an hour anywhere for one adult to talk to another are all decisions made by adults, usually before the school year started. Student behaviour is not why teachers burn out, and an adult\u0026rsquo;s working conditions are not a student\u0026rsquo;s to manage.

    Sources

    • West, C. P., Dyrbye, L. N., Rabatin, J. T., et al. (2014). Intervention to promote physician well-being, job satisfaction, and professionalism: a randomized clinical trial. JAMA Internal Medicine. 74 practising physicians at one institution, randomised; a facilitated small-group curriculum meeting one hour every two weeks, with institution-provided protected time. Depersonalisation fell significantly at 3 and 12 months; empowerment and engagement rose and held for 12 months. The JAMA full text could not be opened from this session, so the trial details above are taken from The Hospitalist’s report of it and attributed to that summary rather than to a reading of the original. Physicians, not teachers, and a small single-site sample — the authors say so themselves. the-hospitalist.org
    • Iancu, A. E., Rusu, A., Măroiu, C., Păcurar, R., & Maricuțoiu, L. P. (2018). The effectiveness of interventions aimed at reducing teacher burnout: a meta-analysis. Educational Psychology Review, 30(2). 23 controlled trials (19 journal articles, 4 unpublished dissertations). Overall d = 0.18 (SE = 0.05, p < .001); depersonalisation d = 0.03 (SE = 0.06, p > .05). Mindfulness interventions showed significant effects on exhaustion and personal accomplishment; interventions under one month showed the smallest effects. Read via the published abstract in the ERIC record; the breakdown of effect sizes by intervention type is behind a paywall and no peer-group-specific effect size is claimed on this page. eric.ed.gov
    • Naghieh, A., Montgomery, P., Bonell, C. P., Thompson, M., & Aber, J. L. (2015). Organisational interventions for improving wellbeing and reducing work-related stress in teachers. Cochrane Database of Systematic Reviews, CD010306. Four studies, 2,199 teachers. Evidence rated low to very low quality throughout, for attrition bias, reporting bias, underpowered studies and confounded individual-level components. Authors’ conclusion, verbatim: “We found low-quality evidence that organisational interventions lead to improvements in teacher wellbeing and retention rates. We need further evaluation of the effects of organisational interventions for teacher wellbeing.” Read in full from the University of Greenwich open repository. gala.gre.ac.uk
    • US Office of Personnel Management. What is an Employee Assistance Program (EAP)? The definition quoted on this page, including “free and confidential assessments, short-term counseling, referrals, and follow-up services.” opm.gov
    • Happy Teacher Revolution. FAQs and Revolutionary Certification Program. Source of the free quarterly Zoom meetings open to everyone, the statement that “HTR meetings are kept within their own communities and are not publicly listed. This is by design,” and the $597 certification price. Checked 2026-09-24. happyteacherrevolution.com
    • National Education Association. Mental Health Resources from NEA and Our Partners. Lists AbleTo through member benefits and points readers to outside resources. Cited on this page for what it does not contain — a dedicated support group for educators — rather than as evidence of anything about burnout. Checked 2026-09-24. nea.org
    • National Alliance on Mental Illness. NAMI Connection. Peer-led support group for adults 18 and over living with mental health conditions, “free of cost to participants,” led by people with mental health conditions, and stating that “no specific medical therapy or treatment is endorsed.” Checked 2026-09-24. nami.org
    • Depression and Bipolar Support Alliance. DBSA Online Support Groups. “All DBSA online support groups are free of charge”; registration required; for people living with depression or bipolar disorder. Checked 2026-09-24. dbsalliance.org
    • Substance Abuse and Mental Health Services Administration. National Helpline, 1-800-662-HELP (4357). Free, confidential treatment referral and information service, 24 hours a day, 365 days a year, in English and Spanish. Only the page’s own summary description was readable from this session, so nothing beyond it is claimed here. samhsa.gov
    • 988 Suicide & Crisis Lifeline. Free and confidential, 24/7/365, by call, text or chat, and explicitly not limited to suicidal crisis: for anyone “facing mental health struggles, emotional distress, alcohol or drug use concerns, or just need someone to talk to,” because “the 988 Lifeline is for everyone.” 988lifeline.org
    • Education Support (United Kingdom). Education Support helpline. 08000 562 561; qualified counsellors; 24 hours a day; free from UK landlines and mobiles; support in over 100 languages; open to “any serving, former or retired member of staff who has worked in any part of the education sector.” A UK service, not available to teachers in the United States — named on this page as the contrast, not as a resource to call. Checked 2026-09-24. educationsupport.org.uk

    Every organisation listed on this page was opened and read on 2026-09-24. Where a source could not be opened directly, the page says which summary was read instead rather than citing the original as though it had been.


    About Clay Shumate

    Clay Shumate is a certified secondary Social Studies teacher in the public schools of West Alabama, with seven years of classroom experience, a B.A. in History, and an M.Ed. in Secondary Education. He writes about project-based learning, student responsibility, respect, and practical ways to hold young people to a higher standard while giving them room to learn from mistakes.

  • Teacher Burnout Statistics: Where Each Number Actually Comes From

    Teacher Burnout Statistics: Where Each Number Actually Comes From

    By Clay Shumate

    There is no single teacher burnout rate. The most-quoted figures come from four different surveys that asked four different questions of four different groups of people, and that is most of why they range from 44 percent to 90 percent. This page traces each number back to its own survey — who was asked, when, how many, and what the question actually said.

    Every other page in this series uses a number in service of an argument. This one is about the numbers themselves. If you want the word defined, start with the three dimensions every one of these surveys is trying to approximate. If you want to know whether what you are feeling has a name, the symptom picture underneath the percentages is the better page. What follows is provenance: which statistics on teacher burnout survive a check, which ones do not, and how to tell the difference in about two minutes.

    That matters more than it sounds like it should, because these numbers get spent. A figure showing that most teachers consider burnout a serious problem justifies an awareness campaign and a webinar. A figure showing how many hours teachers actually work justifies a schedule change. The same concern, measured two ways, buys two completely different things — and the wrong number in a board presentation buys the cheap one.

    Key takeaways

    • The most defensible current figure is 53 percent — the share of teachers meeting RAND’s burnout measure in its 2025 national survey of 1,419 teachers. That measure is a four-statement scale about enthusiasm and whether the job is worth it. It is not the Maslach Burnout Inventory and it is not a diagnosis.
    • The famous 44 percent is Gallup’s, from February 2022, and it describes all K–12 workers — aides, drivers and office staff included. The teacher-only figure in that same poll was 52 percent.
    • “Ninety percent of teachers report burnout” is not what was measured. In the NEA survey that figure comes from, 90 percent of members said burnout is a serious problem in the profession. That is a question about the job, not about the person answering.
    • Across 70 studies of teachers, reported burnout prevalence ran from 2.81 percent to 70.9 percent. Most of that spread is instruments and cut-off lines, not differences between teachers.
    • RAND’s 2026 report does not print its own burnout percentage anywhere in the text. It is a bar on a chart, and the trade press read it as 57 percent.
    • Headlines in June 2026 said teacher burnout hit an all-time high. The report they were written about says the 2026 share was within four percentage points of 2023, 2024 and 2025.
    • None of these numbers is about you. A prevalence figure describes a population, and there is no validated threshold anywhere in this literature that a person crosses.
    Free download

    The Teacher Burnout Statistic Check

    Two printable pages. A write-in sheet for running any burnout number through the five questions on this page — who was asked, how many and weighted to what, when, what the question said, and where the figure was actually printed — plus the four benchmark statistics with what each one measured, and a line you can cite without overstating it. It is not a screening instrument and it returns no score. Free. No email address required. Designed for grades 6–12.

    Download the free PDF

    What is the current teacher burnout rate?

    The most defensible answer is 53 percent, and it comes with a label. In RAND’s 2025 State of the American Teacher survey — 1,419 K–12 public school teachers, fielded from late January to March 2025 and weighted to the national teacher population — 53 percent met the survey’s burnout measure. That is the figure to use if you need one figure.

    Four-column table comparing teacher burnout statistics: 53 percent from RAND fielded January to March 2025 with 1,419 weighted teachers; 44 percent from Gallup fielded 3 to 14 February 2022 covering 1,263 K-12 workers within 12,319 full-time US workers; 90 percent from the NEA and GBAO fielded 14 to 24 January 2022 among members with no published sample size; and 57 percent, a trade press reading of RAND's 2026 chart covering 829 teachers.
    The same subject, four different questions — and four different answers.

    The 2026 edition is where it gets awkward. RAND surveyed 829 teachers between 28 January and 21 February 2026, plus 498 similar working adults in February, and reported that the 2026 burnout share was similar to 2023, 2024 and 2025 — “differences were 4 percentage points or fewer.” It does not say what the 2026 share was. The percentage exists only as a bar in the report’s first chart; the univariate tables live in separate annex files. Reading that chart, the education trade outlet K–12 Dive reported teacher burnout rising from 54 percent in 2021 to 57 percent in 2026. That is a reasonable reading of a picture, and it is not the same thing as a published figure.

    One 2026 number is printed in plain text, and it is the one worth carrying: 55 percent of teachers reported frequent job-related stress, against 34 percent of similar working adults — down from 62 percent of teachers in 2025. Stress and burnout are different measures, and only one of them got written down.

    Any single national figure also flattens a gap the surveys keep finding. In RAND’s 2026 data, 59 percent of female teachers reported frequent job-related stress against 44 percent of male teachers, and Gallup found the same direction in 2022, with female teachers at 55 percent. A district reporting one average to its board is reporting a number that does not describe half its staff particularly well.

    Why do the statistics on teacher burnout disagree so much?

    Because burnout has no agreed threshold, so every researcher draws the line somewhere slightly different. A 2022 scoping review in the International Journal of Environmental Research and Public Health pulled together 70 studies of teachers covering 143,288 participants. Reported burnout prevalence across them ran from 2.81 percent to 70.9 percent. Restricted to moderate-to-severe levels it still ran from 25.12 percent to 74 percent.

    Graphic explaining why burnout prevalence estimates vary: reported prevalence ran from 2.81 to 70.9 percent across 70 studies of teachers covering 143,288 participants, 84 percent of those burnout studies used the same Maslach Burnout Inventory instrument, and a 2018 JAMA review of 182 physician studies found 47 distinct definitions of overall burnout prevalence with rates from 0 to 80.5 percent. A closing note explains that the instruments return scores rather than a verdict and that the cut-off is not standardised.
    The spread comes from cut-off lines, not from differences between teachers.

    Those studies were not measuring wildly different teachers. Eighty-four percent of the burnout studies in that review used the same instrument — the Maslach Burnout Inventory. The inventory returns scores on three dimensions; turning scores into a headcount requires someone to decide how high is high enough, and the decision is not standardised.

    Medicine has the cleanest demonstration of what that does. A 2018 JAMA systematic review of physician burnout examined 182 studies covering 109,628 people in 45 countries and found 47 distinct definitions of overall burnout prevalence, with reported rates from 0 percent to 80.5 percent. The authors concluded that the inconsistency made it impossible to determine reliably how burnout related to sex, age, geography, specialty or time. Those were doctors, not teachers — but the measurement problem is the same one, and it is the reason two honest surveys of the same profession in the same year can be twenty points apart.

    Where does the 44 percent teacher burnout figure come from?

    Gallup, February 2022 — and it is not a teacher figure. The Gallup Panel Workforce Study surveyed 12,319 full-time US workers between 3 and 14 February 2022, including 1,263 people working in K–12 education, with a sampling error of plus or minus 4.0 percentage points for that subgroup. Forty-four percent of K–12 workers said they feel burned out at work always or very often. That category includes aides, drivers, custodians and office staff alongside teachers.

    The teacher-only figure in the same study was 52 percent. College and university workers came in at 35 percent and all other workers at 30 percent. So the honest version of the headline is this: in a pandemic winter four years ago, on an always-or-very-often question, K–12 education reported the highest burnout of any industry Gallup measured, and teachers specifically were higher still.

    What has happened to that number since is that it got shortened. “Forty-four percent of teachers are burned out” understates the teacher figure and misdescribes the group. It is the most common single error in this entire subject, and it takes one click to catch.

    Is “90 percent of teachers are burned out” a real statistic?

    No — that is not what the question asked. The 90 percent comes from a National Education Association survey fielded by GBAO Strategies between 14 and 24 January 2022. What it found was that 90 percent of NEA members said feeling burned out is a serious problem, with 67 percent calling it very serious. Asking whether something is a serious problem in your profession is a different question from asking whether it is happening to you.

    Two other things about that survey belong on the label. It sampled NEA members, not teachers generally, and the press release announcing it does not publish a sample size or a margin of error. The widely repeated “55 percent plan to leave sooner than planned” is from the same poll and carries the same caveats.

    None of that makes the survey dishonest. A membership organisation polling its own members about conditions in the job is doing something legitimate, and 90 percent of a union’s members naming burnout as a serious problem is a real and useful fact. It is just not a prevalence rate, and it should never be cited as one.

    What did RAND actually measure?

    Four statements, and agreeing with any two of them counts. RAND’s technical documentation defines burnout as the percentage of teachers who somewhat agree or strongly agree with at least two of the following: that the stress and disappointments of the job are not really worth it; that they do not have as much enthusiasm now as when they began; that they look forward to the job in future; and that they are glad they chose it as a career. The last two are reverse-coded — disagreement is what scores.

    Read it twice and the scale of the thing becomes clear. A teacher who somewhat agrees that their enthusiasm has dimmed since year one, and somewhat disagrees that they look forward to next year, is counted. That is a real and meaningful signal about a workforce. It is not a clinical finding about a person, and RAND does not present it as one.

    This is what a measure built for tracking change looks like. It is broad, stable and cheap to repeat every spring, which makes it good at answering “is this getting better or worse” and bad at answering “how many teachers are seriously unwell.” Most arguments about teacher burnout statistics are arguments about which of those two questions the number was built for.

    Did teacher burnout hit an all-time high in 2026?

    Not according to the report the headlines were written about. In June 2026 an education trade outlet ran the headline “Teacher burnout is at an all-time high.” The RAND report underneath it says the 2026 shares reporting burnout and symptoms of depression were similar to 2023, 2024 and 2025, with differences of four percentage points or fewer. A different outlet reading the same chart described a rise from 54 percent to 57 percent across five years. Both were looking at the same picture.

    Here is the part that cuts the other way, and it is the part the correction usually leaves out. RAND’s central finding in 2026 is that teachers were more likely than similar working adults to report poor well-being on every indicator — a pattern it has recorded every year since 2021. Frequent job-related stress did fall, from 62 percent to 55 percent, but it is still 21 points above the comparison group. “Still much worse than everyone else, and not obviously getting worse” is the supportable summary. It is less quotable than either headline.

    One admission belongs here, because this site made the same class of error. An earlier article in this series cited about 28 percent of teachers against about 17 percent of similar working adults as RAND’s 2026 burnout figures. Those numbers were read off the wrong bar of that same chart; they belong to a different indicator, not to burnout. The article has been corrected. When a source publishes a finding only as a picture, everyone downstream is guessing, and some of them guess wrong.

    One thing this page is not doing, and it needs saying plainly. Uncertainty about the rate is not uncertainty about the condition. Every credible source here — a probability panel, a nationally weighted teacher panel, 70 peer-reviewed studies and a membership poll, using four different methods — finds teachers worse off than comparable workers. They disagree about how many. They do not disagree about the direction. If you are an administrator and the useful thing you took from this page is that the numbers are shaky, you took the wrong thing: correcting a statistic is not the same as answering a complaint.

    How do you check a teacher burnout statistic before repeating it?

    Five questions, and any number that cannot answer all five does not go in your slide deck. This is the whole method, and it works on any social statistic, not just this one.

    1. Who was asked? A probability panel, a nationally weighted teacher panel, an organisation’s own members, or whoever clicked a link. These are four different things and only the first two support the word “of teachers.”
    2. How many, and weighted to what? A figure with no sample size attached is not a statistic yet. RAND publishes 829 and 1,419 and says how it weights them; the NEA press release publishes neither.
    3. When? A February 2022 number is a pandemic-winter number. Four years is a long time in this particular subject, and the direction of travel since then has not been flat.
    4. What exactly did the question say? “Is burnout a serious problem” and “are you burned out” produce numbers 37 points apart. Find the wording, not the summary of the wording.
    5. Where was the figure printed? In the report text, in a published table, or only as a bar on a chart? If it is only a bar, everyone quoting it is reading a picture, and you should say so.
    Numbered graphic listing five questions to ask about any burnout statistic: who was asked, how many and weighted to what, when it was fielded, what exactly the question said, and where the figure was actually printed. A closing note states that a school running its own staff survey must make it anonymous, because a named wellbeing survey creates a record about identifiable employees.
    Any number that cannot answer all five does not get repeated.

    A sixth question is worth asking quietly: who paid for the survey, and what do they need it to say? That is not an accusation. An advocacy organisation, a research institute and a polling company are answering different questions for different reasons, and knowing which one you are holding tells you what it can carry.

    If you have thirty seconds rather than five minutes, run question four on its own. Find the exact wording of the question. It catches most of the errors in this subject by itself, including both of the big ones above.

    And if you are the one presenting the number — in professional development, at a faculty meeting, in a newsletter to families — the number is not the argument. A statistic teachers cannot recognise themselves in costs you the room for the rest of the year. Open with the local count and let the national figure sit behind it as context.

    What can these numbers not tell you?

    Anything about you, and anything about your building. A prevalence figure describes a population. Reading 53 percent as a verdict on yourself is statistically wrong, and it is also the exact self-blame that makes a hard year harder. There is no validated cut-off in this literature that a person crosses, which is why there is no quiz on this site and why nothing on this page returns a score.

    A national percentage also cannot tell you which part of your own week is the problem. That takes a local count, and the loads it usually implicates — behaviour, hours, family contact, grading structure — each have their own fix. Which demands the evidence actually implicates is a separate question with a separate answer, and the numbers a school leader can actually act on are local ones.

    A district that wants a real number already has better material than any national survey: exit-interview reasons, vacancy counts by subject, how long postings stay open, sick-leave use by month, transfer requests, and the share of staff carrying an extra section. Those are administrative records rather than opinions, they are already collected, and they answer the question a board actually needs answered — which buildings, which subjects, and how much.

    If you run your own staff survey instead, anonymity is not a courtesy — it is a measurement requirement. Staff asked to name themselves on a wellbeing question will answer conservatively, in a predictable direction, and the resulting number will be wrong in a way no analysis can fix. It is also a records problem: a non-anonymous staff wellbeing survey creates a document about identifiable employees, held by their employer, and nobody should be asked to write “I am not coping” next to their name on a district system. Collect it anonymously, report it by building rather than by department where departments are small enough to identify people, and do not ask for anything you do not intend to act on.

    One more limit worth naming: none of these surveys asked a student anything, and none of them measures a student. Where a stressor ranking puts student behaviour near the top, it is describing how a room of thirty is staffed, scheduled and supported — not the people in it. Families should also note that a workforce percentage says nothing about any individual teacher, and a specific teacher’s apparent state is not a subject for the class group chat.

    And if the reason you are reading a page of statistics is that you recognise yourself in them, the statistics are the wrong tool. That is a conversation with your doctor or a counsellor — a person, not a percentage.

    What to do next

    If you are about to put a burnout number in front of a faculty meeting, a school board or a grant reviewer, run it through the five questions first. If you need one defensible figure, use RAND’s 53 percent from 2025 and say what it measured — a four-statement scale, nationally weighted, not a diagnosis. If someone hands you 44 or 90 percent, you now know what both of those actually counted.

    And if you are reading this because the numbers describe your year rather than your slide deck, skip the statistics entirely. The student-side findings get misquoted in exactly the same way, and none of it changes what is true in your own room on Monday. The same provenance question is worth asking of the instruments and not only the surveys — here is where the burnout cut-off scores came from, and why they were withdrawn.

    Want the check as a printable? Download The Teacher Burnout Statistic Check (2 pages, free, no email required) and run the next number somebody hands you through the five questions before you repeat it.

    Frequently asked questions

    What is the most reliable teacher burnout statistic?

    RAND’s State of the American Teacher survey, because it publishes its sample, its weighting and its measure. In 2025 it found that 53 percent of a nationally weighted sample of 1,419 K–12 public school teachers met its burnout measure. Cite it with the measure attached: agreement with at least two of four statements about enthusiasm and whether the job is worth it. RAND’s 2026 report says the share was within four percentage points of 2023, 2024 and 2025 but does not print the 2026 figure in its text, so if you need a number rather than a direction, 2025 is the most recent one actually published as a number.

    Why do teacher burnout statistics vary so widely?

    Because there is no agreed threshold for counting a person as burned out. A 2022 scoping review of 70 studies of teachers, covering 143,288 participants, found reported prevalence running from 2.81 percent to 70.9 percent — and 84 percent of those burnout studies used the same instrument. The instrument returns scores on three dimensions; turning scores into a headcount means somebody has to pick a cut-off, and the pick is not standardised. A JAMA review of physician burnout found 47 distinct definitions of overall prevalence across 182 studies. Different questions, different cut lines and different years — not different teachers.

    Is the 44 percent burnout figure about teachers?

    No. It is Gallup’s, from a survey of 12,319 full-time US workers fielded 3–14 February 2022, and it describes everyone working in K–12 education — aides, drivers, custodians and office staff as well as teachers. The teacher-only figure in the same study was 52 percent. If you want Gallup’s teacher number, use 52. If you want Gallup’s industry number, use 44 and say “K–12 workers,” not “teachers.”

    Does “90 percent of teachers are burned out” mean 90 percent are burned out?

    No. In the National Education Association survey behind that figure, fielded by GBAO Strategies from 14 to 24 January 2022, 90 percent of NEA members said feeling burned out is a serious problem, with 67 percent calling it very serious. That is a judgment about the profession, not a report about the person answering. The survey also polled members rather than teachers generally, and the press release announcing it publishes no sample size and no margin of error. It is a real finding. It is not a prevalence rate and should not be cited as one.

    Can I use these statistics to work out whether I am burned out?

    No — and not because you are not entitled to an answer. There is no clinically validated cut-off anywhere in this literature, which means no number on this page is a line you are either over or under. A prevalence figure describes a population; applied to one person it says nothing at all. If you want to think through what you are actually experiencing, the symptom page is the better starting point. If it is affecting your sleep, your health or your ability to do ordinary things, the next step is a conversation with your doctor or a counsellor rather than a percentage.

    Should my school or district run its own teacher burnout survey?

    It can be far more useful than any national figure, with two conditions. It has to be anonymous — staff asked to put a name to a wellbeing question answer conservatively, so a non-anonymous survey produces a wrong number and a file on identifiable employees at the same time. And do not ask unless you intend to act; a survey that produces no change teaches staff that the next one is not worth answering honestly either. Before running one, check whether records you already hold — vacancy counts, how long postings stay open, sick-leave use by month, exit reasons — answer the question without a survey at all.

    Headlines say most teachers are burned out. Should I worry about my child’s teacher?

    Not on the strength of a percentage. These figures describe a national workforce and say nothing about any individual — the teacher in your child’s room may be having their best year. Where researchers have measured effects on students, the associations show up in the classroom experience rather than in test scores, and the strongest claims about student mental health are not supported by the evidence. If you do have a concern, the useful conversation is with the school about staffing and workload — not speculation about a named teacher in a group chat.

    I’m writing a paper on teacher burnout. Which statistic should I use?

    Use RAND’s 53 percent from the 2025 State of the American Teacher survey, cite the report itself rather than a news article about it, and write the measure into your sentence: 53 percent of a nationally weighted sample of 1,419 US public school teachers agreed with at least two of four statements indicating burnout. Written that way it cannot be misread. If your paper needs to explain why the estimates disagree, the 2022 scoping review and the JAMA physician review are the two sources that make the point best. And avoid any figure whose exact question wording you cannot find — if you cannot quote the question, you cannot defend the number.

    Sources

    • Steiner, E. D., Levine, R., & Doan, S. (2026). Teacher Well-Being, Pay, and Intentions to Leave in 2026: Selected Findings from the 2026 State of the American Teacher Survey. RAND, RR-A4404-2. 829 K–12 public school teachers surveyed 28 January to 21 February 2026 and 498 similar working adults in February 2026, weighted to the national teacher population. 55 percent of teachers reported frequent job-related stress against 34 percent of similar working adults, down from 62 percent of teachers in 2025; 59 percent of female against 44 percent of male teachers. The report states that the 2026 burnout share was within four percentage points of 2023, 2024 and 2025 but does not print the figure in its text — it appears only as a bar in Figure 1. rand.org
    • RAND (2026). State of the American Teacher Survey: 2026 Technical Documentation and Survey Results. RR-A4404-3. Source for the burnout construct quoted on this page — somewhat or strongly agreeing with at least two of four statements — and for the fielding windows. The univariate percentage tables are published in separate annex files rather than in the report itself. rand.org
    • Steiner, E. D., et al. (2025). Teacher Well-Being, Pay, and Intentions to Leave in 2025. RAND, RR-A1108-16. Figure 1: 53 percent of teachers met the burnout measure; 1,419 teachers, fielded January to March 2025. This is the source of the 53 percent figure used throughout. rand.org
    • Gallup (2022). K-12 Workers Have Highest Burnout Rate in U.S. Gallup Panel Workforce Study, a web survey of 12,319 US full-time workers fielded 3–14 February 2022 using Gallup’s probability-based panel, including 1,263 people in K–12 education, sampling error ±4.0 percentage points for that subgroup. 44 percent of K–12 workers, 52 percent of K–12 teachers, 55 percent of female teachers, 35 percent of college and university workers and 30 percent of all other workers reported feeling burned out always or very often. news.gallup.com
    • National Education Association (2022). Press release on a survey conducted by GBAO Strategies, 14–24 January 2022: 90 percent of members said feeling burned out is a serious problem, 67 percent very serious, and 55 percent said they plan to leave education sooner than planned. The release reports NEA members rather than teachers generally and publishes neither a sample size nor a margin of error. nea.org
    • Agyapong, B., Obuobi-Donkor, G., Burback, L., & Wei, Y. (2022). Stress, burnout, anxiety and depression among teachers: a scoping review. International Journal of Environmental Research and Public Health, 19(17), 10706. 70 studies, 143,288 participants. Reported burnout prevalence 2.81 to 70.9 percent overall and 25.12 to 74 percent for moderate-to-severe levels; the Maslach Burnout Inventory was used in 84 percent of the burnout studies. mdpi.com
    • Rotenstein, L. S., et al. (2018). Prevalence of burnout among physicians: a systematic review. JAMA, 320(11). 182 studies, 109,628 individuals, 45 countries; 47 distinct definitions of overall burnout prevalence and reported rates from 0 to 80.5 percent. The JAMA article itself could not be opened from this session, so the figures above are taken from Healio’s report of it and are attributed to that summary rather than to a reading of the original. Physicians, not teachers — cited here for the measurement problem only. healio.com
    • K-12 Dive (2026). Despite fewer exit plans, teacher stress, burnout still high. Cited on this page as an example of reading Figure 1 rather than as an independent source: it reports teacher burnout rising from 54 percent in 2021 to 57 percent in 2026. k12dive.com
    • eSchool News (2026). Teacher burnout is at an all-time high. Cited as the headline discussed above, published about a report whose own text describes the 2026 burnout share as similar to the three previous years. eschoolnews.com

    Every source above was opened and read for this article. Where a figure could not be confirmed in the original, the page says so rather than publishing it.


    About Clay Shumate

    Clay Shumate is a certified secondary Social Studies teacher in the public schools of West Alabama, with seven years of classroom experience, a B.A. in History, and an M.Ed. in Secondary Education. He writes about project-based learning, student responsibility, respect, and practical ways to hold young people to a higher standard while giving them room to learn from mistakes.

  • Special Education Teacher Burnout: The Three Loads That Are Not on the General List

    Special Education Teacher Burnout: The Three Loads That Are Not on the General List

    By Clay Shumate

    Teacher burnout in special education runs on a set of demands that does not appear on the general list at all. A caseload is a negotiated number, not a class roster. The paperwork carries statutory deadlines. The second adult in the room is a relationship to manage rather than a resource to use. The research on all three is consistent in direction and thinner in quality than you would hope.

    This page does not restate the general list. The general demand ledger every teacher is working from already covers behavior, hours and out-of-pocket spending, and all of it applies here too. For the word itself, start with the three dimensions the word is actually made of. What follows is narrower: the demands belonging to this job specifically, in grades 6–12, and how good the evidence behind them really is.

    Key takeaways

    • Three demands separate this job from the general one: caseload as a negotiated number, compliance work with statutory deadlines, and co-teaching as a relationship rather than a resource. None gets smaller by managing your time better.
    • Caseload is the most-named reason in the retention research: 33 percent of leavers in one urban district’s exit survey, more than any other factor — though that is 99 people in one district, not a national rate.
    • Paperwork was third in the same survey, at 24 percent, and lands differently because a missed deadline is a legal event rather than a late grade. The system behind it is large and mostly never touches individual teachers: 29,490 due process complaints filed nationally in 2021–22, 2,645 fully adjudicated.
    • In the co-teaching research the special educator is repeatedly observed in a subordinate role, most of all at secondary level. Across 32 studies, teachers reported roughly 45 minutes a week of joint planning and said they needed about three times that.
    • Special education is the hardest area in the country to staff: in August 2024, 66 percent of high schools reported difficulty filling it, and only 77 percent of those vacancies went to a fully certified teacher.
    • The evidence is directionally consistent and methodologically weak — of 30 studies in the major review, only two used designs supporting causal claims. The familiar “75 percent leave within five years” figure is one state’s data from 1987 to 2001, not a current rate.
    • None of these numbers is a statement about you, and none is a diagnosis. Burnout is an occupational condition; nothing here is a screening instrument and nothing returns a score.
    Free download

    The Special Education Workload Audit

    Two printable pages. A write-in grid for the four things on this page — caseload and where the number came from, compliance events counted by week, co-planning scheduled versus actual, and unfilled positions — plus how to read the four answers together and who to take them to. Counts and dates only, never a student’s name. It is not a screening instrument and it returns no score. Free. No email address required. Designed for grades 6–12.

    Download the free PDF

    What makes special education a different burnout problem?

    Three demands a general education teacher never meets, none of which you control the shape of. A caseload is set by somebody else, a compliance calendar by federal statute, a co-teaching partnership by a master schedule you did not build. Time-management advice is aimed at demands whose shape you can change, which is why it does not land here — and being told to work smarter about something you do not control is a reliable way to feel worse about it.

    Graphic listing three demands specific to special education: caseload as a negotiated number with 33 percent of leavers in one urban district naming it, compliance work with statutory deadlines with paperwork third at 24 percent, and co-teaching as a relationship with the special educator repeatedly observed in a subordinate role across 32 studies.
    The three demands that belong to this job and not to the general list.

    One thing to settle before the numbers start. Special educators report heavier loads and leave at higher rates, and it is easy to read that as a statement about the people who do the job. It is not. Every figure below is an average across thousands of teachers in very differently resourced buildings, and an average says nothing about any individual in it. Reading it as a verdict on yourself is statistically wrong, and it is the self-blame that makes a hard year harder.

    How many students is a special education caseload?

    Nobody can tell you, and that is the problem. A caseload is not a class size. It is a number produced by state rule, district practice, how many positions are filled, and what got decided in a meeting in July. Two teachers with the same title in the same state can be carrying very different loads.

    It is also what special educators name first. In a survey of teachers who left or moved out of one large urban district, 33 percent named large caseloads as an important reason — more than any other single factor. A teacher quoted in the same research put it plainly: “I currently see well over 75 students a day with little support.”

    Label that number before you carry it anywhere. It comes from 99 special educators, one district, three years. It is not national, and it does not tell you what a reasonable caseload is — no study does. It tells you what people say on the way out, and they have been saying it for a long time.

    The useful consequence: because a caseload is negotiated rather than given, it is one of the few demands here that somebody with a title can change in a scheduling meeting. That is not easy, but the conversation has a right address.

    Why does special education paperwork land differently?

    Because a missed deadline is a legal event rather than a late grade. Every teacher has paperwork. Very little of it sits inside a federal statute with a dispute-resolution process attached to the far end.

    Paperwork was third in that same district survey, at 24 percent. One teacher described it in terms any teacher will recognise: the IEPs ate up much of the time previously spent on students. The complaint is not that the documents are pointless, but that the documents and the students compete for the same hours.

    The system behind those deadlines is genuinely large. In 2021–22, states and outlying areas reported 29,490 due process complaints filed nationally, 6,160 written state complaints and 10,806 requests for mediation — up from 17,118 due process filings a decade earlier, with the share still pending at year end rising from 12 percent to 43 percent.

    Two qualifications, because this is the kind of number used to frighten people. Most of that volume never reaches a hearing — 2,645 were fully adjudicated — and the overwhelming majority of special education teachers finish a career without being personally involved in any of it. The point is not that you are about to be sued. It is that the deadlines are not negotiable the way a grading deadline is, which makes the pressure attached to them rational rather than something to talk yourself out of.

    What does co-teaching do to the job?

    In the research it repeatedly turns the special educator into the junior adult in somebody else’s room, and it does this most at secondary level. That is not a complaint about colleagues; it is what falls out of a structure where one adult owns the content and the other is assigned to the students.

    Graphic summarising a synthesis of 32 co-teaching studies covering 454 co-teachers: the special educator is often the junior adult, the pattern is strongest in grades 6 to 12, and teachers reported about 45 minutes of joint planning a week against a stated need of roughly three times that.
    The co-teaching findings, with the authors’ own selection-bias limitation printed underneath them.

    The largest qualitative synthesis of co-teaching covered 32 studies, 454 co-teachers, 42 administrators, 142 students, 26 parents and 5 support staff. Its central finding: the special education teacher was often observed to play a subordinate role, typically responsible for modifying instruction and managing behavior while the general educator controlled the content. One special educator described the job as being an aide sometimes, an interpreter sometimes, and sometimes a teacher.

    The pattern sharpened at secondary level, where specialised content knowledge decides who leads and teachers reported less training and more negative attitudes about co-teaching than elementary counterparts. If you teach grades 6–12, that is your setting, not a footnote.

    The pressure point is planning time. Teachers reported about 45 minutes a week of joint planning and said they needed close to three times that — and the authors note it was discussed almost entirely as a question of administrative support. That is the right framing, because planning time is a scheduling decision somebody signs off on, not a personal organisational failing.

    This is the one item on the page that genuinely responds to coaching. The subordinate pattern is produced by defaults — who stands where, whose name is on the gradebook, who the class looks at when directions are given — and an explicit division of roles, said out loud in front of students in the first week, changes what the room assumes for the year. If you are the general education teacher in that room, most of that fix is yours. Though a coaching cycle offered instead of staffing relief will be read as exactly what it is.

    Does the staffing shortage make all three worse?

    Yes, and it is the mechanism connecting them. Every unfilled special education position is a caseload that gets distributed, a compliance calendar absorbed, and a co-teaching assignment covered by whoever is available.

    The federal survey data is unambiguous about where the shortage bites. In a national panel of 1,392 public schools surveyed in August 2024, special education was the hardest teaching area in the country to staff: 66 percent of high schools and 74 percent of middle and combined schools reported difficulty filling those vacancies, and only 77 percent of the ones filled went to a fully certified teacher — eleventh of thirteen subject areas, against 89 percent for social studies.

    Read that last figure the right way. It is no judgement on people hired under emergency credentials, who are usually doing a hard job with less preparation than they deserved. It is a statement about what the building asks of everyone else, because an under-prepared colleague needs support that comes out of somebody’s week — usually the experienced special educator already carrying the largest caseload. A first-year special educator is short of both at once: short of the stock every new teacher lacks, and short of specialised knowledge the role needs on day one.

    What the data does not tell us is where inside a district those gaps land. The major review notes that few studies examined school poverty or student demographics at all. It is reasonable to suspect the shortfall concentrates in the schools least able to absorb it — but that has not been established, and a district that wants to know should look at its own vacancy and caseload numbers by school rather than assume either way.

    How good is the evidence behind any of this?

    Consistent in direction, weak in design, and worth knowing before you quote it at anybody. This literature has a myth problem, and a number that falls apart under scrutiny costs more than it gains.

    The major review of special educator attrition covers 30 studies from 2002 to 2017, and its accounting of itself is blunt. Only two of the 30 used methods permitting causal inference. Only 13 examined teachers actually leaving; the rest measured intent to leave or administrator perceptions, which are related but not the same. Mentoring, which teachers called valuable in the qualitative studies, showed insignificant direct effects on retention in the quantitative ones.

    The most recent burnout synthesis, covering 29 studies from 2013 to 2023, describes its own base as predominantly cross-sectional analyses of convenience samples — a snapshot of whoever responded, not a study over time.

    The co-teaching synthesis carries a limitation its authors state outright: in nearly a third of the studies, participants were selected as outstanding examples of co-teaching, which they say likely presents a more favourable picture than exists generally. That cuts in an unusual direction — it suggests the real picture is worse, not better — and that is a reason to hold the finding loosely, not a licence to assume the worse version.

    The number to stop repeating. “Seventy-five percent of special educators leave within five years” is a real finding — Illinois administrative data on teachers who entered between 1987 and 2001, 42 percent leaving teaching and 34 percent moving schools. One state, and a cohort that started work before most teachers now in classrooms were born. It is not a current national rate. The nearest national figure in the same review is older than it sounds too: 17.1 percent of special educators left their schools in 2012–13.

    And one finding that cuts against the simple story. A study of novice teachers in their first three years found, as expected, that special educators rated their workloads significantly less manageable than general educators did, and that workload manageability predicted emotional exhaustion, which predicted whether they meant to keep teaching. But the effects were stronger for the novice general educators. One reading is that special educators arrive expecting an unmanageable workload and are less shaken when they get one, which is not comforting. Another is that the measure misses what is heavy about this job. That study sampled elementary and middle school novices in two states, so it is not a high school result either.

    The honest summary: the direction is well supported and the fixes are not. Special educators consistently report heavier, less manageable workloads, name caseload and paperwork first when they leave, and are harder to replace than anyone in the building. What almost nothing here establishes is that any particular intervention fixes it.

    What can you actually check, and who do you take it to?

    Four things, all facts about the job rather than judgements about you. The point is to turn a feeling of being underwater into four numbers somebody with a title can act on. Short on time, which is the whole premise? Do items one and three only — five minutes, and the pair most likely to produce a change.

    Graphic showing a four-part workload audit: the caseload number and where it came from, compliance events counted per week for the next 60 days, co-planning time scheduled versus actual, and unfilled positions with whose work landed where.
    Four facts about the job. Counts and dates only, never a student’s name.
    1. The caseload number, and where it came from. How many students today, how many in August, who decided. If nobody in the building can name the rule it came from, that is itself the finding.
    2. Compliance events per week for the next 60 days. A count by week — meetings, evaluations, reviews. Not to panic about; to see whether the load is spread or stacked into two weeks that were always going to break.
    3. Co-planning time, scheduled versus actual. What the master schedule says you get with each co-teacher, and what you got last month. The gap is the request.
    4. Unfilled positions, and whose work landed where. What is vacant, what is covered provisionally, which pieces came to you.

    Three rules for keeping it. Write counts and dates, never names or initials — item two can identify a student with no name on it at all, because a dated meeting is traceable, which is why it is a count per week rather than a list. Keep it somewhere that is yours; a district device is not a private place to write that you are not coping. And keep it separate from compliance itself: this is a record of workload, not a log of deadlines you expect to be missed. If you believe a legal deadline is about to be blown, that goes to your coordinator today, on its own, in writing.

    It goes to the special education coordinator or department chair first, then whoever builds the master schedule. Open it as a question rather than a case — “here is what I am carrying, can we look at whether this is the intended distribution” lands differently from a document handed over in silence. Ask for the criterion rather than the favour: the conditions worth asking to have changed work better when the rule for who qualifies is written down first. A load lightened by private arrangement creates a fairness problem down the hall.

    If you are the only special educator in your building — common in small secondary schools — there is no department to take this to. The chain then runs to the district’s special education director, and sideways to a counterpart at another school or your state’s technical assistance center. Do not skip the step because the usual person does not exist.

    One thing this sheet is not. It is not a test, it produces no score, and it cannot tell you whether you are burned out. There is no validated cutoff that turns numbers into a finding about a person. If what you are carrying has stopped being about the job — if it follows you home, into the weekend, into how you feel about yourself — that is a conversation with your doctor or a counsellor, not with a worksheet. A short weekly record you can actually keep beats any one-off audit, because it shows a direction instead of a verdict.

    Are the students the reason?

    No. This needs saying directly, because “special education is exhausting” slides easily into “these students are exhausting,” and that is both untrue and corrosive.

    A caseload is a staffing decision. A compliance calendar is a federal statute. An unfilled position is a labour market. A co-teaching structure is a master schedule. Every load on this page came from an adult decision, and a student with an IEP is who those decisions exist to serve. Where the research finds this job heavy, it is heavy because of how it was resourced.

    And if you have an IEP and you have noticed your teacher is stretched: none of it is yours to carry. The services on your plan are yours by law regardless of how the building is staffed, asking for them is not making trouble, and a staffing shortage is never a reason to ask for less than you are owed.

    This matters practically as well as decently. A teacher who quietly concludes the students are the problem starts lowering the bar, and that is the one response that makes everything worse for everyone. Holding the bar where it belongs while the supports do their job is the whole design.

    What to do next

    Fill in the audit this week, or just items one and three. Most of it is already in your email and the master schedule. Then take the two biggest gaps to the person who can change them, in writing, as a question about the criterion rather than about you.

    If the answer is no, you have still done something useful: a written record of a load and a dated request is what makes a pattern visible when somebody finally asks why the position turned over again. And if the honest answer is that this job cannot be made survivable where you are, that is a real answer, not a failure of nerve. Nobody gets credit for absorbing a staffing shortfall until it breaks them.

    Want the audit as a printable? Download The Special Education Workload Audit (2 pages, free, no email required) and fill in items one and three before your next scheduling conversation.

    Frequently asked questions

    What causes burnout in special education teachers specifically?

    Three demands that do not appear on the general teacher-burnout list. Caseload is a negotiated number rather than a class size, set by state rule, district practice and how many positions are filled — and in one urban district’s exit survey, 33 percent of special educators who left named large caseloads as an important reason, more than any other factor. Paperwork was third in the same survey at 24 percent, and it lands differently because the deadlines sit inside a federal statute rather than a gradebook. And co-teaching is a relationship to negotiate rather than a resource to use: across 32 qualitative studies the special educator was repeatedly observed in a subordinate role, most of all at secondary level. The general demands — behavior, hours, out-of-pocket spending — apply on top of all three.

    Is special education teacher burnout worse than general education teacher burnout?

    The direction of the evidence says special educators carry more, but the size of the gap is not settled. Special educators report heavier and less manageable workloads, name caseload and paperwork first when they leave, and are the hardest group in the country to replace. Against that, a study of novice teachers in their first three years found that although special educators rated their workloads significantly less manageable, the link running from workload manageability through emotional exhaustion to career intentions was actually stronger for the novice general educators. That study sampled elementary and middle school novices in two states, so it is not a high school result. The honest answer is that the job is differently loaded, and that anyone claiming a precise multiplier is going beyond what the research supports.

    Do 75 percent of special education teachers really quit within five years?

    Not as a current national figure. That number is real but it comes from Illinois administrative data on teachers who entered the profession between 1987 and 2001 — 42 percent leaving teaching and 34 percent moving schools. One state, and a cohort that started work before most teachers now in classrooms were born. It should not be quoted as today’s rate. The nearest national figure in the same literature review is also older than it sounds: 17.1 percent of special educators left their schools in 2012–13. Leaving is also not the same thing as burning out; people move for pay, family, geography and promotion.

    How big should a special education caseload be?

    No study answers that, and no national standard sets it. Caseload limits, where they exist at all, are set by state rule and vary widely, and the actual number a teacher carries also depends on district practice and how many positions are currently filled. What the research establishes is that caseload is what special educators name first when they leave, not what a defensible ceiling would be. The practical move is not to argue for a number but to ask what rule your building used to arrive at yours — if nobody can name one, that is itself worth putting in writing.

    What can a principal or district actually change about this?

    Three things, all of them scheduling or staffing decisions rather than encouragement. Co-planning time is the clearest: in the co-teaching research teachers reported about 45 minutes a week and said they needed roughly three times that, and the authors note it was discussed almost entirely as a question of administrative support. Caseload distribution is the second, and it is negotiated in a scheduling meeting. The third is how the work of unfilled or provisionally covered positions gets allocated, which currently tends to land on whoever is most experienced. Whatever is changed, write the criterion for who qualifies before applying it to anybody — a load lightened by private arrangement creates a fairness problem down the hall.

    I am a parent and my child’s special education teacher seems overwhelmed. What should I do?

    Ask the school about staffing rather than about the teacher. The useful questions are whether the position is fully staffed, what the caseload is, and whether the services on your child’s plan are being delivered as written — those are answerable and they are the school’s responsibility. Your child’s entitlement to the services on the plan does not depend on how the building is staffed, so raising a gap in delivery is entirely reasonable. What is worth avoiding is treating an individual teacher’s apparent state as the subject, both because a teacher’s wellbeing is not a matter for the class group chat and because the loads described on this page are almost entirely produced by decisions made above the classroom.

    I am a student with an IEP. Is my teacher stressed because of me?

    No. A caseload is a staffing decision, a compliance calendar is a federal statute, an unfilled position is a labour market and a co-teaching structure is a master schedule. Every load described on this page came from an adult decision, and none of it is yours to carry or to fix. The services on your plan are yours by law regardless of how your school is staffed, asking for them is not making trouble, and a staffing shortage is never a reason to ask for less than you are owed. If you are worried about a teacher, talk to a counselor about the class rather than about the person.

    Is there a test that tells you whether you have special education teacher burnout?

    No, and this site does not publish one. Burnout is an occupational condition rather than a clinical diagnosis, and the research instruments used to measure it lack a clinically validated cutoff, which means there is no threshold that turns a set of answers into a finding about an individual person. A checklist can tell you useful things about your job — how big the caseload is, how the compliance load is distributed, how much co-planning time you actually get — and that is what the audit on this page does. If what you are carrying has stopped being about the job, that is a conversation with your doctor or a counsellor, not with a worksheet.

    Sources

    • Billingsley, B., & Bettini, E. (2019). Special education teacher attrition and retention: A review of the literature. Review of Educational Research, 89(5), 697–744. A systematic review of 30 studies published between 2002 and 2017. Source of the 33 percent caseload and 24 percent paperwork figures (from Billingsley, 2007 — 99 special educators who left or moved from one large urban district over three years), the 17.1 percent national attrition figure for 2012–13 (Goldring, Taie & Riddles, 2014), and the “75 percent within five years” figure (DeAngelis & Pressley, 2011 — Illinois administrative data, 1987–2001). Limitations stated by the authors: only two of the 30 studies used methods permitting causal inference, only 13 examined teachers actually leaving rather than intent to leave, and few studies examined school poverty or student demographics. journals.sagepub.com
    • Brunsting, N. C., Morin, L. E., Gómez, L. R., Jones, B., Bettini, E., Cumming, M. M., Garwood, J. D., & Ruble, L. A. (2026). Burnout and occupational wellbeing of special education teachers: Recent research synthesized. Review of Educational Research. A synthesis of 29 studies published between 2013 and 2023, extending the 2014 Brunsting, Sreckovic & Lane synthesis. The authors describe the evidence base as predominantly cross-sectional analyses of convenience samples and call for longitudinal and intervention designs. journals.sagepub.com
    • Scruggs, T. E., Mastropieri, M. A., & McDuffie, K. A. (2007). Co-teaching in inclusive classrooms: A metasynthesis of qualitative research. Exceptional Children, 73(4), 392–416. 32 qualitative reports covering 454 co-teachers, 42 administrators, 142 students, 26 parents and 5 support personnel. Source of the subordinate-role finding, the secondary-level intensification, and the 45.5 minutes of weekly joint planning against a stated need of roughly three times that. Limitation stated by the authors: in nearly a third of the investigations participants were selected as outstanding examples of co-teaching, which they say likely presents a more favourable picture of co-teaching than exists in general. ncipp.education.ufl.edu (PDF)
    • Bettini, E., Jones, N., Brownell, M., Conroy, M., Park, Y., Leite, W., Crockett, J., & Benedict, A. (2017). Workload manageability among novice special and general educators: Relationships with emotional exhaustion and career intentions. Remedial and Special Education, 38(4), 246–256. Novice teachers in their first three years, drawn from the Michigan–Indiana Early Career Teacher Study. Special educators rated workload manageability significantly lower than general educators; workload manageability predicted emotional exhaustion, which mediated the relationship with intentions to keep teaching. Effects were stronger for novice general educators, and the sample was elementary and middle school teachers in two states — not a high school result. journals.sagepub.com
    • National Center for Education Statistics (2024). School Pulse Panel, hiring and vacancies collection. 1,392 participating public K–12 schools, surveyed 13–27 August 2024. Special education was the hardest teaching area to staff: 74 percent of elementary and of middle and combined schools and 66 percent of high schools reported difficulty filling those vacancies, and only 77 percent of filled special education vacancies went to a fully certified teacher — eleventh of thirteen subject areas, against 89 percent for social studies. ies.ed.gov
    • CADRE (Center for Appropriate Dispute Resolution in Special Education). IDEA dispute resolution data summary for U.S. and outlying areas. Data for the 2021–22 school year, reported by states under IDEA Section 618: 29,490 due process complaints filed, 2,645 fully adjudicated, 6,160 written state complaints filed and 10,806 mediation requests; due process filings rose from 17,118 in 2011–12, and the share still pending at year end rose from 12 percent to 43 percent over the same decade. A more recent summary covering 2023–24 exists but could not be opened from this session, so only the 2021–22 figures are used here. cadreworks.org (PDF)

    Every source above was opened and read for this article. Where a figure could not be confirmed in the original, it is not on this page.


    About Clay Shumate

    Clay Shumate is a certified secondary Social Studies teacher in the public schools of West Alabama, with seven years of classroom experience, a B.A. in History, and an M.Ed. in Secondary Education. He writes about project-based learning, student responsibility, respect, and practical ways to hold young people to a higher standard while giving them room to learn from mistakes.

Teacher Emergency Toolkit — practical resources, real classroom support. Shop on TPT.Teacher Emergency Toolkit — practical resources, real classroom support. Shop on TPT.