Category: Assessment & Feedback

Checking for understanding, feedback, and assessment that changes what happens next.

  • A List of Formative Assessment Strategies That Work in Real Classrooms

    A List of Formative Assessment Strategies That Work in Real Classrooms

    By Clay Shumate

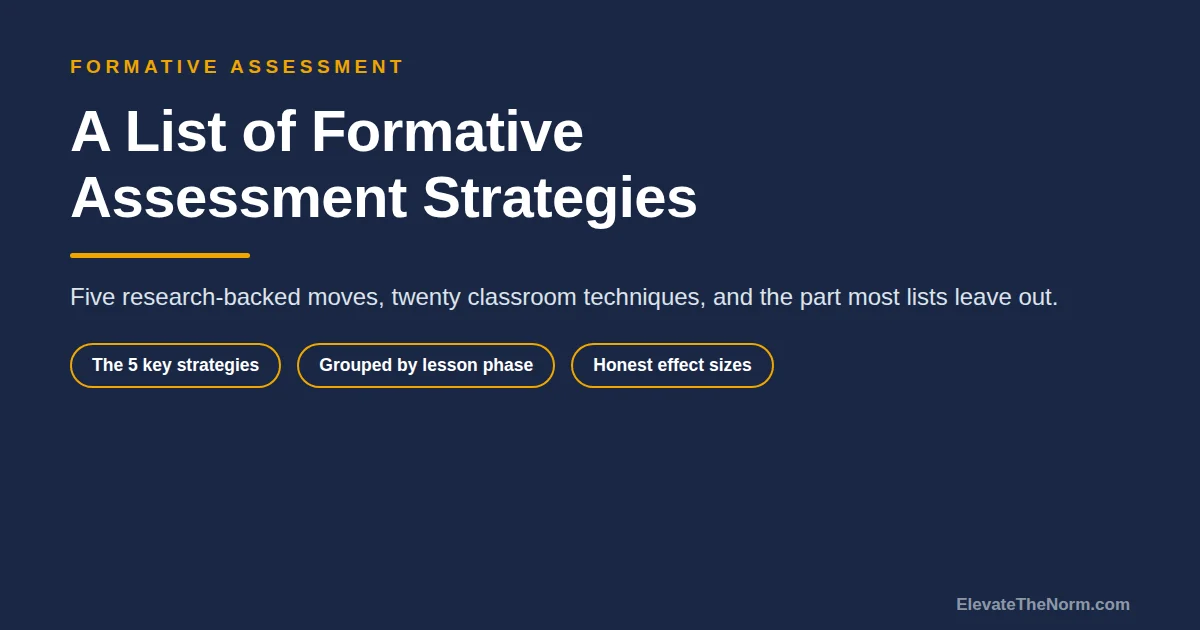
    Formative assessment strategies are the moves a teacher makes to find out what students understand while there is still time to do something about it. Not a quiz average. Not a unit test. A signal you collect during the lesson and act on before the lesson is over. Below is a working list of them — organised by the five strategies the research actually names, then by the point in the period where you would reach for each one.

    One warning before the list: collecting the information is the easy half, and it is the half most lists stop at.

    Key Takeaways

    • There are five key formative assessment strategies, not fifty. Everything else on this page is a technique serving one of them.
    • A technique is only formative if you change something because of it. An exit ticket you never read is a closing routine, not an assessment.
    • The honest effect size is about 0.20, not 0.70. Real, worth doing, not magic.
    • Attaching a grade undercuts the feedback. Comments alone outperformed comments-plus-a-grade in the most-cited study on this.
    • Pick two techniques and run them for a month rather than sampling twenty. The routine is what produces the data, not the novelty.

    What Are Formative Assessment Strategies?

    A formative assessment strategy is any deliberate method for gathering evidence of student understanding during instruction and using that evidence to adjust what happens next. The two halves are equally load-bearing. Gathering evidence you never use is not formative assessment; it is data collection. Adjusting instruction based on a hunch is not formative assessment either; it is guessing.

    The distinction people usually reach for is timing — formative during, summative after — and that is mostly right but slightly off. A unit test can be used formatively if you read it, find that two-thirds of the class missed the same standard, and reteach it. A daily exit ticket is not formative if it goes in a pile. The word describes what you do with the information, not when you collected it. If you want the slips themselves, I give away ten free exit ticket templates for secondary classrooms.

    What Are the 5 Formative Assessment Strategies?

    The framework almost every other list is downstream of comes from Siobhan Leahy, Christine Lyon, Marnie Thompson and Dylan Wiliam, writing in Educational Leadership in 2005. They identified five core strategies:1
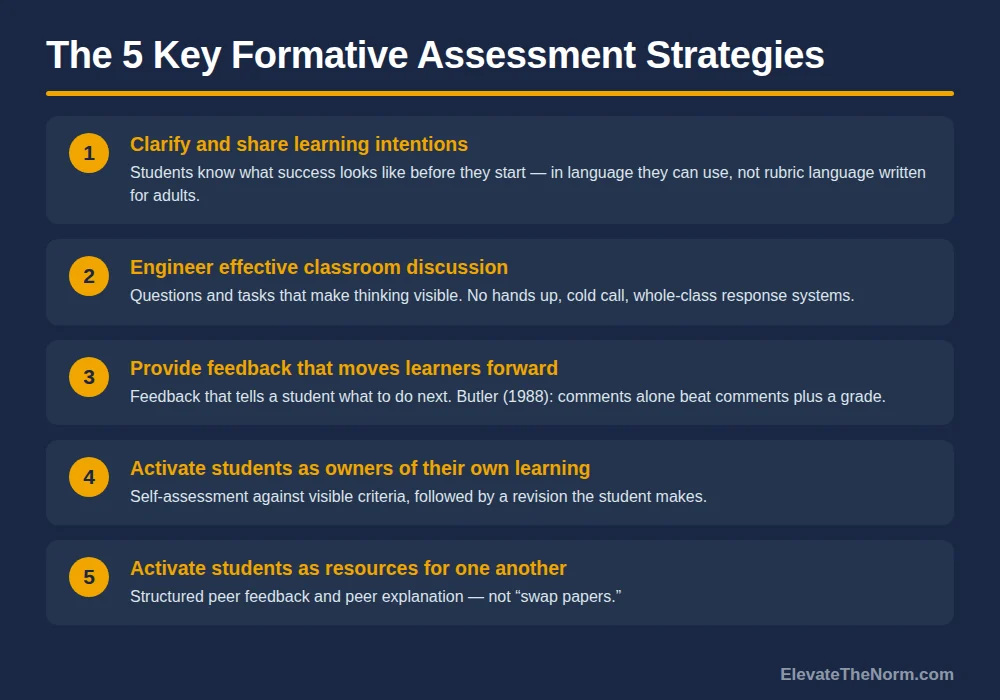
    Numbered graphic listing the five key formative assessment strategies: clarify and share learning intentions, engineer effective classroom discussion, provide feedback that moves learners forward, activate students as owners of their own learning, and activate students as resources for one another
    The five key strategies identified by Leahy, Lyon, Thompson and Wiliam (2005).
    1. Clarifying and sharing learning intentions and criteria for success. Students cannot hit a target they cannot describe.
    2. Engineering effective classroom discussions, questions and tasks that elicit evidence of learning. The key word is engineering — designing the question so that the answer tells you something.
    3. Providing feedback that moves learners forward. Feedback that describes the gap and names the next action.
    4. Activating students as owners of their own learning. Self-assessment and self-monitoring.
    5. Activating students as instructional resources for one another. Structured peer feedback and peer explanation.

    Notice that only the second one is about collecting information. The other four are about what surrounds the collection — whether students know the target, whether the feedback is usable, and whether students can act on it without you. That ratio is the whole point, and it is why a list of twenty exit-ticket variations is not a formative assessment programme.

    A List of Formative Assessment Strategies You Can Use Tomorrow

    These are the techniques, grouped by where they fit in a period. None of them requires technology, a purchase, or a planning period you do not have.
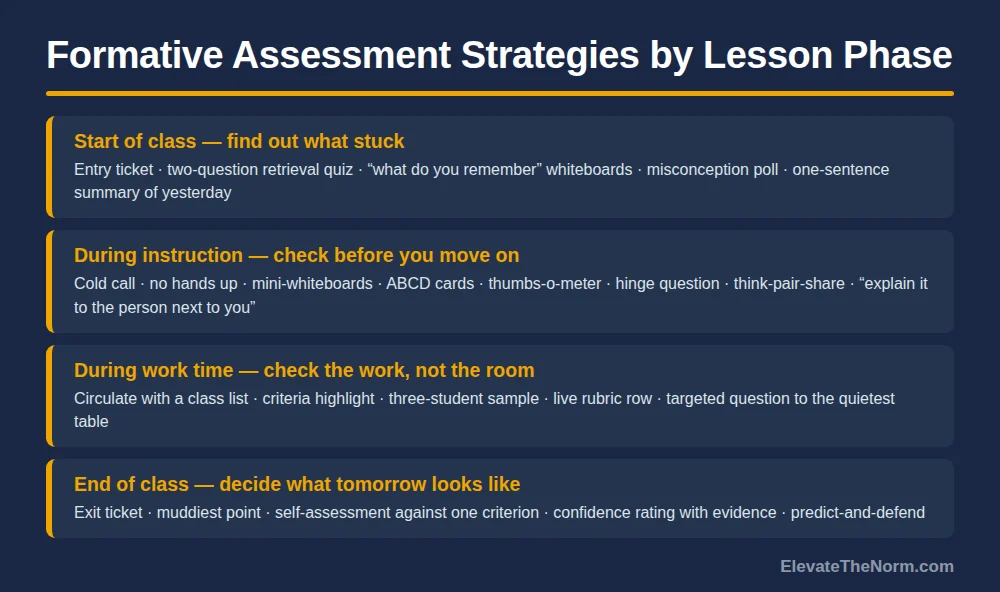
    Reference chart grouping formative assessment techniques by lesson phase: start of class, during instruction, during work time, and end of class, with specific techniques listed under each
    The same techniques, sorted by when in the lesson you would actually reach for them.

    Start of class — find out what survived the night

    • Entry ticket. Two questions on yesterday’s material, answered before anything else happens.
    • Retrieval quiz, ungraded. Three questions, self-scored, no record kept. The point is the retrieval, not the score.
    • Misconception poll. Offer the wrong answer students usually give as one of the options and see how many take it.
    • One-sentence summary of yesterday. Fast, and the vagueness of the sentences tells you as much as the content.

    During instruction — check before you move on

    • Cold call with no hands up. Hands-up sampling tells you what your four most confident students think. Nothing else.
    • Mini-whiteboards. Every student answers, every answer is visible at once, and it takes eight seconds. Still the highest-yield low-tech move available.
    • Hinge question. One multiple-choice question at the pivot point of the lesson, written so each wrong option corresponds to a specific misunderstanding. If more than a quarter of the room misses it, you do not go on.
    • ABCD cards or finger votes. A mini-whiteboard substitute when you have thirty seconds and no markers.
    • Think-pair-share with a required report-out. The report-out is what makes it assessment rather than conversation.
    • Ask a student to explain it to the person beside them. Explanation exposes gaps that recognition hides.

    During work time — assess the work, not the room

    • Circulate with a class list. Tick who you actually looked at. Most of us overestimate this badly.
    • The three-student sample. Read one strong, one middling and one struggling student’s work in the first five minutes. You will know whether the task is landing before you have wasted the period.
    • Criteria highlight. Students mark the sentence or step meeting each criterion. What they cannot highlight is the revision.
    • Live rubric row. Score one row of the rubric, out loud, on a volunteer’s work, on the document camera.

    End of class — decide what tomorrow looks like

    • Exit ticket. One question. One that actually discriminates — not one everybody gets right.
    • Muddiest point. “What is still unclear?” Students are more honest here than on a content question.
    • Self-assessment against one criterion. Not the whole rubric. One row.
    • Confidence rating with evidence. A number plus one sentence defending it. The sentence is the data.

    A note on cold call, because it is easy to do badly

    Cold call is the most effective technique on that list and the one most likely to go wrong. Done carelessly it is a gotcha, and a teenager who has been embarrassed in front of thirty peers will not take a risk in your room again for a long time. Three things make it safe. Ask the question, then pause, then name the student — so everyone has to think, and the named student has had the same processing time as everyone else. Accept “I need a minute” and come back to them, genuinely, so it is not a way out but is also not a trap. And make a wrong answer useful out loud — “that is the answer most people give, and here is why it is tempting” — so being wrong in public is survivable. Students who need more processing time, students still acquiring English, and students with anxiety-related plans all benefit from the pause; so does everyone else. There is a longer, more careful treatment of running cold call without the gotcha, including what the research does and does not support for grades 6–12.

    The same principle applies to every technique here. A student will only tell you honestly that they do not understand something if doing so is safe. Every formative assessment strategy on this page depends on that, and none of them will work in a room where it is not true.

    If you want these in a printable form rather than rebuilding the list each term, the four-page pack that matches each check to the decision it answers collects them in one place. No email required.

    The Part Most Lists Skip: What You Do With the Information

    Here is the failure I would bet on if I walked into a school that had just done a formative assessment PD day. Teachers will be running exit tickets. Very few will have changed a lesson because of one.
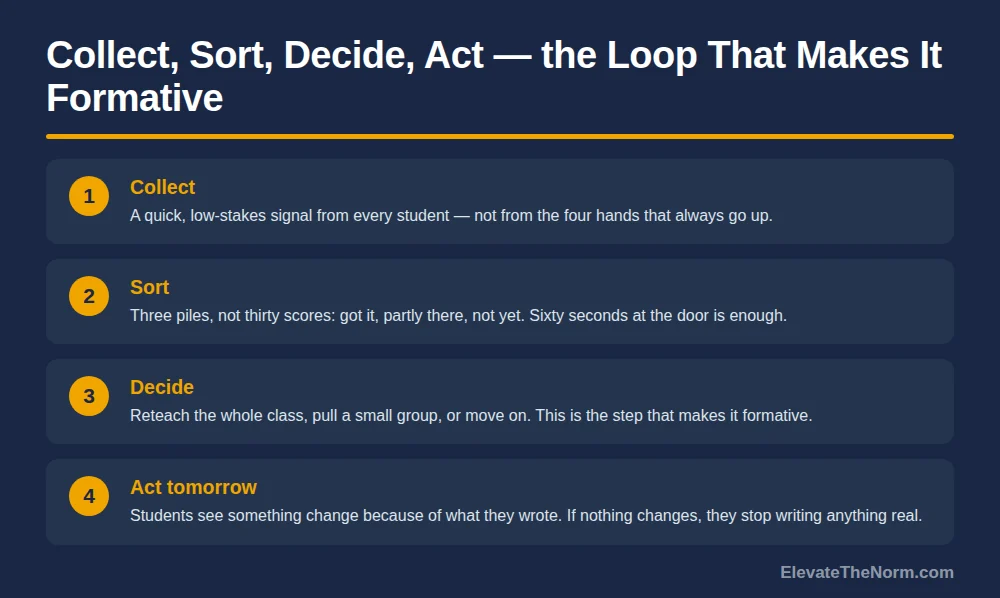
    Four-step process graphic showing the formative assessment response loop: collect a signal from every student, sort responses into three piles, decide whether to reteach or move on, and act on it the next day
    Collecting the information is the easy half. The loop only becomes formative at step three.

    Collect. A signal from every student, not from volunteers. This is the part everyone already does.

    Sort. Three piles, not thirty scores: got it, partly there, not yet. You can do this standing at the door as students leave. Sixty seconds. Resist the urge to record anything.

    Decide. Reteach the whole class, pull a small group tomorrow, or move on. That is the entire decision space, and making it is what converts a technique into formative assessment. If the answer is always “move on,” your question was not discriminating enough to be worth asking.

    Act, visibly. Students need to see something change because of what they wrote. Say it out loud: “Eleven of you missed the second question yesterday, so we are starting there.” A class that never sees its exit tickets change anything will start writing whatever gets them out the door fastest, and they will be right to.

    What the Evidence Honestly Shows

    Formative assessment has a reputation problem of the unusual kind: it is oversold, and the overselling has made careful people suspicious of something that is genuinely worth doing.

    The number you have heard in a staff meeting is probably 0.70. It traces to Paul Black and Dylan Wiliam’s landmark 1998 review, which cited a 1986 meta-analysis by Fuchs and Fuchs reporting a mean effect of 0.70 across 21 studies — rising to 0.92 where teachers systematically reviewed the data and planned a response, against 0.42 where the response was left to teacher judgment.2 That last contrast is the most useful thing in the whole literature for a practising teacher, and it almost never gets quoted. Black and Wiliam themselves attached a caveat that also rarely travels: there is “no guarantee that it will do so irrespective of the context and the particular approach adopted.”2

    Then the correction. Neal Kingston and Brooke Nash screened more than 300 K–12 formative assessment studies and concluded that most had “severely flawed research designs yielding uninterpretable results.” Thirteen were usable. Across those thirteen, the weighted mean effect size was 0.20, median 0.25 — and they published the paper explicitly as a corrective to the 0.70 figure.3 By subject: 0.32 in English language arts, 0.17 in mathematics, 0.09 in science. Professional development and computer-delivered implementations came in around 0.30 and 0.28.

    An effect of 0.20 is not nothing. It is a modest, real gain from a practice that costs no money and adds no grading. But it is not the transformation the 0.70 implies, and the subject variation should make a science department sceptical of a one-size district mandate. If a consultant quotes you 0.70 without mentioning Kingston and Nash, you now know more than they do.

    One more finding worth building policy around. In a study Black and Wiliam highlight, Ruth Butler found students given comments only improved substantially, while students given comments alongside a grade showed a significant decline — the grade appears to crowd out the comment entirely.2 If your formative assessment initiative ends with a number in the gradebook, you may have spent the effort and cancelled the benefit.

    Additional Formative Assessment Strategies for Specific Situations

    When the class is too large to read everything. Sample deliberately rather than comprehensively. Three students per period, rotated, gets you a picture of the whole room across a week without a single extra hour of reading.

    When students will not write anything real. Usually a trust problem, not a compliance one. Make it anonymous for two weeks, act visibly on what comes back, then put names on it.

    When you teach a skills subject rather than a content subject. Watch the process, not the product. A student who arrives at the right answer by a method that will fail next week has not understood it, and only the process shows you that.

    When you need it to survive a substitute or a bad week. Pick the two lowest-effort techniques on this page — an entry ticket and a hinge question — and run only those. A routine that survives a bad week beats a system that collapses in one.

    When students need to own it themselves. That is the fourth strategy on the list above, and it is substantial enough to have its own guide: what student self assessment is and how to introduce it without losing a week of class.

    What Goes Wrong

    Collecting more than you can act on. Four techniques in one period produces a pile of paper and no decisions. Two per week, acted on, beats ten per week filed.

    Questions that do not discriminate. If everyone gets it right, you learned nothing. A good hinge question should split the room.

    Grading it. See Butler, above. The moment it counts, students optimise for the score rather than tell you the truth.

    Mistaking participation for understanding. A lively discussion carried by six students tells you about six students. This is what the general discipline of asking every student for evidence is for, and it is why every-student-responds techniques beat hands-up every time. When discussion itself is the format you want, the fix is structural rather than motivational: a text-anchored seminar that requires a written question from every student puts a prepared contribution in every hand before the circle opens.

    Making it an initiative. Formative assessment implemented as a compliance requirement — exit tickets collected and audited by an administrator — produces exit tickets and no instructional change. The 0.92-versus-0.42 contrast in the Fuchs data points at teachers systematically reviewing and planning, which is professional judgment, not paperwork.2

    Where This Connects

    Formative assessment only pays off if the grading system it feeds can absorb it. A grading scale built on four proficiency levels instead of percentages makes that easier, because evidence gathered mid-unit has somewhere to go that is not an average. And the mirror-image practice for the adult in the room is the same loop turned on your own teaching, written out entry by entry — same logic, different subject.

    Where to Start

    Writing is the one place where this general list does not transfer cleanly, because a draft takes days and is too long to read thirty times a week; the checks built for writing are a separate set, and the five checks built for reading a text are another. Do not try to implement a list of formative assessment strategies. Pick two. One at the start of class and one at the end is a reasonable pairing — an entry ticket and an exit ticket, or a hinge question and a muddiest point. Run them for a month without adding anything. Sort the results into three piles and let one decision each week come from that sorting. My Daily Bell Ringers on TPT give students a short journal prompt to start on the moment they sit down.

    That is a smaller ambition than most professional development sells, and it is the version that is still running in March. The techniques on this page are not the hard part. Changing a lesson because of what a student wrote is the hard part, and it is the only part that makes any of it formative.

    Teaching science? Our companion piece on formative assessment strategies in science focuses on the checks that surface a misconception before the unit test.

    Frequently Asked Questions

    What are the 5 formative assessment strategies?

    Leahy, Lyon, Thompson and Wiliam named five in Educational Leadership in 2005: clarifying and sharing learning intentions and success criteria; engineering classroom discussions, questions and tasks that elicit evidence of learning; providing feedback that moves learners forward; activating students as owners of their own learning; and activating students as instructional resources for one another. Every technique on this page serves one of those five.

    What is the difference between formative and summative assessment?

    Summative assessment measures what a student has learned at the end of something and produces a record. Formative assessment gathers evidence during learning and produces a decision about what to do next. The cleanest test is not timing but consequence: if nothing about your teaching changes because of it, it was not formative, whatever it was called.

    Should formative assessment be graded?

    Generally no. In a study highlighted in Black and Wiliam’s 1998 review, Ruth Butler found students who received comments only improved substantially while students who received the same comments with a grade attached showed a significant decline. The grade appears to crowd out the comment. If credit must be given, give it for completing and acting on the work, not for how correct the first attempt was.

    Is cold call unfair to anxious or quiet students?

    It can be, and how you run it decides. Ask the question first, pause, then name the student, so everyone thinks and the named student gets the same processing time. Accept a request for a moment and genuinely come back. Treat wrong answers as useful information out loud. Handled that way, cold call reaches the students that hands-up questioning silently skips, which is usually the students who most need reaching.

    How many formative assessment strategies should I use in one lesson?

    One or two, and the same one or two for weeks. Four techniques in a period generates a pile of information and no decisions. The routine is what produces usable data, not the variety. Pick an entry point and an exit point, run them for a month, and let one instructional decision each week come out of them.

    How does this work for students with IEPs, 504 plans, or English learners?

    Build in processing time and give more than one way to respond. A pause before naming a student, a written option alongside a verbal one, sentence stems, and mini-whiteboards instead of on-the-spot speaking all widen access without changing the technique. These adjustments help the whole room, which is usually the sign that they are the right ones.

    Why does my child seem to be assessed every single day?

    Because these checks are not tests. Most take under two minutes, almost none are graded, and their purpose is to tell the teacher what to teach tomorrow rather than to judge your child. A student who writes down that they are confused has done the task correctly. If any of it is going into a gradebook, that is a fair question to ask the teacher, because the research suggests it should not be.

    Does formative assessment actually raise test scores?

    Modestly, on the best available evidence. Kingston and Nash screened more than 300 K-12 studies, found only 13 methodologically usable, and reported a weighted mean effect size of 0.20 with a median of 0.25, varying by subject from 0.32 in English language arts to 0.09 in science. That is a real gain from a practice that costs nothing, but it is well short of the 0.70 often quoted in professional development.

    Sources

    1. Leahy, Siobhan, Christine Lyon, Marnie Thompson, and Dylan Wiliam. “Classroom Assessment: Minute by Minute, Day by Day.” Educational Leadership, vol. 63, no. 3, November 2005, pp. 18–24. ERIC EJ745452. https://eric.ed.gov/?id=EJ745452
    2. Black, Paul, and Dylan Wiliam. “Assessment and Classroom Learning.” Assessment in Education: Principles, Policy & Practice, vol. 5, no. 1, 1998, pp. 7–74. (Full text copy hosted by UC Riverside; includes the Fuchs & Fuchs 1986 and Butler 1988 findings discussed above.) https://assess.ucr.edu/sites/default/files/2019-02/blackwiliam_1998.pdf
    3. Kingston, Neal, and Brooke Nash. “Formative Assessment: A Meta-Analysis and a Call for Research.” Educational Measurement: Issues and Practice, vol. 30, no. 4, 2011, pp. 28–37. ERIC EJ951173. https://eric.ed.gov/?id=EJ951173
    4. Andrade, Heidi L. “A Critical Review of Research on Student Self-Assessment.” Frontiers in Education, vol. 4, art. 87, 2019. https://doi.org/10.3389/feduc.2019.00087
    5. Panadero, Ernesto, Anders Jonsson, and Juan Botella. “Effects of self-assessment on self-regulated learning and self-efficacy: Four meta-analyses.” Educational Research Review, vol. 22, 2017, pp. 74–98. https://doi.org/10.1016/j.edurev.2017.08.004
    About Clay Shumate

    Clay Shumate is a certified secondary Social Studies teacher in the public schools of West Alabama, with seven years of classroom experience, a B.A. in History, and an M.Ed. in Secondary Education. He writes about project-based learning, student responsibility, respect, and practical ways to hold young people to a higher standard while giving them room to learn from mistakes. He is a member of the Society of Professional Journalists and writes to its Code of Ethics; this site’s editorial standards and corrections policy are published in full. More about Clay.

  • What Is Student Self Assessment? A Practical Guide for Grades 6–12

    What Is Student Self Assessment? A Practical Guide for Grades 6–12

    By Clay Shumate

    Student self assessment is the practice of having students judge their own work against criteria they can see and understand, while there is still time to improve it. Done before the grade, it is one of the more useful things a teacher can hand a class. Done after the grade, as a number that counts, it mostly teaches students to inflate.

    That distinction — formative before, not summative after — is the whole argument of this article, and it is the part most schools skip.

    Key Takeaways

    • Self-assessment is a judgment against criteria, not a feeling about effort. “I worked hard” is not self-assessment. “My thesis states a position but my second paragraph never supports it” is.
    • Formative and summative self-assessment are not the same practice. The research supports the first far more comfortably than the second.
    • The honest effect sizes are modest, not miraculous. Anyone selling you a 0.70 is quoting a number with a long history of caveats.
    • Accuracy is the wrong first question. The point is not whether a fifteen-year-old guesses the right score. It is whether they can find the gap in their own work.
    • Four weeks of small steps beats one big rollout. Students cannot apply criteria they have never been taught.

    What Is Student Self Assessment?

    Student self assessment is a structured process in which a student compares their own work to a set of stated criteria, identifies where the work does and does not meet those criteria, and then does something about the gap. Three parts, and all three have to be there. A rating with no criteria is a guess. Criteria with no follow-up action is paperwork.

    It is worth separating this from two things it gets confused with. It is not self-grading, where a student assigns themselves a score that lands in the gradebook. And it is not reflection in the loose sense — the end-of-unit “what did you learn about yourself” paragraph that produces a stack of pleasant, unusable sentences. Reflection has its place. This is a narrower and more mechanical thing: here is the standard, here is my work, here is the distance between them.

    Paul Black and Dylan Wiliam, in the review that largely launched the modern formative assessment movement, put the case for it about as strongly as it can be put, citing Royce Sadler’s argument that self-assessment is “a sine qua non for effective learning” — a student who cannot tell good work from their own work has no way to close the gap without an adult standing over them.1 That is a theoretical claim, not an empirical one, and it is worth saying so. But it is a sound one. Every student eventually leaves a classroom where someone else is holding the rubric.

    Formative or Summative? The Distinction That Decides Whether It Works

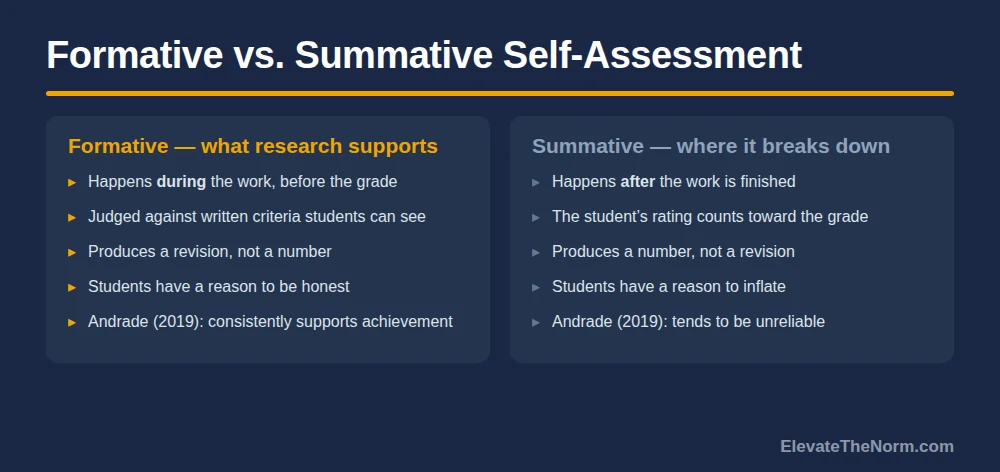
    Heidi Andrade’s 2019 review in Frontiers in Education examined 76 empirical studies published between 2013 and 2018, and the cleanest finding in it is a split.2 Formative self-assessment — ungraded, criteria-referenced, attached to a chance to revise — consistently supported achievement. Summative self-assessment, where the student’s own rating counted toward the final mark, did not hold up nearly as well, and produced a predictable problem: students inflated their estimates, with males over-estimating more than females.

    This should not surprise anyone who has taught teenagers. If you tell a student their number goes in the gradebook, you have not asked them to assess their work. You have asked them to negotiate. The honest answer and the advantageous answer point in opposite directions, and you have handed them the pen.

    Andrade makes a second point that is easy to miss and worth sitting with: she argues the field’s long preoccupation with accuracy — how closely a student’s self-rating matches a teacher’s — may be the wrong question, and that what matters more is the cognitive and affective work happening inside the student while they do it.2 That reframes the classroom goal. You are not training students to predict your grading. You are training them to look at their own paragraph and see what is missing.

    Two-column comparison chart showing formative student self assessment happening during the work against written criteria and producing a revision, versus summative self assessment happening after the work and counting toward the grade
    Formative self-assessment happens before the grade; summative self-assessment counts toward it. The research treats them very differently.

    The practical rule that falls out of this is short enough to put on a sticky note: the student’s self-assessment never becomes the grade. The improved work becomes the grade. Keep that line and most of the failure modes below never start. The same rule holds for the forward-facing half of this work: a goal a student sets is instrumentation, not a grade, and grading it is how you get goals set low enough to guarantee.

    What the Research Actually Shows — Including the Unimpressive Parts

    Here is where a lot of professional development goes wrong, so it is worth being precise.

    The most rigorous quantitative work on self-assessment specifically is Ernesto Panadero, Anders Jonsson and Juan Botella’s 2017 set of four meta-analyses, covering 19 studies and 2,305 students.3 On self-efficacy — a student’s belief that they can do the work — they found a large effect, d = 0.73 across 27 comparisons. On self-regulated learning, the effect was much smaller: d = 0.23 across 12 comparisons.

    Those numbers come with conditions the authors state plainly, and skipping them would be dishonest. Their publication-bias analysis suggested the self-efficacy effect is probably overestimated in magnitude, though they were satisfied the effect itself is real. The sample skewed roughly 70% female. The mean age was 17.5, ranging from 10.5 to 26 — ten of the nineteen studies were in secondary schools, which makes this more relevant to grades 6–12 than most assessment research, but eight were in higher education. And two of the four analyses rested on six and three studies respectively, which the authors themselves call too few for reliable bias testing.

    Now the wider counterweight. Neal Kingston and Brooke Nash screened more than 300 studies of formative assessment in K–12 and found that most had “severely flawed research designs yielding uninterpretable results.” Thirteen survived. The weighted mean effect size across those thirteen was 0.20, with a median of 0.25 — and they published it specifically as a correction to the widely repeated 0.70 figure.4 Effects varied sharply by subject: 0.32 in English language arts, 0.17 in mathematics, 0.09 in science.

    That 0.70, for the record, traces back through Black and Wiliam to a 1986 meta-analysis by Fuchs and Fuchs, and Black and Wiliam themselves attached a caveat to it that almost never travels with the number: there is, they wrote, “no guarantee that it will do so irrespective of the context and the particular approach adopted.”1

    So what is a teacher supposed to do with all that? Something like this: self-assessment is a reasonable, low-cost, well-supported classroom practice with a real but moderate payoff, strongest on students’ confidence and willingness to revise. It is not a program, it does not need a budget, and it will not move a school’s scores by itself. Anyone promising otherwise is selling something.

    Five Student Self Assessment Ideas That Fit in One Class Period

    These are deliberately small. A self-assessment that eats thirty minutes will get cut the first week the pacing guide gets tight, which means it will never become a habit. Each of these runs in four to ten minutes.

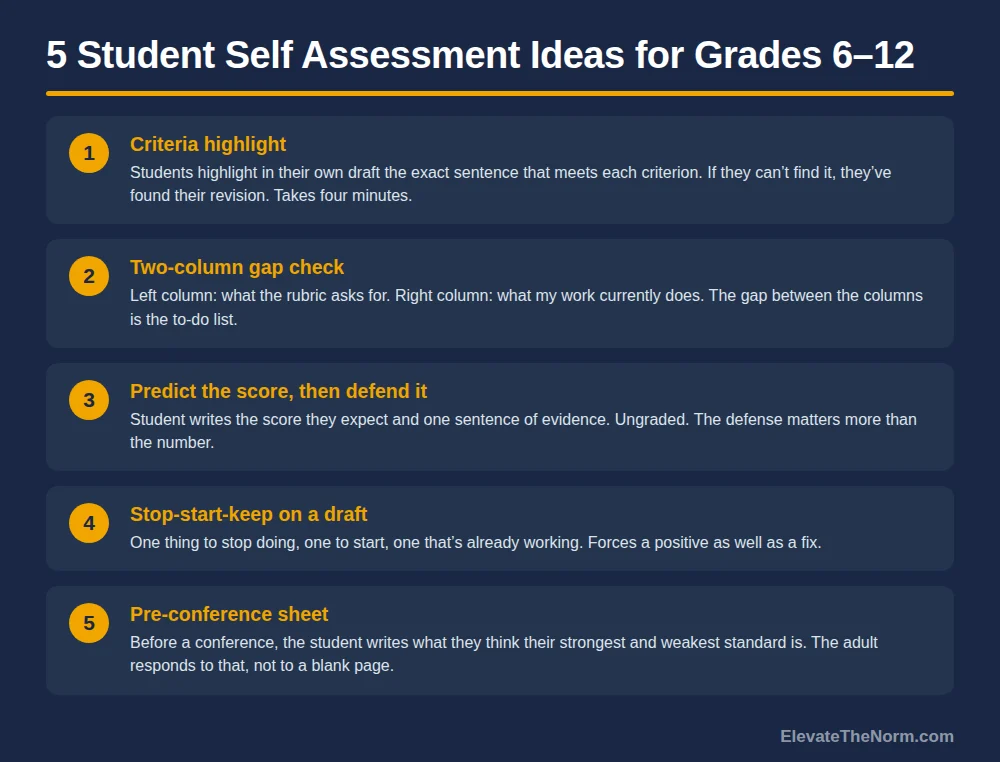
    Numbered list graphic of five student self assessment ideas: criteria highlight, two-column gap check, predict the score then defend it, stop-start-keep on a draft, and pre-conference sheet
    Five student self assessment ideas that fit inside a normal class period.

    1. The criteria highlight

    Students take their own draft and highlight the exact sentence that satisfies each criterion on the rubric — one color per row. The instruction is deliberately unforgiving: if you cannot find the sentence, you cannot highlight it. Students who finish with a blank criterion have just diagnosed their own revision without you saying a word. This is the single highest-yield version for writing-heavy courses. It sits inside a wider set of checks built for writing rather than recall.

    2. The two-column gap check

    Left column: what the assignment asks for, in the student’s own words. Right column: what their work currently does. The gap between the columns is the to-do list. Rewriting the criteria in their own words is half the value here — students who cannot restate the requirement usually did not understand it, and now you both know that.

    3. Predict the score, then defend it

    The student writes the score they expect and one sentence of evidence for it. Ungraded, always. The sentence is the assessment; the number is just the hook that makes them write it. When you hand the work back, the interesting conversations are with the students whose prediction was furthest off in either direction — and the under-predictors matter as much as the over-predictors.

    4. Stop, start, keep

    One thing to stop doing, one to start, one that is already working. The third one is not filler. Students who only ever hear what is broken stop believing the feedback, and a student who cannot name a single thing they do well is not going to revise with any confidence.

    5. The pre-conference sheet

    Before any conference, the student writes which standard they think they are strongest on and which they are weakest on. You respond to that instead of to a blank page. This is also the cleanest on-ramp into student-led conferences, where the student is expected to walk an adult through their own evidence. Those meetings can take a lot of different shapes — there is a breakdown of sixteen conference formats for grades 6–12 if you are deciding which one fits your schedule.

    If you want these as a printable rather than something you rebuild every term, the printable pack that asks for evidence behind every rating on this site cover the same ground in a ready-to-copy format. No email required.

    How to Introduce Self-Assessment Without Losing a Week

    The most common failure is not resistance. It is asking students to apply criteria nobody taught them. A rubric is a technical document written in teacher language, and handing it to a fourteen-year-old with “rate yourself” produces exactly what you would expect.

    Four-step process graphic showing a four-week rollout for student self assessment: show what good looks like, assess someone else's work first, self-assess one criterion only, then self-assess revise and submit
    A four-week sequence for introducing student self assessment without giving up a unit of instruction.

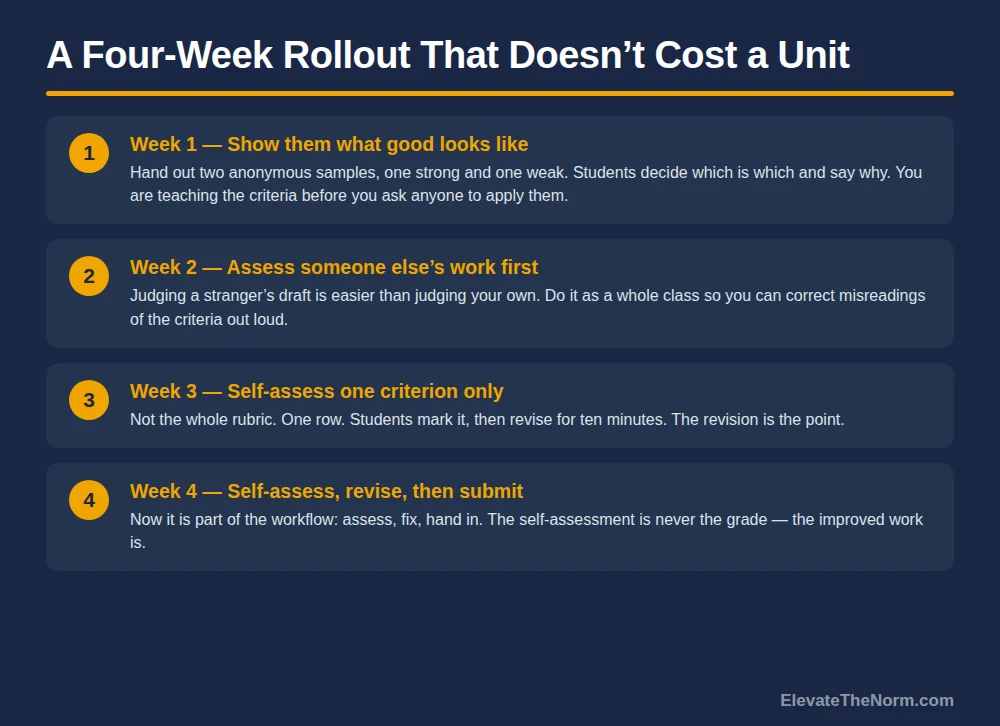
    Week one: show them what good looks like. Two anonymous samples, one strong and one weak. Students decide which is which and say why. You are teaching the criteria, not assessing anything yet. Ten minutes.

    Week two: assess a stranger’s work. Judging someone else’s draft is easier than judging your own, and doing it as a whole class lets you correct misreadings of the criteria out loud, in front of everyone, before those misreadings get baked in.

    Week three: one criterion only. Not the whole rubric — one row. Students mark it, then revise for ten minutes. The revision is the point; the marking is just what makes the revision specific.

    Week four: assess, revise, submit. Now it is part of the workflow rather than an event. And because the self-assessment never enters the gradebook, you have not created a single new grading obligation for yourself.

    Four weeks, roughly forty minutes of class time total, and at the end of it students have a habit rather than a worksheet.

    One adjustment that is not optional. Self-assessment depends entirely on a student being able to read and understand the criteria, which means the rubric language is an access issue before it is an instructional one. Rewrite each criterion in student-facing language — one sentence, present tense, naming a thing you could point at in the work. For students on IEPs or 504 plans, for English learners, and honestly for everyone, a checklist of three concrete criteria will produce better self-assessment than a four-column analytic rubric written for a grading conversation among adults. Reading the criteria aloud while students follow along costs ninety seconds and removes most of the barrier.

    What it looks like when it is working. Do not measure this by whether students’ ratings match yours. Watch for three things instead: students start pointing at specific places in their own work rather than describing their effort; the revisions they make after self-assessing are the revisions you would have asked for; and students begin asking clarifying questions about the criteria before they start the assignment rather than after it comes back. That last one is the real signal. It means the criteria have moved from your document into their planning.

    What Goes Wrong

    Vague criteria. “Shows understanding” cannot be self-assessed by anyone, including the teacher who wrote it. If a criterion cannot be checked against a specific sentence, paragraph, calculation or step, it is not usable for self-assessment and it probably was not usable for grading either.

    Letting the self-assessment count. Covered above, but it is the mistake that reappears every time a school tries to formalize this. The moment a self-rating carries points, Andrade’s inflation problem arrives on schedule.2

    No time to act on it. A self-assessment that is not followed by a revision window is a compliance exercise. Students figure that out in about two rounds and start filling it in on the way to the door.

    Treating honesty as a character test. A student who rates themselves generously is usually responding rationally to the incentives in front of them, or genuinely cannot see the gap yet. Neither is a discipline matter. Both are instructional problems — either the criteria are unclear or the stakes are wrong.

    Confusing it with self-esteem work. Self-assessment is not about how students feel about themselves. Panadero and colleagues did find a real confidence effect, but it came from students getting better at the work, not from being told they were doing fine.3

    Where It Fits With Grading, Feedback and Conferences

    Self-assessment is one of five core formative assessment strategies identified by Siobhan Leahy, Christine Lyon, Marnie Thompson and Dylan Wiliam — alongside clarifying success criteria, engineering classroom discussion, providing actionable feedback, and using students as instructional resources for one another.5 It is not a standalone initiative. It is the piece that makes the other four stick, because a student who can assess their own work can actually use the feedback you give them. The same machinery works when what a student is judging is their own conduct rather than their work — see the guide to what changes when the thing being judged is behavior rather than work for the behavior-side version, including why it must stay out of the gradebook. The group-work variant narrows the question again to how each student accounts for what they personally contributed to a product carrying one shared grade. The other four are worth having in practical form too — there is a longer rundown of checks that surface what students understand while there is still time to act on it.

    There is a hard-edged finding from Black and Wiliam’s review that bears directly on this. Ruth Butler’s 1988 study found students who received comments only improved substantially, while students who received comments with a grade attached showed a significant decline — the grade appears to crowd out the comment.1 If you are going to invest in getting students to examine their own work honestly, stapling a number to the front of it works against you.

    This is also why self-assessment sits naturally alongside a standards-based grading scale: when a grade refers to a specific standard rather than an average of everything, a student can actually locate themselves on it. And it pairs with checking for understanding during instruction — the same information, gathered from the other direction. Teachers who want the mirror image of this practice for themselves will find it in teacher reflection, which runs on the same logic: criteria, evidence, gap, action.

    The place this becomes most visible to people outside the classroom is conference night. A self-assessment written before a parent teacher conference puts the student’s own account of their work in front of the adults who are about to discuss it — and it works whether or not the student runs the meeting.

    One last connection worth naming. Self-assessment is a form of student voice — a small, structured place where a teenager’s judgment about their own work is treated as worth hearing. That is not a soft addition to the practice. It is most of why it works.

    Where to Start Tomorrow

    Student self assessment is worth doing, and it is worth doing in the smallest version you can sustain. Pick one assignment you already give. Pick one criterion from its rubric. Ask students to find the sentence in their own work that meets it, give them ten minutes to fix it if they cannot, and do not put their rating in the gradebook. That is the whole practice. Everything above is detail.

    The payoff is not a test-score jump, and anyone who promises you one is overstating a literature that does not support it. The payoff is a room full of students who can look at their own work and tell you what is wrong with it — which is the skill you actually wanted them to leave with.

    Frequently Asked Questions

    Does student self assessment mean students grade themselves?

    No. In the version supported by the research, the student’s rating never enters the gradebook. They judge their work against stated criteria, find what is missing, and revise it. The teacher grades the improved work. Heidi Andrade’s 2019 review found that when a self-rating does count toward the final mark, students inflate their estimates, which defeats the purpose of asking.

    What if a student rates their work far higher than it deserves?

    Treat it as an instructional problem, not an honesty problem. Nine times out of ten the criteria were too vague to apply, or the student genuinely cannot see the gap yet. Sit with them and ask them to point to the exact sentence, step or calculation that meets the criterion. If they cannot find it, the conversation has already done its work. A student is never penalised for an inaccurate self-assessment.

    Are self-assessments private, or do parents and administrators see them?

    That is your call, and it is worth deciding before you start rather than after. Most teachers keep routine self-assessments as working documents that stay between the student and the teacher, and bring them out only at conferences, where the student presents them. Tell students the answer up front. A student who thinks their candid self-criticism is going home in a folder will write nothing useful.

    How do you make this work for students with IEPs, 504 plans, or English learners?

    Fix the criteria first. A four-column analytic rubric written in grading language is an access barrier for a lot more students than the ones with formal plans. Rewrite each criterion as one short present-tense sentence naming something you could point at in the work, cut the list to three criteria, and read them aloud while students follow along. Sentence stems help too: My evidence for this is on page ___ , or I still need to ___ .

    How much class time does this actually take?

    Each activity in this article runs in four to ten minutes, and the four-week introduction totals roughly forty minutes of instructional time. Keep it small on purpose. A self-assessment routine that takes half a period will be the first thing cut when the pacing guide gets tight, and a routine that gets cut never becomes a habit.

    How do I know it is working?

    Not by whether students’ ratings match yours. Watch for three signals instead: students start pointing at specific places in their own work rather than describing how hard they tried, the revisions they make on their own are the ones you would have assigned, and they begin asking about the criteria before starting an assignment instead of after it comes back. The last one means the criteria have moved into their planning.

    What is the difference between self-assessment and reflection?

    Reflection is open-ended thinking about an experience, usually after it is over. Self-assessment is narrower and more mechanical: here is the stated criterion, here is my work, here is the distance between them, here is what I will change. Both are useful. Only one of them reliably produces a revision, and confusing the two is how self-assessment turns into a stack of pleasant sentences nobody acts on.

    Should self-assessment ever count toward a grade?

    The evidence says be very careful. Formative self-assessment, done before the grade and attached to a chance to revise, consistently supports achievement. Summative self-assessment, where the rating carries points, tends to be unreliable. If a school wants to give credit, give it for completing the process and acting on it, never for the accuracy of the number the student wrote.

    Sources

    1. Andrade, Heidi L. “A Critical Review of Research on Student Self-Assessment.” Frontiers in Education, vol. 4, art. 87, 2019. https://doi.org/10.3389/feduc.2019.00087
    2. Panadero, Ernesto, Anders Jonsson, and Juan Botella. “Effects of self-assessment on self-regulated learning and self-efficacy: Four meta-analyses.” Educational Research Review, vol. 22, 2017, pp. 74–98. https://doi.org/10.1016/j.edurev.2017.08.004
    3. Black, Paul, and Dylan Wiliam. “Assessment and Classroom Learning.” Assessment in Education: Principles, Policy & Practice, vol. 5, no. 1, 1998, pp. 7–74. (Full text copy hosted by UC Riverside.) https://assess.ucr.edu/sites/default/files/2019-02/blackwiliam_1998.pdf
    4. Kingston, Neal, and Brooke Nash. “Formative Assessment: A Meta-Analysis and a Call for Research.” Educational Measurement: Issues and Practice, vol. 30, no. 4, 2011, pp. 28–37. ERIC EJ951173. https://eric.ed.gov/?id=EJ951173
    5. Leahy, Siobhan, Christine Lyon, Marnie Thompson, and Dylan Wiliam. “Classroom Assessment: Minute by Minute, Day by Day.” Educational Leadership, vol. 63, no. 3, November 2005, pp. 18–24. ERIC EJ745452. https://eric.ed.gov/?id=EJ745452

    About Clay Shumate

    Clay Shumate is a certified secondary Social Studies teacher in the public schools of West Alabama, with seven years of classroom experience, a B.A. in History, and an M.Ed. in Secondary Education. He writes about project-based learning, student responsibility, respect, and practical ways to hold young people to a higher standard while giving them room to learn from mistakes. He is a member of the Society of Professional Journalists and writes to its Code of Ethics; this site’s editorial standards and corrections policy are published in full. More about Clay.

  • The 1–4 Standards-Based Grading Scale, and the Conversion Problem Nobody Solves

    The 1–4 Standards-Based Grading Scale, and the Conversion Problem Nobody Solves

    A 1–4 standards-based grading scale reports how well a student has met a standard, not how many points they accumulated. Four means beyond the standard, three means meeting it, two means approaching it, one means not yet. Three is the target, not four — which is the single thing most families and a fair number of teachers have wrong about it.

    The scale itself is not hard. What is hard is the part nobody puts on the poster: turning those numbers back into a letter grade, because almost every school that adopts a four-point scale still has to file a percentage at the end of the term.

    This page covers what each level means, why four levels rather than a hundred, and the conversion problem — including why the neat conversion chart your district hands out is a convention rather than a measurement.

    Key Takeaways

    • 3 is proficient and it is the goal. A 4 is not “an A” — it is work beyond the grade-level standard, and a student can have an excellent year without many of them.
    • Four levels exist because a hundred do not work. Asked to grade one paper, 90 trained high-school teachers produced scores from 50 to 96.
    • Nearly two-thirds of a 100-point scale describes failure. That is an accident of arithmetic nobody designed on purpose.
    • The zero is the clearest case. Recovering from one zero in a percentage system takes perfect scores on at least nine other assignments.
    • There is no validated conversion from 1–4 to letters. Every chart is an institutional convention — and the published ones converge on 3 = B, which is exactly the message problem rather than a confirmation.
    • Do not average the levels. Averaging reintroduces exactly the precision the scale was built to remove, and it punishes students who improved.
    • Decide what a 3 means before September, in writing, with the department. Most scale arguments are definition arguments wearing a number.

    Free Download · Printable PDF

    1–4 Scale and Conversion Sheet

    The four level descriptors in student-facing language, three conversion approaches side by side, the decision rules that beat averaging, and a one-page explainer you can send home.

    Download the free PDF

    Free. No email address required. Designed for grades 6–12. Rubric templates for each of the four levels are ready to download and adapt in the companion pack.

    What Each Level on the 1–4 Scale Means

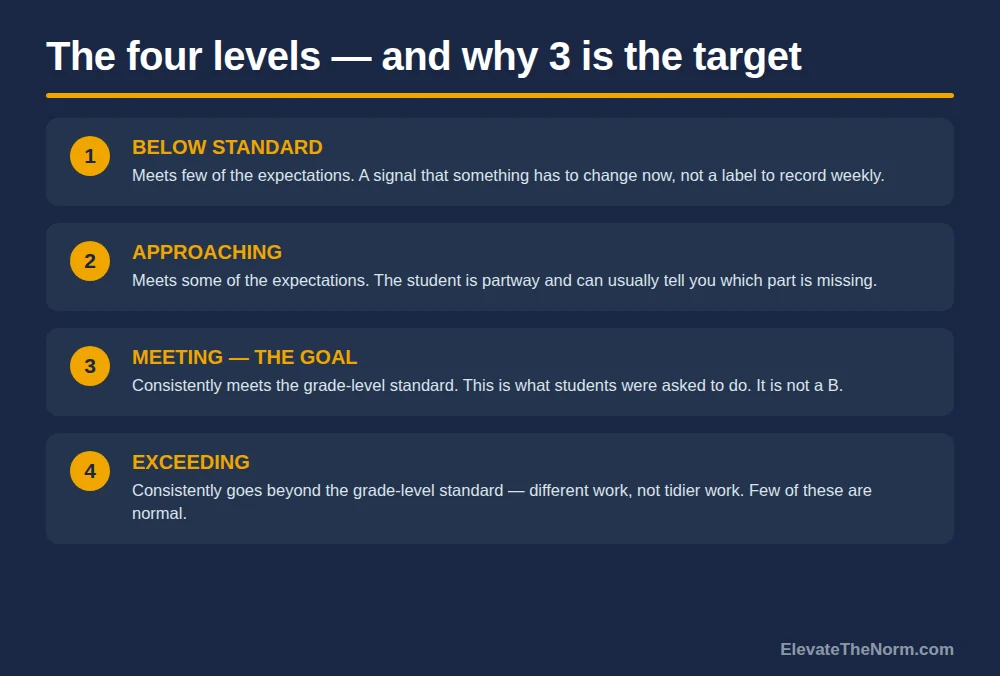
    There is no national definition, which is worth saying out loud before anyone quotes one at you. Schools write their own descriptors, and they vary. The shape is consistent though, and this family-facing version from Gateway Public Schools is about as standard as it gets:

    The four levels of a standards-based grading scale, in order: below standard, approaching, meeting, exceeding
    Three is the target. Four is a different kind of work, not a better grade.

    A 4 “consistently exceeds expectations” for skills and understanding. A 3 consistently meets them. A 2 meets some of them. A 1 meets few.

    Read the word consistently in the first two. It is doing more work than the numbers. A student who produced one brilliant analysis in October and nothing like it since is not a 4, and a student who has hit the standard on the last three attempts is a 3 even if the first attempt was dreadful. The scale is a claim about where a student is now, not a summary of everything they have ever handed in.

    The 4 causes most of the trouble at home, because families read four levels and assume A/B/C/D. It is not that. A 4 is work that goes past the grade-level standard — a different kind of task, not a tidier version of the same one. A student can meet every standard in your course, be entirely successful by any honest account, and collect very few 4s. If your reporting language does not say that plainly, you will spend October explaining it one parent at a time.

    Why Four Levels and Not a Hundred

    Because nobody can tell the difference between an 84 and an 86, and pretending otherwise has a cost.

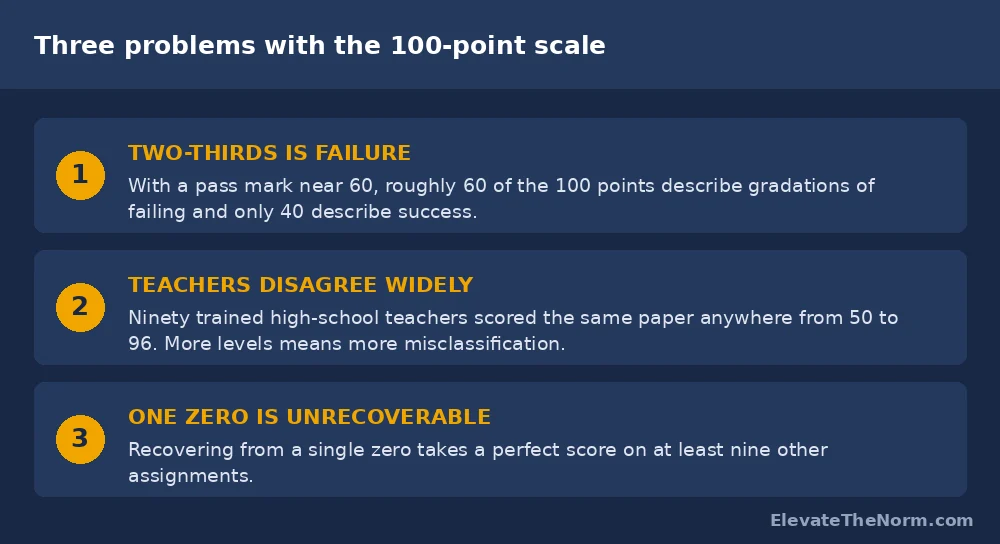
    Three problems with the 100-point grading scale: two-thirds is failure, teachers disagree widely, one zero is unrecoverable
    The four-point scale is not a simplification. It is a correction.

    Thomas Guskey has made this case more carefully than anyone. In The Case Against Percentage Grades he points out that with a pass mark around 60, nearly two-thirds of the percentage scale describes levels of failure — sixty-odd gradations of failing and about forty of succeeding. No one chose that. It is what happens when you inherit a scale and never ask what it is for.

    On reliability he cites a 2011 replication of a study first run in 1912. Ninety high-school teachers, given twenty hours of training, scored the same paper. The scores ranged from 50 to 96. More levels do not produce more accuracy; Guskey’s phrase for it is the illusion of precision, and his point is that with more levels more students are simply misclassified.

    Then the zero, which is the cleanest arithmetic in the whole argument. To recover from a single zero in a percentage system, a student must earn a perfect score on at least nine other assignments. On a 0–4 scale the same missing piece of work costs about what it should. Guskey recommends integer scales for exactly this reason, and notes they line up with the GPA scale and with state assessment levels that already use four.

    Worth being honest about what this evidence is. It is an argument about measurement and reliability, not a trial showing that four-point scales raise achievement. What the outcome evidence on standards-based grading actually shows is a separate and more mixed question. The case for four levels is that the number you report means something. That is a real benefit and it is not the same as a test-score claim.

    The Conversion Problem

    Here is the part the training day skips. Almost every school running a 1–4 scale still has to produce a letter grade, a GPA, or a transcript percentage — and there is no validated way to get from one to the other.

    If you came here for the chart, here it is — three real ones, from schools that publish their conversion rule. Read the row for 3 before anything else. All three land a proficient student on a B, and the two Vermont schools are reproduced in the state Agency of Education’s own guidance, which declines to endorse them and calls the symbols “arbitrary” next to the learning they stand for (Vermont Agency of Education, Vermont Proficiency-Based Grading Practices, rev. February 2021; EAS Standards-Based Grading Conversion Chart, Lake Washington School District).

    1–4 to letter grade · three published district charts

    Three real conversion charts, side by side. They agree on the thing that matters least and disagree on the edges.
    Level What it means Champlain Valley Union HS (VT) Montpelier HS (VT) EAS, Lake Washington SD (WA)
    4 Consistently exceeds the standard 3.9–4.0 = A+ · 3.7–3.8 = A · 3.5–3.6 = A− 3.80–4.0 = A+ · 3.60–3.79 = A · 3.40–3.59 = A− 100% = A · 95% = A
    3 Consistently meets the standard — the target 3.3–3.4 = B+ · 3.0–3.2 = B · 2.7–2.9 = B− 3.20–3.39 = B+ · 3.00–3.19 = B · 2.80–2.99 = B− 92% = B+ down to 85% = B
    2 Meets some of the standard 2.4–2.6 = C+ · 2.0–2.3 = C · 1.8–1.9 = C− 2.50–2.79 = C+ · 2.20–2.49 = C · 2.00–2.19 = C− 80% = B down to 70% = C
    1 Meets few of the standard 1.5–1.7 = D+ · 1.3–1.4 = D · 1.0–1.2 = D− · below 1.0 = F 1.80–1.99 = D+ · 1.60–1.79 = D · 1.50–1.59 = D− · below 1.50 = F 64% = D+ · 57% = D · no evidence = 0% F

    Look at where they part company. Champlain Valley fails a student below 1.0; Montpelier fails one below 1.50, so the same body of work is a D− in one building and an F in the other. EAS puts a 2 as high as a B. The convergence on 3 = B is not evidence that B is correct — it is evidence that everyone inherited the same habit of hanging the new scale on the old one. That is the problem this page is about, not the solution to it.

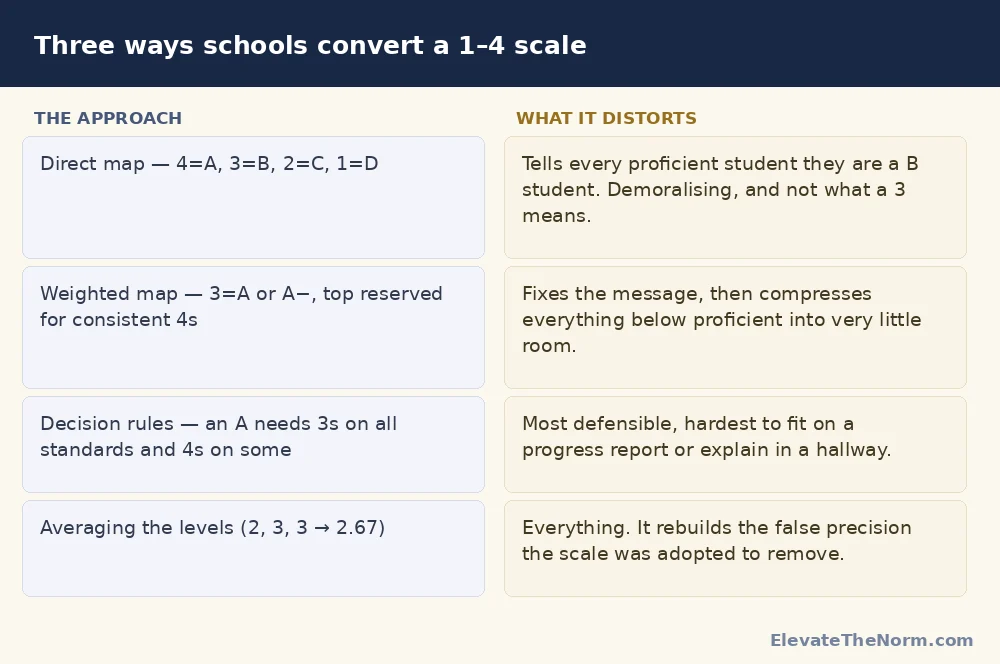
    Three approaches to converting a 1-4 standards scale into letter grades, with what each one distorts
    Every conversion chart is a local convention. None of them is a measurement.

    Districts generally pick one of three approaches. A direct map assigns a letter to each level: 4 is an A, 3 a B, and so on. It is simple and it quietly tells every proficient student they are a B student, which is both demoralising and false. A weighted map puts 3 at an A or A− and reserves the top only for consistent 4s, which fixes the message and compresses everything below into very little room. A decision-rule approach sets conditions instead of arithmetic — an A requires 3s on all standards and 4s on some, a B requires 3s on nearly all — which is the most defensible and the hardest to explain on a progress report.

    None of those is discovered. They are all chosen. If you are looking for the correct conversion chart, stop: what you are actually choosing is what your school wants a letter grade to mean, and the arithmetic follows from that decision rather than producing it.

    The question underneath the family anxiety is usually GPA, and it deserves a straight answer. A transcript still has to carry letters or a grade point, so the conversion your district picks is the thing that reaches a college — not your levels. A direct map that makes proficient students into B students will pull a GPA down relative to a neighbouring district doing it differently, and that is a real consequence rather than a misunderstanding to be explained away. If your school is adopting a four-point scale, someone should model what it does to the GPA distribution before it goes live, and should be able to tell families the answer. “It all works out” is not an answer.

    Which is why the one genuinely portable rule is a negative one.

    Do not average the levels

    Averaging is the default in every gradebook and it undoes the scale. Three reasons, in order of how much damage they do.

    It reintroduces false precision. A student with levels of 2, 3 and 3 averages to 2.67, and 2.67 is not a thing. The scale has four values because four is roughly what professional judgement can reliably distinguish. Producing two decimal places from it is the exact error the scale was adopted to stop.

    It punishes the students who improved. A student who goes 1, 2, 3, 3 has learned the thing. Their average says 2.25 — approaching. Their most recent evidence says 3. One of those numbers is a description of a student and the other is a description of their history, and only one of them is what a grade is supposed to report.

    It hides the pattern that matters. Two students both averaging 2.5 — one going 3, 3, 2, 2 and one going 2, 2, 3, 3 — need opposite conversations. The average erases the only information that would tell you which is which.

    The usual alternatives are the most recent evidence, the mode, or professional judgement with the pattern in front of you. All three are defensible; all three require you to be able to say why. That is a feature, and it is also why this works far better when a department agrees the rule together rather than each teacher inventing one, which is the same failure mode as most of the ways standards-based grading goes wrong.

    Two practical warnings. The first is that your gradebook will fight you: most systems average by default, several will not store a non-numeric level at all, and a few will happily average your levels behind the scenes while displaying something else. Find out which yours does before you trust a term’s worth of data to it.

    The second is about the scale’s own reliability, and it would be dishonest to leave out. Fewer levels reduce disagreement between teachers; they do not remove it. Two teachers in the same department, marking the same essay against the same descriptors, will still hand back a 2 and a 3 often enough to matter to the student sitting between them. The fix is not a better rubric, it is moderation — a department periodically marking the same three pieces of work and arguing until the descriptors mean the same thing to everyone. An hour a term does more for grading accuracy than any conversion chart.

    Let Them Argue Their Own Level

    The most useful thing I do with this scale is not marking with it. It is making students say a number out loud and defend it.

    In a project check-in the question is not how is it going — that gets you fine. The question is which level the work is currently at and what would move it up one. They have the descriptors. They have their own draft. They have to make the case, and I get to hear the reasoning rather than guess at it.

    What happens is consistently more interesting than the grade. Students undersell by about a level and can usually name precisely what is missing, which means the gap was never that they did not know — it was that nobody had asked them to say it. A student who can tell you they are at a 2 because their evidence is thin in the second section has just written their own next step, and they will do it because it was theirs.

    It also does something to the scale itself. A number a student has argued for is a number they understand. A number that arrives on a report card is a verdict, and teenagers treat verdicts the way anyone does — as something to contest or absorb, but not as information. If you want a structure for this rather than an improvised conversation, a short self-assessment form does most of the work — and it is worth being clear first about what student self assessment actually asks of a teenager.

    One thing the scale should never become is a label. A 1 or a 2 is a statement about a piece of work at a point in time and it is supposed to trigger something — a re-teach, a conference, a second attempt that actually counts. If a student sits at 2 for six weeks and the only consequence is that the 2 keeps being recorded, the scale has stopped doing its job and become a slower way of writing a D. The number is a prompt for the adult, not a verdict on the child. I give away a free test-corrections and retake request form for teachers who want the second attempt to be a process rather than a favour.

    If Your District Requires Percentages Anyway

    Most teachers reading this do not get to choose the reporting system. That is fine and the scale is still worth using; you just have to keep the two jobs separate — which is mostly a question of how the columns are set up before the first unit is graded.

    • Assess in levels, report in whatever they require. The conversion happens once, at the end, as a deliberate act rather than a running total.
    • Keep the level in front of students all term. They should see 1–4 on returned work even if the portal shows a percentage, because the level is the part they can act on.
    • Write your conversion rule down before you need it and give it to students and families in September. A rule published in advance is a policy; the same rule produced in May is an argument.
    • Never convert a single assignment. Convert the body of evidence for a standard, once. Converting each task and then averaging the percentages is the worst of both systems.
    • Expect the first term to be rough and say so. Families are fluent in percentages and your scale is new to them.

    And if you are the person choosing the system rather than living inside it, the honest brief is: a four-point scale buys you numbers that mean something and costs you a conversion argument you will have every year. That is usually a good trade. It is not a free one, and schools that present it as free are the ones that abandon it in year two.

    Before you go: grab the free 1–4 Scale and Conversion Sheet (PDF) — ElevateTheNorm.com branded, printable, no email required.

    Frequently Asked Questions

    What does each number mean on a 1–4 standards-based grading scale?

    4 means the work consistently goes beyond the grade-level standard, 3 means it consistently meets the standard, 2 means it meets some expectations, and 1 means it meets few. There is no national definition — schools write their own descriptors and they vary — but that shape is close to universal. The word doing the most work is “consistently”: the level describes where a student is now, across recent evidence, not an average of everything they have ever submitted.

    Is a 3 a B?

    Only if your district decided it is, and that decision is a convention rather than a measurement. A 3 means the student has met the standard, which in most schools’ own language is exactly what they were asked to do. Mapping that to a B tells every proficient student they are second-tier, which is both discouraging and inaccurate. Schools that think it through usually land on 3 as an A or A−, with the very top reserved for consistent 4s.

    Should I average standards-based grading scores?

    No. Averaging 2, 3 and 3 into 2.67 manufactures a precision the scale exists to avoid, and it penalises exactly the students who improved — a student who went 1, 2, 3, 3 has learned the material, whatever the mean says. Use the most recent evidence, the mode, or professional judgement with the whole pattern visible. Whichever you pick, agree it with your department and publish it before the term starts.

    Why not just use percentages?

    Because they are less accurate than they look. With a pass mark near 60, roughly two-thirds of a 100-point scale describes gradations of failure, and reliability research is unkind: asked to score one paper, 90 trained high-school teachers produced marks from 50 to 96. Then there is the zero — recovering from a single zero requires a perfect score on at least nine other assignments, which is a punishment nobody consciously designed.

    How do I explain the 1–4 scale to parents?

    Lead with the fact that 3 is the goal, because that is the misunderstanding underneath almost every worried email. Say plainly that a 4 is work beyond the grade-level standard rather than a better version of the same work, and that a student can be entirely successful with few 4s. Send it in writing in September, before any scores exist — the same explanation lands very differently once a family is looking at a number they do not like.

    What if a student improves a lot at the end of the term?

    Then their level should reflect that, which is the main practical advantage of the scale over a running average. A student who finishes the term demonstrating proficiency has demonstrated proficiency; a system that averages away their improvement is reporting their history rather than their learning. The check worth running is whether the recent evidence is genuinely consistent rather than one good day.

    Does standards-based grading hurt my child’s GPA?

    It depends entirely on the conversion your district chose, which is a decision rather than a property of the scale. A direct map where a 3 becomes a B will produce lower grade points than a weighted map where a 3 is an A−, for identical work. Since a transcript still carries letters or grade points, that choice is what actually reaches a college. It is a fair question to ask your school, and the right form of it is specific: what does a 3 convert to, and what happened to the GPA distribution the year you adopted this?

    Does a 1–4 scale improve student achievement?

    That is a different and much less settled question than whether it measures more honestly. The case for four levels is a measurement argument — fewer levels mean fewer misclassifications and a number that means something. The evidence on whether standards-based grading as a whole moves outcomes is genuinely mixed, and anyone selling it as a proven achievement intervention is going past what the research supports.

    Sources

    • Guskey, T. R. The Case Against Percentage Grades. Read the paper (PDF) — source for the two-thirds-of-the-scale-is-failure point, the 2011 replication in which 90 trained high-school teachers scored one paper from 50 to 96, the nine-assignments-to-recover-from-one-zero figure, and the recommendation to use integer 0–4 scales. This is an argument from measurement and reliability research; it is not a trial of student outcomes, and it should not be cited as one.
    • Gateway Public Schools. Grading and the four-point scale: an overview for families. Read the overview (PDF) — source for the level descriptors quoted above. One school’s definitions, used here because they are clearly written and representative; there is no national standard, and your district’s wording governs in your building.
    • Vermont Agency of Education. Vermont Proficiency-Based Grading Practices, revised February 9, 2021. Read the guidance (PDF) — source for the Champlain Valley Union HS and Montpelier HS rows in the conversion table. A state agency reproducing two local charts, not endorsing them: the document calls the choice between 1–4, descriptor labels and A–F “arbitrary” relative to the learning they represent, and frames conversion as a communication bridge during transition rather than an equivalence.
    • Lake Washington School District. EAS Standards-Based Grading Conversion Chart. Read the chart (PDF) — source for the percentage column. Note the population: EAS is a 5–8 school and the chart exists to translate a percentage-based gradebook back into proficiency levels, which is the reverse of the direction most readers need. It is included because it is a real published percentage mapping, not because it is a model to copy.

    Links checked September 17, 2026; the two conversion-chart sources added and checked October 4, 2026. The three conversion approaches described in this article are common practice observed across published district policies, not findings from a study — there is no validated conversion between a four-point scale and letter grades, which is precisely the argument this page is making.


    About Clay Shumate

    By Clay Shumate — Clay Shumate is a certified secondary Social Studies teacher in the public schools of West Alabama, with seven years of classroom experience, a B.A. in History, and an M.Ed. in Secondary Education. He writes about project-based learning, student responsibility, respect, and practical ways to hold young people to a higher standard while giving them room to learn from mistakes. He is a member of the Society of Professional Journalists and writes to its Code of Ethics; this site’s editorial standards and corrections policy are published in full.

  • Why Standards-Based Grading Doesn’t Work: The Objections, Taken Seriously

    Why Standards-Based Grading Doesn’t Work: The Objections, Taken Seriously

    Standards-based grading fails in practice more often than its advocates admit, and almost never for the reason its critics give. The objection is rarely that measuring proficiency against standards is a bad idea. It is that schools adopt a system requiring absolute consistency, deliver it inconsistently, and then discover that students, teachers and families all noticed.

    This article takes the objections seriously rather than dismissing them as resistance to change. Several of them are correct.

    If you want the case for it and what the evidence shows, that is a separate piece: what standards-based grading is and what the research supports. This one is the other half.

    Key Takeaways

    • Teachers are not marginally opposed to some of this. In a survey of nearly 1,000, 81 percent called no-zero policies harmful.
    • Students object on specific, checkable grounds — inconsistency between teachers above all, not a general dislike of change.
    • Reassessment can be socially costly. Some students said it made them appear stupid, which no policy document accounts for.
    • Piecemeal adoption is the norm and the problem. These practices were designed as a connected system; almost nobody implements them that way.
    • The most common failure is sequencing. Changing the report card before agreeing the standards produces a form nobody can complete consistently.
    • None of this makes it a bad idea. Most of it makes it a bad idea right now, in a specific building, under specific conditions.

    Free Download · 2-page PDF

    Standards-Based Grading Readiness Check

    The five “not yet” conditions as a department checklist, plus the one-hour moderation test, a reassessment rule builder and a transcript answer planner.

    Download the free PDF

    Free. No email address required. Designed for grades 6–12. Browse every printable in Your Free Library.

    What Teachers Actually Say

    The Thomas B. Fordham Institute, working with RAND, surveyed nearly a thousand K–12 teachers about grading policies commonly bundled with standards-based and equitable grading reform. The results are not close.

    Bar chart showing the percentage of teachers rating no-zero policies, no late penalties and unlimited retakes as harmful
    81 percent called no-zero policies harmful. That is not a fringe objection.

    Eighty-one percent rated no-zero policies as harmful, with the consensus holding across demographic groups. Fifty-six percent said the same about removing late penalties. Unlimited retakes were the most accepted of the five policies studied, and even there the split was 41 percent helpful against 37 percent harmful. A correction assignment is a narrower move than a full retake — it asks a student to analyse the error on the attempt they already made rather than replace the score.

    A leader looking at those numbers has two options. Conclude that most of the profession is wrong, or take seriously that the people delivering the policy think it damages engagement.

    There is a detail in that survey which matters more than the headline. Only 6 percent of teachers worked in districts using four or more of these policies, and just 2 percent had all five. Researchers flagged that piecemeal adoption as a concern, because the practices were designed as an interconnected system rather than standalone interventions.

    Which means a large share of the teachers rating these policies harmful were rating them as they experienced them — one piece, bolted onto a system built on different assumptions. A no-zero policy inside a traditional points gradebook really is incoherent. That is not a misunderstanding on the teacher’s part. It is an accurate reading of a half-finished reform.

    Writing for Fordham, Meredith Coffey makes a related argument: doing this well depends on school-level adaptation rather than district mandate, on standards rigorous enough that “meeting expectations” means something, and on students having genuine opportunities to demonstrate competency. Her named failure modes are a low bar, a top-down mandate without buy-in, and large schools with high teacher turnover.

    What Students Say — and Why They Are Mostly Right

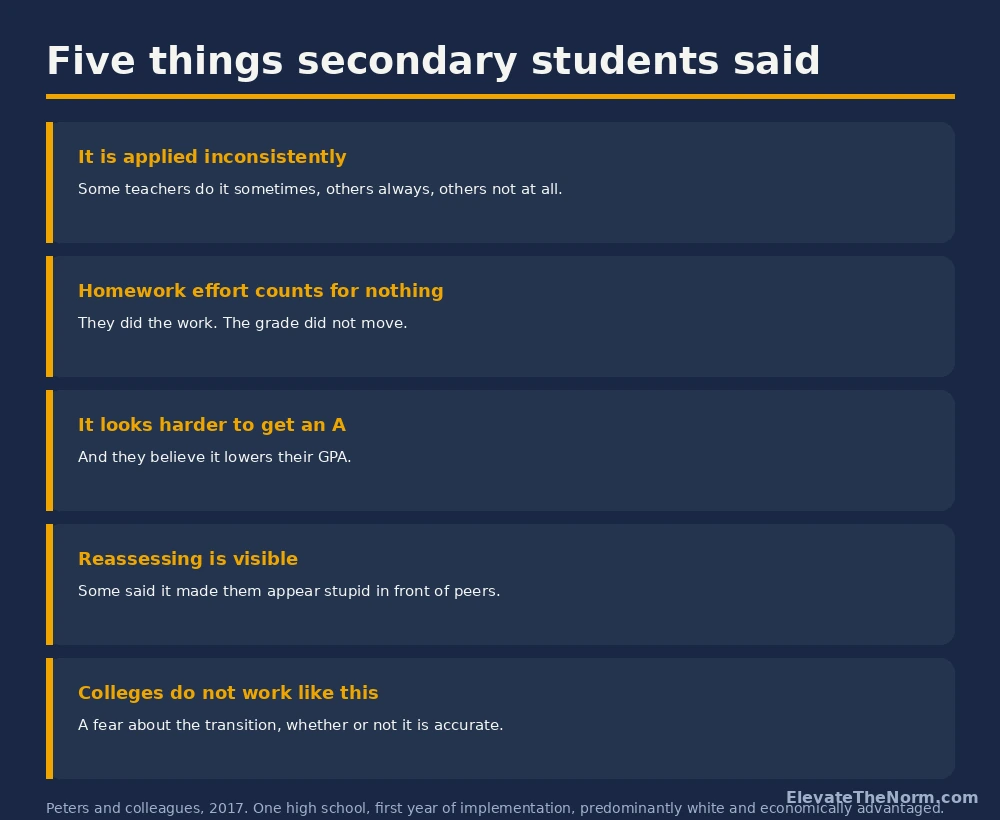
    The most useful study here is secondary-specific, which is rare in this field. Peters, Kruse, Buckmiller and Townsley analysed over 500 critical statements from students at one high school during its first year of standards-based grading, published in American Secondary Education.

    Five objections secondary students raised about standards-based grading, including inconsistency, homework not counting and reassessment stigma
    Students were not confused. They were describing a first-year rollout accurately.

    Inconsistency came first. As one student put it, “some teachers do it sometimes, others all the time, and some don’t do it at all.” Reassessment timelines, eligibility and limits all varied by classroom.

    Read that as a finding rather than a complaint. A student is describing, accurately, a system that promises objectivity and delivers a different rule in every room. Their conclusion — that it is unfair — is a reasonable inference from the evidence available to them.

    Homework counting for nothing came second. Students had done the work and watched the grade not move. The theory is sound: effort is a work habit, not evidence of proficiency. But if that has not been explained repeatedly, what a fifteen-year-old experiences is the school announcing that their effort was pointless.

    Reassessment carried social cost. Some students said it made them “appear stupid.” This one rarely appears in implementation plans at all, and it is the one I find most persuasive, because no amount of policy design removes it. If reassessing is visible, it is a public statement about who did not get it the first time.

    Motivation shifted early. Students reported studying less at first, reasoning they could just reassess later. That is rational behaviour in response to the incentives as they understood them.

    The limitations, which the authors state: one high school of about 500 students, predominantly white and economically advantaged, during a first year of implementation when inconsistency would be at its peak, with the analysis deliberately focused on critical comments in order to understand resistance. Three of the four authors were university professors who use standards-based grading themselves. So this is not a representative picture of how students feel everywhere — it is a detailed picture of what goes wrong in year one.

    The Reassessment Problem, and What I Do About It

    When I need to redirect a student, I do it quietly, at close range, rather than announcing it to the room. It takes the same number of seconds and it costs the student nothing in front of thirty people.

    The reassessment stigma finding is the same problem wearing different clothes. A student who has to publicly identify as someone who did not meet the standard has been handed a cost the policy never intended and never accounted for.

    Most of the fix is logistical rather than philosophical. Reassessment that happens quietly, at a normal time, in a way that does not mark anyone out — scheduled during work everyone is doing, arranged in a two-word conversation at the table rather than announced, with more than one student doing it at once wherever possible. None of that changes the grading system. All of it changes whether a fifteen-year-old will use it.

    A reassessment policy nobody will be seen using is not a reassessment policy. It is a line in a handbook.

    The Objections That Do Not Hold Up

    Not every criticism survives contact with the detail, and it is worth separating those out rather than treating all resistance as equally well founded.

    • “It lowers standards.” It can, if “meeting expectations” is set at a trivial bar — Coffey names exactly that as a failure mode. But that is a decision about rigour, not a property of the system. A traditional gradebook with generous partial credit lowers standards just as effectively and less visibly.
    • “Students will game the retakes.” Some will, early on, and the student data confirms it. It is also the objection most easily fixed by a written rule about what a student must do to earn a reassessment. “Unlimited” is not a policy.
    • “It does not prepare them for the real world.” Most work outside school involves revision, feedback and redoing things until they are right. The single-attempt model is the unusual one.
    • “Colleges do not use it.” Students raised this and it is a genuine anxiety, but it is a transcript-conversion question rather than an argument about grading. It has an answer; schools just have to give it before the first report card rather than after.

    The pattern across all four: each is a real risk that a school can design against, and each becomes a genuine failure when nobody does.

    When Standards-Based Grading Is the Wrong Move Right Now

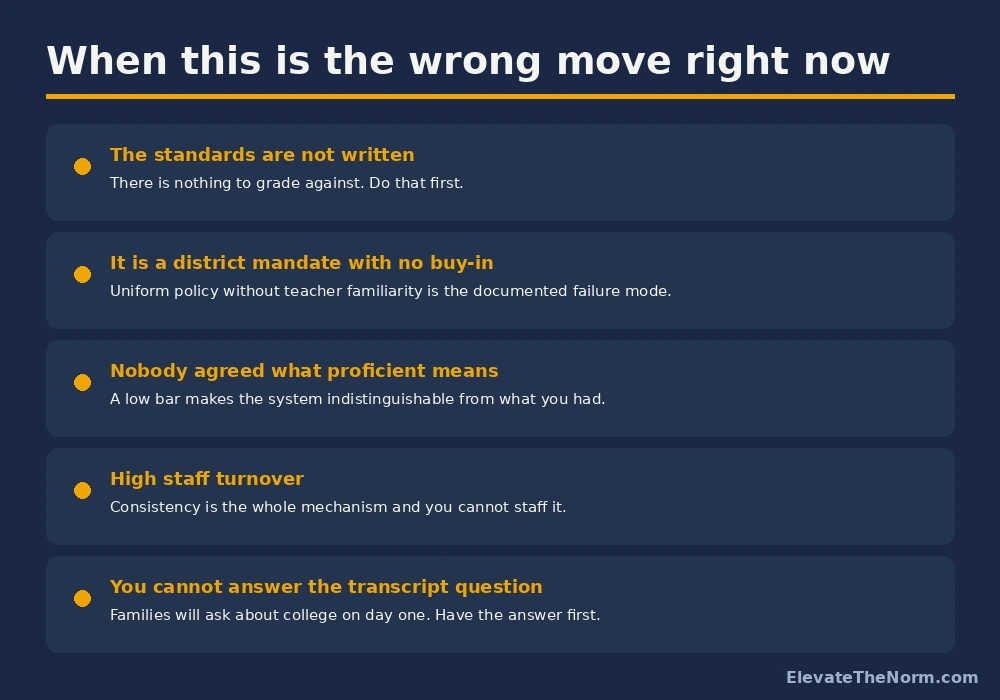
    Five conditions under which the honest recommendation is “not yet.”

    Five conditions under which a school should not adopt standards-based grading yet, including unwritten standards and district mandates without buy-in
    None of these are arguments against the idea. They are arguments about timing.

    The first is the one that sinks most rollouts. If the standards themselves are not written in language a student could read, there is nothing to grade against, and every teacher will invent their own — which produces precisely the inconsistency students identified as the core injustice.

    The second is structural and largely outside a teacher’s control. A district mandate with no buy-in is the documented failure mode, and Coffey’s argument is that school-level adaptation is what makes this work. A staff told to implement something they do not understand will implement five different versions of it.

    And the last one is the cheapest to fix and the most often skipped. Families will ask about transcripts and college on day one. Not having an answer does not make the question go away; it just means the first person to answer it will be someone on a parents’ group who has guessed.

    What to Do Next

    If your school is considering this, the most useful meeting you can have is not about the report card. It is about whether every teacher in a department would give the same proficiency level to the same piece of work. Test it — take one student’s work, have four teachers score it independently, and compare.

    If the answers diverge, you have found the actual problem, and it is the same problem whether you are grading by standards or by percentages. Standards-based grading did not cause it. It just makes it visible to students, who will then tell you it is unfair, and they will be right.

    Fix the agreement first. The free proficiency-level rubrics are a reasonable place to start that conversation, no email required.

    The conversion objection deserves its own answer rather than a footnote. Turning proficiency levels back into a percentage is the point where most of these arguments actually stall.

    Before you go: grab the free Standards-Based Grading Readiness Check (PDF) — ElevateTheNorm.com branded, printable, no email required.

    Frequently Asked Questions

    Do most teachers dislike standards-based grading?

    They dislike specific policies bundled with it, sometimes overwhelmingly. In a Fordham and RAND survey of nearly 1,000 teachers, 81 percent called no-zero policies harmful and 56 percent said the same about removing late penalties. Unlimited retakes split roughly evenly. What that survey does not show is teachers rejecting the underlying idea of grading against standards — it shows them rejecting individual practices, frequently as they experienced them bolted onto a traditional gradebook.

    What is the strongest argument against standards-based grading?

    Inconsistency, and it comes from students rather than from critics. When secondary students were asked what was wrong with it, their first and loudest answer was that different teachers applied it differently — different reassessment rules, different timelines, different eligibility. A system that promises a more accurate grade and delivers a different rule in every classroom has undermined its own central claim, and students notice that immediately.

    Do students really dislike it?

    In the one detailed secondary study available, yes — during the first year, in one school. They objected to inconsistency, to homework effort not counting, to a perception that As were harder to get, to the social cost of reassessing, and to a fear about college. The authors are clear about limits: one high school of around 500 students, predominantly white and economically advantaged, analysed specifically to understand resistance. It is a good picture of year-one problems, not a verdict on the model.

    Does it lower standards?

    It can, and that is a decision rather than a property of the system. If “meeting expectations” is set at a trivial bar, the grades mean no more than the ones you had before. The rigour of the standard is the thing to argue about — and it is worth noticing that a traditional gradebook with generous partial credit and extra-credit points lowers standards just as effectively, only less visibly.

    Will students stop trying if they can always retake?

    Some will at first. Students in the research said exactly that — they studied less initially because they believed they could reassess later. The fix is not abandoning reassessment but writing down what a student has to do to earn one. “Unlimited retakes” is the absence of a policy, and the schools that struggle most with this are the ones that never specified.

    Why do so many districts reverse course on it?

    Usually sequencing and mandate. Changing the report card before the staff has agreed what the standards are produces a form nobody can complete consistently, and a district-wide requirement without school-level buy-in produces as many versions of the system as there are teachers. Add a first-year dip in work completion, which is well documented and widely unexpected, and a leadership team reads month three as proof of failure.

    So should a school do it or not?

    It depends almost entirely on whether the groundwork exists. If your standards are written in student-readable language, your department can score the same work the same way, your reassessment rule is specific, and you can answer the transcript question — it is a better system for telling the truth about what students can do. If any of those are missing, fix that first. Most failures documented in this article are failures of preparation, not of the idea.

    Sources

    • Peters, R., Kruse, J., Buckmiller, T., & Townsley, M. (2017). “It’s just not fair!” Making sense of secondary students’ resistance to a standards-based grading. American Secondary Education, 45(3), 9–28. Full text (PDF) — one high school, first year of implementation, predominantly white and economically advantaged; analysis focused deliberately on critical statements.
    • Geduld, A. (2025, September 17). A thousand teachers were asked about “equitable” grading. Most didn’t like it. The 74. Read the article — reporting on a Thomas B. Fordham Institute survey conducted with RAND. The survey itself was not read directly; this article is the source for the figures quoted above.
    • Coffey, M. (2025, October 2). Standards-based grading can benefit students — in the right context. Thomas B. Fordham Institute. Read the commentary — the source for the conditions for success and the named failure modes.
    • Marsh, V. L. (2023, November). Standards-based grading: History, practices, benefits, and challenges. Center for Urban Education Success, University of Rochester. Read the brief (PDF) — context on the implementation dip and stakeholder resistance.

    Every link above was checked on September 12, 2026. Two of these sources are advocacy or commentary rather than primary research, and the text says which is which.


    About Clay Shumate

    By Clay Shumate — Clay Shumate is a certified secondary Social Studies teacher in the public schools of West Alabama, with seven years of classroom experience, a B.A. in History, and an M.Ed. in Secondary Education. He writes about project-based learning, student responsibility, respect, and practical ways to hold young people to a higher standard while giving them room to learn from mistakes. He is a member of the Society of Professional Journalists and writes to its Code of Ethics; this site’s editorial standards and corrections policy are published in full.

  • From Books to Screens: How to Make Digital Reading Work for Every Student

    From Books to Screens: How to Make Digital Reading Work for Every Student

    Most secondary classrooms now do the majority of their reading on a screen. The article is a link, the novel is a PDF, the primary source is a scan, and the class set of paperbacks is three years out of date and eleven copies short. That shift happened for practical reasons, not instructional ones, and it happened faster than anyone built a plan for it.

    The research on screen reading is genuinely unflattering in places. It is also narrower than the headlines suggest, and the conditions where the gap shows up are conditions a teacher can change. That is the useful part.

    What follows is what the evidence supports, what a Lexile measure does and does not tell you, how to run one text at three levels without writing three lessons, and which of the free platforms are actually free.

    Key Takeaways

    • The print advantage is real but small and conditional. The largest meta-analysis found an effect of roughly g = −0.21 favoring paper — and no advantage at all for narrative text.
    • Time pressure is where the gap opens. Under a clock the paper advantage roughly triples compared with self-paced reading.
    • Students overestimate how much they understood on screen. That miscalibration is the finding with the clearest classroom fix.
    • Lexile bands describe texts, not students. They overlap on purpose, and they say nothing about background knowledge, motivation, or content maturity.
    • Three pathways, one question. Differentiating the text is not the same as differentiating the thinking.
    • "Free" varies. ReadWorks and Project Gutenberg are free outright. CommonLit has a real free tier. Newsela’s free account is a rotating sample, not the library.

    Free Download · 2-page PDF

    Digital Reading Setup Planner

    The 20-minute routine with space to write your own version, a five-question check for the text before you assign it, a three-pathway planner, and a blank comprehension tracker.

    Download the free PDF

    Free. No email address required. Designed for grades 6–12. Browse every printable in Your Free Library.

    What Actually Changed When the Books Went Away

    Three things changed at once, and they are worth separating because only one of them is about screens.

    The text became infinitely available. A teacher can now put a 1914 telegram, a modern historian’s argument, and a plain-language summary of the same event in front of thirty students in about four minutes. That is a genuine gain and it is the reason nobody is going back.

    The text lost its edges. A paperback tells you how far in you are by feel. A scroll bar tells you almost nothing, and an article with three embedded videos and a comment section tells you less than that. Physical location in a text turns out to be part of how people remember it.

    The reading moved onto a device built for skimming. This is the part that matters most, and it is also the part a classroom can control. The device is not the problem so much as the habit the device was trained into.

    What the Research Says About Print and Digital Comprehension

    The most cited study here is Delgado and colleagues’ 2018 meta-analysis in Educational Research Review, published under the blunt title "Don’t throw away your printed books." It pooled 54 studies and more than 171,000 participants, and it found a small advantage for paper: Hedges’ g of about −0.21.

    Read the moderators and the picture gets more useful than the title suggests:

    • Time pressure. Under a time limit the paper advantage was about g = −0.26. When readers set their own pace it fell to roughly −0.09.
    • Text type. The advantage appeared for informational text (about −0.27) and mixed text (−0.30). For narrative text alone it was essentially zero.
    • Not the device. The type of digital device did not explain the difference, and neither did educational level.
    • The gap grew over time. Effect sizes favoring paper increased across the publication years studied, which is the opposite of what "digital natives will adapt" predicted.

    Clinton’s 2019 systematic review in the Journal of Research in Reading reached the same direction across 33 studies and added the finding that is most actionable in a classroom: across eleven studies of metacognition, readers were more overconfident after reading from screens. They thought they had understood more than they had.

    Be careful what you do with this. It is not evidence that technology harms achievement, and it is not a case for banning devices. It is evidence that a particular combination — dense informational text, a clock, and a screen — produces worse comprehension and more confidence in it than the reader has earned. Every one of those three is under a teacher’s control.

    What a Lexile Measure Is — and What It Does Not Tell You

    A Lexile measure is a number produced by an algorithm that looks at two things: sentence length and word frequency. Longer sentences and rarer words produce a higher number. That is the whole mechanism.

    It is genuinely useful for the thing it does. It is a fast, consistent way to sort a pile of texts by surface difficulty, which is a real problem when you are choosing among forty search results at 9 p.m.

    Here is what it cannot see:

    • Background knowledge. A 900L article about the Dust Bowl is harder for a student who has never heard of it than an 1100L article about a sport they play.
    • Conceptual difficulty. Short sentences and common words can carry a genuinely hard idea. Some philosophy scores low and reads hard.
    • Content maturity. Lexile has nothing to say about whether a text is appropriate for a fourteen-year-old. Of Mice and Men scores around 630L.
    • Structure and layout. Headings, images, and paragraph length change how readable a text is and are not part of the measure.
    • Accessibility. Contrast, font, line length, and whether the text works with a screen reader do not register at all.

    The most important distinction, and the one most often collapsed: a Lexile text measure and a Lexile reader measure are two different numbers. A student is not "a 1000L reader" in any fixed sense, and a grade band is not a requirement anyone has to hit.

    The Lexile Text-Complexity Bands by Grade

    Chart of Lexile text-complexity bands by grade: 420L-820L for grades 2-3, 740L-1010L for grades 4-5, 925L-1185L for grades 6-8, 1050L-1335L for grades 9-10, and 1185L-1385L for grades 11-CCR
    The bands overlap by design. They describe text difficulty, not student ability.

    The bands below are the ones most state documents and platform filters use. They are the "stretch" text-complexity bands published in the 2012 Supplemental Information for Appendix A of the Common Core State Standards, which revised the original 2010 ranges upward to close the gap between high school text and college and career text. The figures match those published by MetaMetrics, the organization that develops the Lexile Framework.

    Grade bandLexile text range
    Grades 2–3420L – 820L
    Grades 4–5740L – 1010L
    Grades 6–8925L – 1185L
    Grades 9–101050L – 1335L
    Grades 11–CCR1185L – 1385L
    CCSS "stretch" text-complexity bands, Supplemental Information for Appendix A (2012).

    Notice the overlap. A 1,000L article sits inside the 4–5, 6–8, and 9–10 bands simultaneously. That is not sloppiness; it is an admission that a single number cannot place a text in one grade. Treat the bands as a sorting aid and nothing more.

    Differentiating Without Writing Three Lessons

    Three reading pathways into one World War I question: an accessible narrative account, a general-audience article, and two historians who disagree, each with an illustrative Lexile range
    Same question for everyone. Three ways in.

    The mistake most differentiation makes is differentiating the thinking along with the text. The student on the easier reading gets the easier question, and by March everyone knows which group they are in and what it means.

    The alternative is to hold the question fixed and vary the road to it. Take a World War I unit and the question Why did the assassination of one archduke pull the world into war?

    • Pathway A — a short narrative account of June 1914 with a labeled alliance map. Students mark who was bound to defend whom, then answer the question in four sentences using two pieces of evidence.
    • Pathway B — a general-audience history article covering alliances, mobilization timetables, and imperial rivalry. Students build a cause-and-effect chain and rank the causes they can defend.
    • Pathway C — two historians who disagree about German responsibility, plus a primary telegram. Students weigh the interpretations and argue which cause carries the most weight.

    All three students answer the same question, and all three can be part of the same discussion, because the discussion is about the question and not about the article. If you want more worked versions of this in a history context, the history project ideas collection has units built the same way.

    Two rules keep this from becoming tracking. First, students move between pathways within a unit, and they know it. Second, nobody is prevented from taking a harder pathway because a number said so — the expectation stays where it was and the support changes.

    Seven Strategies That Make Digital Reading Work

    Each of these targets something the research actually identified, rather than being a general good idea about technology.

    1. Take the clock off, or move it. The paper advantage roughly triples under time pressure. If a reading has to be timed, time the task after the reading rather than the reading itself.
    2. Require a mark on every paragraph. A question, an underline, a two-word summary — the form matters less than that it makes passive scrolling impossible. This is the single cheapest fix on the list.
    3. Restore the edges. Tell students how long the text is, how many sections it has, and where they should be at the halfway point. Give a screen text the boundaries a book has for free.
    4. Break the overconfidence before it sets. Ask for a prediction of their own score, then check. One round of being wrong about how much they understood is worth more than a lecture about careful reading.
    5. Pre-teach three or four words, not fifteen. Vocabulary load is half of what a Lexile measure is actually detecting. Clearing the four words that carry the argument changes the reading more than a long list does.
    6. Put discussion between reading and assessment. Talk repairs a surprising amount of what a first read missed, and it does it before the misunderstanding gets written down.
    7. Move the final answer to paper. Not because paper is sacred, but because it removes the copy-paste path and forces retrieval from memory. There are other engagement moves worth pairing with this, but this one is the least negotiable.

    Four Free Digital Reading Tools, Described Honestly

    "Free" means four different things across these platforms, and the difference matters if you are planning a unit around one. The details below were checked on September 17, 2026.

    ToolWhat is freeWhat is not
    ReadWorksEverything. The nonprofit states it is free and will always be free for all teachers and students: 6,000+ K–12 texts, question sets, vocabulary tools, paired texts, automated grading, Google Classroom and Clever integration.No paid tier is offered. It runs on donations.
    CommonLitA real free tier — the full text library, the CommonLit 360 curriculum, on-demand training, and kickoff webinars, with no contract.School-wide paid plans (School Essentials PRO and PRO Plus, priced per school per year) add administrator data dashboards, LMS integrations, a dedicated account manager, and implementation support.
    Newsela LiteA rotating, staff-selected sample of articles at five reading levels, with assignments, due dates, level locking, quiz scores, annotations, and Google Classroom.The full library. Free articles expire after about four weeks. Text Sets, Collections, Power Words, printing and data download, admin console, LMS auto-rostering and auto-rostered accounts are paid.
    Project GutenbergEverything, with no registration — 79,000+ ebooks whose U.S. copyright has expired, readable in a browser or on an e-reader.No leveling, no questions, no teacher tools. It is a library, not a platform. Nothing published recently enough to still be in copyright.
    Availability and tier features verified September 17, 2026.

    One practical note on leveled versions: when a platform rewrites an article down a level, it usually shortens sentences and swaps vocabulary, which is exactly what the Lexile algorithm measures. It does not always preserve the argument’s structure. Read the lower version before you assign it, particularly if the lesson turns on how the author reasons rather than what the author concludes. The same caution applies to the free templates and planning tools that come bundled with these platforms: useful, but not a substitute for looking at the thing.

    The 20-Minute Digital Reading Routine

    Horizontal timeline of a 20-minute digital reading routine: 0-3 minutes preview, 3-5 vocabulary, 5-13 read and annotate, 13-17 discuss, 17-20 exit ticket
    Same shape every time, so students know what the screen is for.

    The shape matters more than the minutes. Students who know what a reading block is going to look like stop treating the tab as an invitation to open another one.

    • 0–3 — Preview. Headline, subheads, images, length. Predict what it will say. This is the step that restores the edges a printed page gives for free.
    • 3–5 — Vocabulary. Three or four words, pre-taught. No more.
    • 5–13 — Read and annotate. Silent, self-paced, with one required mark per paragraph. Self-paced is the condition where the research gap nearly closes.
    • 13–17 — Discuss. Pairs first, then the room. Screens down.
    • 17–20 — Exit ticket. One question, answered from memory, on paper.

    Like any other classroom procedure, this has to be taught and practised rather than announced. The first three or four times it will run long. After that it runs itself, and the eight minutes of actual reading are worth more than twenty unstructured ones.

    How to Tell Whether Comprehension Actually Improved

    This is where most articles about digital reading show you a chart of rising scores. There is no such chart here, because any numbers on it would be invented. What is worth tracking, and what the research suggests you should track, is the gap between what students think they understood and what they did.

    Ask for a predicted score before the exit ticket, record both, and watch the difference. That difference is the overconfidence effect made visible, and it is the number most likely to move first. The template below is empty on purpose — fill it with your own class.

    WeekText and LexileAvg. predicted scoreAvg. actual scoreGapWhat changed
    1
    2
    3
    4
    5
    A blank tracking template. No illustrative data, because illustrative data on a chart stops looking illustrative by the second time someone shares it.

    Two cautions. Five weeks of one class is not evidence of anything beyond that class, so resist writing it up as a finding. And if scores rise, the reading routine is one of a dozen things that changed — including the students getting better at your exit tickets. The point of the table is to notice, not to prove. Wider habits for checking what students actually know apply here without modification.

    Accessibility Is Not Lowering the Bar

    Digital text is the first format in the history of schooling that a student can adjust without asking permission, and that is the strongest argument for it. Font size, contrast, line spacing, text-to-speech, translation and dictionary lookup all happen without a conversation, a form, or a visible accommodation.

    Make those adjustments available to everyone by default. A student who needs larger text and has to request it in front of the class has been handed a choice between reading and dignity, and plenty of fourteen-year-olds will pick dignity.

    Two limits worth being straight about. Text-to-speech is a route into the content, but listening and reading are not the same skill, and a student who only ever listens is not practising the one they are graded on. And scanned PDFs of book pages are images: they cannot be resized usefully, searched, or read aloud by assistive software. If the only version you have is a scan, that is an accessibility problem before it is a comprehension one. Whichever medium the text arrives in, you still need a way to find out what stuck: a short ungraded comprehension check does that in about two minutes and none of them requires reading aloud. When I need a quick way to analyze a source with students, I use my Current Events and Media Literacy Bundle on TPT.

    Before you go: grab the free Digital Reading Setup Planner (PDF) — ElevateTheNorm.com branded, printable, no email required.

    Frequently Asked Questions

    Is reading on a screen actually worse for comprehension?

    Slightly, and only under certain conditions. The largest meta-analysis found a small advantage for paper — about g = -0.21 across 54 studies — but that advantage was concentrated in informational text read under time pressure. For narrative text it was essentially zero, and for self-paced reading it shrank to about -0.09. So the honest answer is that a screen is not inherently worse; a screen plus a clock plus dense informational text is worse, and a teacher controls two of those three.

    What Lexile level should my students be reading at?

    That question has a false premise built into it. Lexile bands describe text difficulty, not students, and they overlap heavily — a 1,000L article sits inside the grades 4-5, 6-8 and 9-10 bands at once. The published grades 6-8 band is 925L-1185L and the grades 9-10 band is 1050L-1335L, but those are ranges for choosing texts, not targets a student has to hit. A student reading below the band with strong support and real interest is in a better position than one placed in the band and left alone.

    Are Newsela, CommonLit, ReadWorks and Project Gutenberg really free?

    Two of them are free outright. ReadWorks states it is free and always will be for all teachers and students, and Project Gutenberg is free with no registration. CommonLit has a genuine free tier that includes the text library and the 360 curriculum; the paid school plans add admin dashboards, LMS integration and support. Newsela is the one to watch: the free Lite account gives you a rotating, staff-selected sample of articles at five reading levels, and those articles expire after about four weeks. The full library, Text Sets, Power Words, printing and data download are paid.

    Should I print everything out instead?

    No, and the research does not support that conclusion either. Printing throws away the adjustable text, the instant availability, the text-to-speech and the ability to put three versions of the same source in front of three students. Print the things where the evidence is strongest — long, dense informational text that has to be read under time pressure, such as a test passage — and keep the rest digital with the reading routine around it.

    How do I know a leveled version has not gutted the text?

    Read it before you assign it, specifically looking for the argument rather than the facts. Automated and editorial leveling works mainly by shortening sentences and swapping vocabulary, which is what the Lexile algorithm measures. Nuance, qualification and the author’s reasoning are what tend to go. If the lesson turns on how the author argues rather than what the author concludes, the lower version may not carry the lesson, and you are better off keeping the original and adding support around it.

    Does giving students text-to-speech mean they are not really reading?

    It means they are getting the content, which is usually the point of the lesson. Listening and reading are not identical skills, though, so the honest position is that text-to-speech is a route into material a student could not otherwise reach, not a replacement for decoding practice. Make it available to the whole class by default rather than as a named accommodation, and keep separate time for the reading skill itself.

    What is the single change with the biggest return?

    Requiring one mark per paragraph. It costs nothing, needs no platform, and it makes passive scrolling structurally impossible. The second-best is asking students to predict their own exit-ticket score before they take it: the research consistently finds that readers overestimate their comprehension after reading on screen, and being visibly wrong about it once does more than any amount of reminding to read carefully.

    Sources

    • Delgado, P., Vargas, C., Ackerman, R., & Salmerón, L. (2018). Don’t throw away your printed books: A meta-analysis on the effects of reading media on reading comprehension. Educational Research Review, 25, 23–38. Full text (PDF) — 54 studies, 171,055 participants; overall g ≈ −0.21 favoring paper, moderated by time pressure and text genre, with no effect for narrative text.
    • Clinton, V. (2019). Reading from paper compared to screens: A systematic review and meta-analysis. Journal of Research in Reading, 42(2), 288–325. ERIC record — 33 studies; small negative effect for screens, and readers more overconfident about their comprehension after screen reading across 11 calibration studies.
    • Council of Chief State School Officers & NGA Center. Supplemental Information for Appendix A of the Common Core State Standards: New Research on Text Complexity (2012). Document — the source of the revised "stretch" text-complexity bands used above.
    • MetaMetrics. Lexile Measures and Grade Levels (FAQ). PDF — per-grade and grade-band Lexile ranges aligned to the 2012 CCSS measures.
    • ReadWorks. About ReadWorks — statement that the platform is free and always will be for all teachers and students; 6,000+ texts.
    • CommonLit. Pricing — free Classroom Basics tier and the paid School Essentials PRO tiers.
    • Newsela. Newsela Lite (free account) — five reading levels on a rotating selection, four-week article expiry, and the list of paid-only features.
    • Project Gutenberg. Home — 79,000+ free ebooks, public domain in the United States, no registration.

    Every link above was checked on September 17, 2026. Where a figure comes with limits on how far it travels, those limits are stated in the text rather than left in a footnote. No classroom results, student work, or research findings on this page are invented; the tracking table is deliberately empty for that reason.


    About Clay Shumate

    By Clay Shumate — Clay Shumate is a certified secondary Social Studies teacher in the public schools of West Alabama, with seven years of classroom experience, a B.A. in History, and an M.Ed. in Secondary Education. He writes about project-based learning, student responsibility, respect, and practical ways to hold young people to a higher standard while giving them room to learn from mistakes. He is a member of the Society of Professional Journalists and writes to its Code of Ethics; this site’s editorial standards and corrections policy are published in full.

Teacher Emergency Toolkit — practical resources, real classroom support. Shop on TPT.Teacher Emergency Toolkit — practical resources, real classroom support. Shop on TPT.