The Elevate Blog banner: Real Classrooms. Practical Ideas. Higher Expectations. Three students climb a rocky ridge at sunrise, each pulling the next one up, toward a teacher reaching down to help.

Tag: teacher-student relationships

  • Special Education Teacher Burnout: The Three Loads That Are Not on the General List

    Special Education Teacher Burnout: The Three Loads That Are Not on the General List

    By Clay Shumate

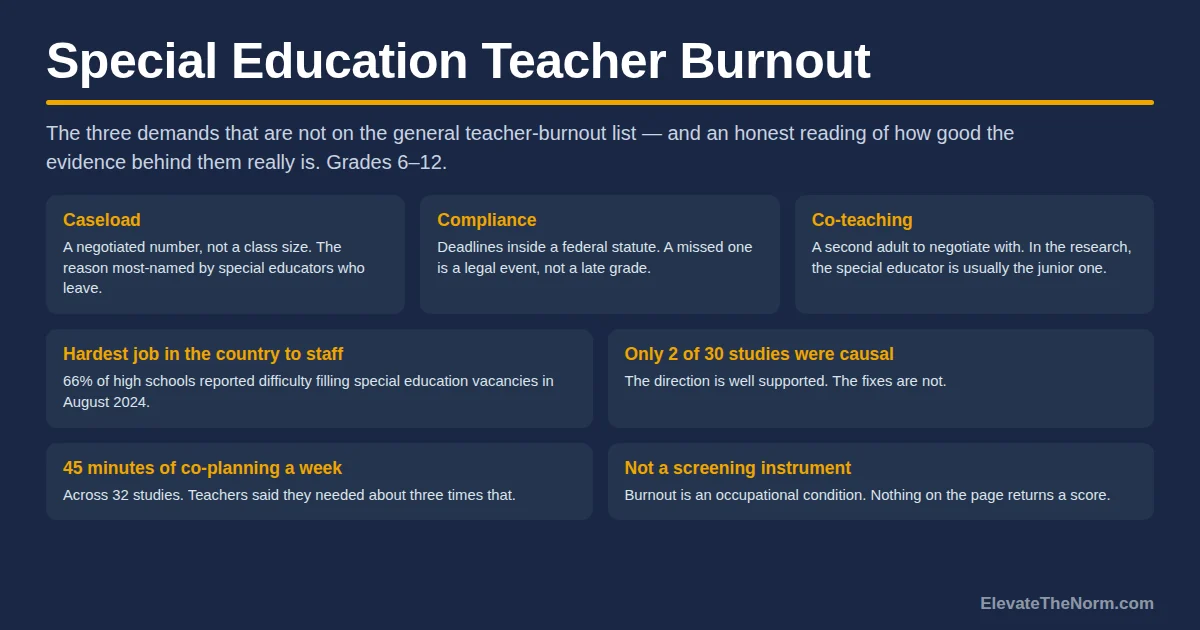
    Teacher burnout in special education runs on a set of demands that does not appear on the general list at all. A caseload is a negotiated number, not a class roster. The paperwork carries statutory deadlines. The second adult in the room is a relationship to manage rather than a resource to use. The research on all three is consistent in direction and thinner in quality than you would hope.

    This page does not restate the general list. The general demand ledger every teacher is working from already covers behavior, hours and out-of-pocket spending, and all of it applies here too. For the word itself, start with the three dimensions the word is actually made of. What follows is narrower: the demands belonging to this job specifically, in grades 6–12, and how good the evidence behind them really is.

    Key takeaways

    • Three demands separate this job from the general one: caseload as a negotiated number, compliance work with statutory deadlines, and co-teaching as a relationship rather than a resource. None gets smaller by managing your time better.
    • Caseload is the most-named reason in the retention research: 33 percent of leavers in one urban district’s exit survey, more than any other factor — though that is 99 people in one district, not a national rate.
    • Paperwork was third in the same survey, at 24 percent, and lands differently because a missed deadline is a legal event rather than a late grade. The system behind it is large and mostly never touches individual teachers: 29,490 due process complaints filed nationally in 2021–22, 2,645 fully adjudicated.
    • In the co-teaching research the special educator is repeatedly observed in a subordinate role, most of all at secondary level. Across 32 studies, teachers reported roughly 45 minutes a week of joint planning and said they needed about three times that.
    • Special education is the hardest area in the country to staff: in August 2024, 66 percent of high schools reported difficulty filling it, and only 77 percent of those vacancies went to a fully certified teacher.
    • The evidence is directionally consistent and methodologically weak — of 30 studies in the major review, only two used designs supporting causal claims. The familiar “75 percent leave within five years” figure is one state’s data from 1987 to 2001, not a current rate.
    • None of these numbers is a statement about you, and none is a diagnosis. Burnout is an occupational condition; nothing here is a screening instrument and nothing returns a score.
    Free download

    The Special Education Workload Audit

    Two printable pages. A write-in grid for the four things on this page — caseload and where the number came from, compliance events counted by week, co-planning scheduled versus actual, and unfilled positions — plus how to read the four answers together and who to take them to. Counts and dates only, never a student’s name. It is not a screening instrument and it returns no score. Free. No email address required. Designed for grades 6–12.

    Download the free PDF

    What makes special education a different burnout problem?

    Three demands a general education teacher never meets, none of which you control the shape of. A caseload is set by somebody else, a compliance calendar by federal statute, a co-teaching partnership by a master schedule you did not build. Time-management advice is aimed at demands whose shape you can change, which is why it does not land here — and being told to work smarter about something you do not control is a reliable way to feel worse about it.
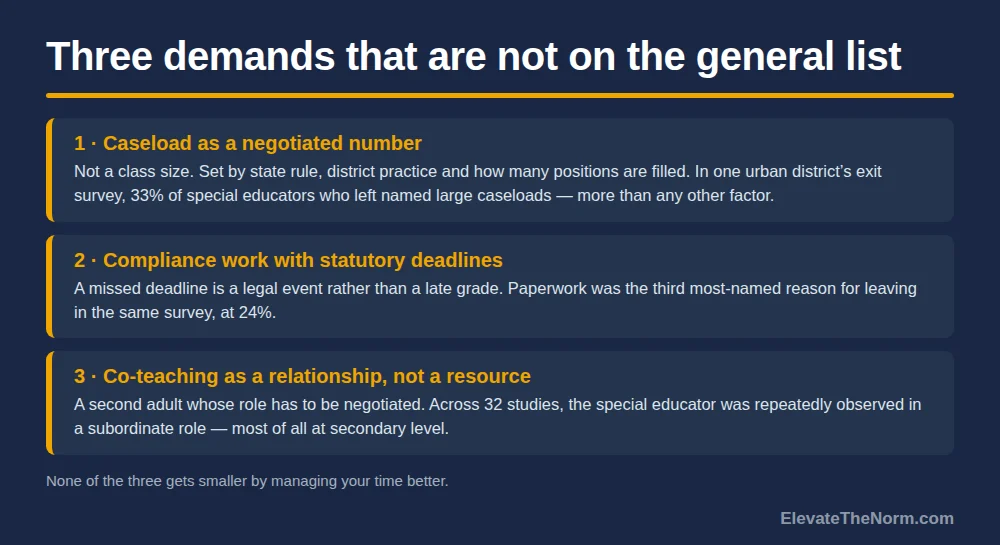
    Graphic listing three demands specific to special education: caseload as a negotiated number with 33 percent of leavers in one urban district naming it, compliance work with statutory deadlines with paperwork third at 24 percent, and co-teaching as a relationship with the special educator repeatedly observed in a subordinate role across 32 studies.
    The three demands that belong to this job and not to the general list.

    One thing to settle before the numbers start. Special educators report heavier loads and leave at higher rates, and it is easy to read that as a statement about the people who do the job. It is not. Every figure below is an average across thousands of teachers in very differently resourced buildings, and an average says nothing about any individual in it. Reading it as a verdict on yourself is statistically wrong, and it is the self-blame that makes a hard year harder.

    How many students is a special education caseload?

    Nobody can tell you, and that is the problem. A caseload is not a class size. It is a number produced by state rule, district practice, how many positions are filled, and what got decided in a meeting in July. Two teachers with the same title in the same state can be carrying very different loads.

    It is also what special educators name first. In a survey of teachers who left or moved out of one large urban district, 33 percent named large caseloads as an important reason — more than any other single factor. A teacher quoted in the same research put it plainly: “I currently see well over 75 students a day with little support.”

    Label that number before you carry it anywhere. It comes from 99 special educators, one district, three years. It is not national, and it does not tell you what a reasonable caseload is — no study does. It tells you what people say on the way out, and they have been saying it for a long time.

    The useful consequence: because a caseload is negotiated rather than given, it is one of the few demands here that somebody with a title can change in a scheduling meeting. That is not easy, but the conversation has a right address.

    Why does special education paperwork land differently?

    Because a missed deadline is a legal event rather than a late grade. Every teacher has paperwork. Very little of it sits inside a federal statute with a dispute-resolution process attached to the far end.

    Paperwork was third in that same district survey, at 24 percent. One teacher described it in terms any teacher will recognise: the IEPs ate up much of the time previously spent on students. The complaint is not that the documents are pointless, but that the documents and the students compete for the same hours.

    The system behind those deadlines is genuinely large. In 2021–22, states and outlying areas reported 29,490 due process complaints filed nationally, 6,160 written state complaints and 10,806 requests for mediation — up from 17,118 due process filings a decade earlier, with the share still pending at year end rising from 12 percent to 43 percent.

    Two qualifications, because this is the kind of number used to frighten people. Most of that volume never reaches a hearing — 2,645 were fully adjudicated — and the overwhelming majority of special education teachers finish a career without being personally involved in any of it. The point is not that you are about to be sued. It is that the deadlines are not negotiable the way a grading deadline is, which makes the pressure attached to them rational rather than something to talk yourself out of.

    What does co-teaching do to the job?

    In the research it repeatedly turns the special educator into the junior adult in somebody else’s room, and it does this most at secondary level. That is not a complaint about colleagues; it is what falls out of a structure where one adult owns the content and the other is assigned to the students.
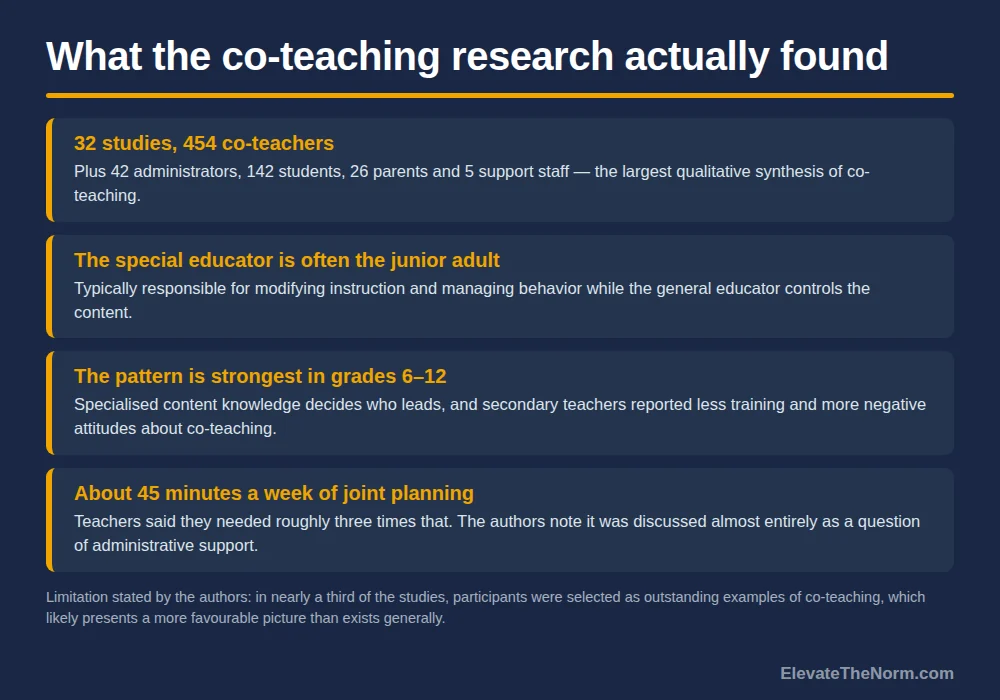
    Graphic summarising a synthesis of 32 co-teaching studies covering 454 co-teachers: the special educator is often the junior adult, the pattern is strongest in grades 6 to 12, and teachers reported about 45 minutes of joint planning a week against a stated need of roughly three times that.
    The co-teaching findings, with the authors’ own selection-bias limitation printed underneath them.

    The largest qualitative synthesis of co-teaching covered 32 studies, 454 co-teachers, 42 administrators, 142 students, 26 parents and 5 support staff. Its central finding: the special education teacher was often observed to play a subordinate role, typically responsible for modifying instruction and managing behavior while the general educator controlled the content. One special educator described the job as being an aide sometimes, an interpreter sometimes, and sometimes a teacher.

    The pattern sharpened at secondary level, where specialised content knowledge decides who leads and teachers reported less training and more negative attitudes about co-teaching than elementary counterparts. If you teach grades 6–12, that is your setting, not a footnote. The six recognised co-teaching structures divide that work very differently, and it is worth knowing what the research has actually measured for each one before a partnership is assigned to you.

    The pressure point is planning time. Teachers reported about 45 minutes a week of joint planning and said they needed close to three times that — and the authors note it was discussed almost entirely as a question of administrative support. That is the right framing, because planning time is a scheduling decision somebody signs off on, not a personal organisational failing.

    This is the one item on the page that genuinely responds to coaching. The subordinate pattern is produced by defaults — who stands where, whose name is on the gradebook, who the class looks at when directions are given — and an explicit division of roles, said out loud in front of students in the first week, changes what the room assumes for the year. If you are the general education teacher in that room, most of that fix is yours. Though a coaching cycle offered instead of staffing relief will be read as exactly what it is.

    Does the staffing shortage make all three worse?

    Yes, and it is the mechanism connecting them. Every unfilled special education position is a caseload that gets distributed, a compliance calendar absorbed, and a co-teaching assignment covered by whoever is available.

    The federal survey data is unambiguous about where the shortage bites. In a national panel of 1,392 public schools surveyed in August 2024, special education was the hardest teaching area in the country to staff: 66 percent of high schools and 74 percent of middle and combined schools reported difficulty filling those vacancies, and only 77 percent of the ones filled went to a fully certified teacher — eleventh of thirteen subject areas, against 89 percent for social studies.

    Read that last figure the right way. It is no judgement on people hired under emergency credentials, who are usually doing a hard job with less preparation than they deserved. It is a statement about what the building asks of everyone else, because an under-prepared colleague needs support that comes out of somebody’s week — usually the experienced special educator already carrying the largest caseload. A first-year special educator is short of both at once: short of the stock every new teacher lacks, and short of specialised knowledge the role needs on day one.

    What the data does not tell us is where inside a district those gaps land. The major review notes that few studies examined school poverty or student demographics at all. It is reasonable to suspect the shortfall concentrates in the schools least able to absorb it — but that has not been established, and a district that wants to know should look at its own vacancy and caseload numbers by school rather than assume either way.

    How good is the evidence behind any of this?

    Consistent in direction, weak in design, and worth knowing before you quote it at anybody. This literature has a myth problem, and a number that falls apart under scrutiny costs more than it gains.

    The major review of special educator attrition covers 30 studies from 2002 to 2017, and its accounting of itself is blunt. Only two of the 30 used methods permitting causal inference. Only 13 examined teachers actually leaving; the rest measured intent to leave or administrator perceptions, which are related but not the same. Mentoring, which teachers called valuable in the qualitative studies, showed insignificant direct effects on retention in the quantitative ones.

    The most recent burnout synthesis, covering 29 studies from 2013 to 2023, describes its own base as predominantly cross-sectional analyses of convenience samples — a snapshot of whoever responded, not a study over time.

    The co-teaching synthesis carries a limitation its authors state outright: in nearly a third of the studies, participants were selected as outstanding examples of co-teaching, which they say likely presents a more favourable picture than exists generally. That cuts in an unusual direction — it suggests the real picture is worse, not better — and that is a reason to hold the finding loosely, not a licence to assume the worse version.

    The number to stop repeating. “Seventy-five percent of special educators leave within five years” is a real finding — Illinois administrative data on teachers who entered between 1987 and 2001, 42 percent leaving teaching and 34 percent moving schools. One state, and a cohort that started work before most teachers now in classrooms were born. It is not a current national rate. The nearest national figure in the same review is older than it sounds too: 17.1 percent of special educators left their schools in 2012–13.

    And one finding that cuts against the simple story. A study of novice teachers in their first three years found, as expected, that special educators rated their workloads significantly less manageable than general educators did, and that workload manageability predicted emotional exhaustion, which predicted whether they meant to keep teaching. But the effects were stronger for the novice general educators. One reading is that special educators arrive expecting an unmanageable workload and are less shaken when they get one, which is not comforting. Another is that the measure misses what is heavy about this job. That study sampled elementary and middle school novices in two states, so it is not a high school result either.

    The honest summary: the direction is well supported and the fixes are not. Special educators consistently report heavier, less manageable workloads, name caseload and paperwork first when they leave, and are harder to replace than anyone in the building. What almost nothing here establishes is that any particular intervention fixes it.

    What can you actually check, and who do you take it to?

    Four things, all facts about the job rather than judgements about you. The point is to turn a feeling of being underwater into four numbers somebody with a title can act on. Short on time, which is the whole premise? Do items one and three only — five minutes, and the pair most likely to produce a change.
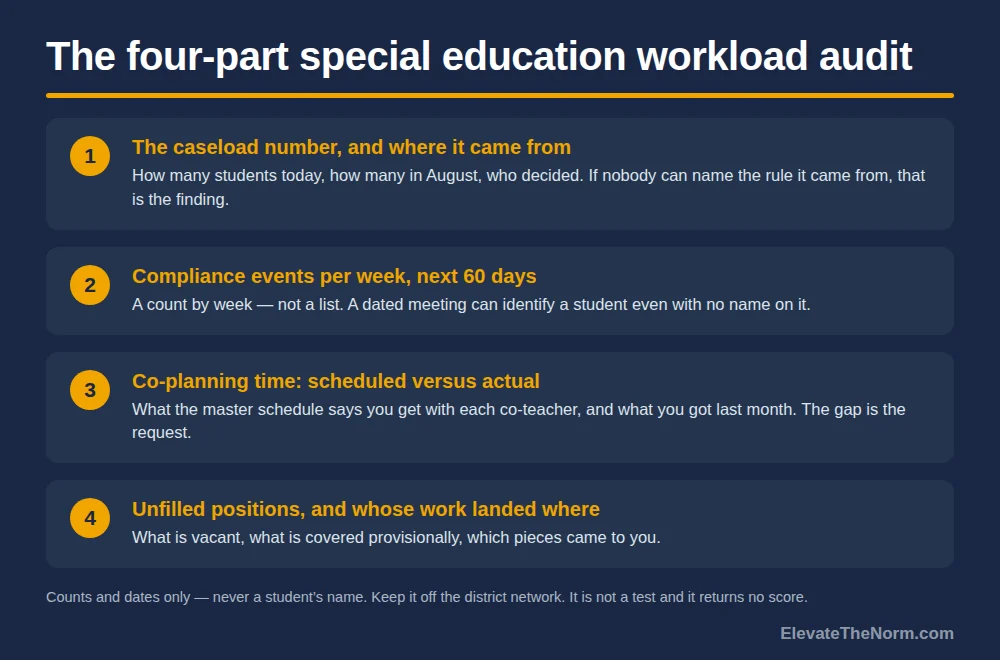
    Graphic showing a four-part workload audit: the caseload number and where it came from, compliance events counted per week for the next 60 days, co-planning time scheduled versus actual, and unfilled positions with whose work landed where.
    Four facts about the job. Counts and dates only, never a student’s name.
    1. The caseload number, and where it came from. How many students today, how many in August, who decided. If nobody in the building can name the rule it came from, that is itself the finding.
    2. Compliance events per week for the next 60 days. A count by week — meetings, evaluations, reviews. Not to panic about; to see whether the load is spread or stacked into two weeks that were always going to break.
    3. Co-planning time, scheduled versus actual. What the master schedule says you get with each co-teacher, and what you got last month. The gap is the request.
    4. Unfilled positions, and whose work landed where. What is vacant, what is covered provisionally, which pieces came to you.

    Three rules for keeping it. Write counts and dates, never names or initials — item two can identify a student with no name on it at all, because a dated meeting is traceable, which is why it is a count per week rather than a list. Keep it somewhere that is yours; a district device is not a private place to write that you are not coping. And keep it separate from compliance itself: this is a record of workload, not a log of deadlines you expect to be missed. If you believe a legal deadline is about to be blown, that goes to your coordinator today, on its own, in writing.

    It goes to the special education coordinator or department chair first, then whoever builds the master schedule. Open it as a question rather than a case — “here is what I am carrying, can we look at whether this is the intended distribution” lands differently from a document handed over in silence. Ask for the criterion rather than the favour: the conditions worth asking to have changed work better when the rule for who qualifies is written down first. A load lightened by private arrangement creates a fairness problem down the hall.

    If you are the only special educator in your building — common in small secondary schools — there is no department to take this to. The chain then runs to the district’s special education director, and sideways to a counterpart at another school or your state’s technical assistance center. Do not skip the step because the usual person does not exist.

    One thing this sheet is not. It is not a test, it produces no score, and it cannot tell you whether you are burned out. There is no validated cutoff that turns numbers into a finding about a person. If what you are carrying has stopped being about the job — if it follows you home, into the weekend, into how you feel about yourself — that is a conversation with your doctor or a counsellor, not with a worksheet. A short weekly record you can actually keep beats any one-off audit, because it shows a direction instead of a verdict.

    Are the students the reason?

    No. This needs saying directly, because “special education is exhausting” slides easily into “these students are exhausting,” and that is both untrue and corrosive.

    A caseload is a staffing decision. A compliance calendar is a federal statute. An unfilled position is a labour market. A co-teaching structure is a master schedule. Every load on this page came from an adult decision, and a student with an IEP is who those decisions exist to serve. Where the research finds this job heavy, it is heavy because of how it was resourced.

    And if you have an IEP and you have noticed your teacher is stretched: none of it is yours to carry. The services on your plan are yours by law regardless of how the building is staffed, asking for them is not making trouble, and a staffing shortage is never a reason to ask for less than you are owed.

    This matters practically as well as decently. A teacher who quietly concludes the students are the problem starts lowering the bar, and that is the one response that makes everything worse for everyone. Holding the bar where it belongs while the supports do their job is the whole design.

    What to do next

    Fill in the audit this week, or just items one and three. Most of it is already in your email and the master schedule. Then take the two biggest gaps to the person who can change them, in writing, as a question about the criterion rather than about you.

    If the answer is no, you have still done something useful: a written record of a load and a dated request is what makes a pattern visible when somebody finally asks why the position turned over again. And if the honest answer is that this job cannot be made survivable where you are, that is a real answer, not a failure of nerve. Nobody gets credit for absorbing a staffing shortfall until it breaks them.

    Want the audit as a printable? Download The Special Education Workload Audit (2 pages, free, no email required) and fill in items one and three before your next scheduling conversation.

    Frequently asked questions

    What causes burnout in special education teachers specifically?

    Three demands that do not appear on the general teacher-burnout list. Caseload is a negotiated number rather than a class size, set by state rule, district practice and how many positions are filled — and in one urban district’s exit survey, 33 percent of special educators who left named large caseloads as an important reason, more than any other factor. Paperwork was third in the same survey at 24 percent, and it lands differently because the deadlines sit inside a federal statute rather than a gradebook. And co-teaching is a relationship to negotiate rather than a resource to use: across 32 qualitative studies the special educator was repeatedly observed in a subordinate role, most of all at secondary level. The general demands — behavior, hours, out-of-pocket spending — apply on top of all three.

    Is special education teacher burnout worse than general education teacher burnout?

    The direction of the evidence says special educators carry more, but the size of the gap is not settled. Special educators report heavier and less manageable workloads, name caseload and paperwork first when they leave, and are the hardest group in the country to replace. Against that, a study of novice teachers in their first three years found that although special educators rated their workloads significantly less manageable, the link running from workload manageability through emotional exhaustion to career intentions was actually stronger for the novice general educators. That study sampled elementary and middle school novices in two states, so it is not a high school result. The honest answer is that the job is differently loaded, and that anyone claiming a precise multiplier is going beyond what the research supports.

    Do 75 percent of special education teachers really quit within five years?

    Not as a current national figure. That number is real but it comes from Illinois administrative data on teachers who entered the profession between 1987 and 2001 — 42 percent leaving teaching and 34 percent moving schools. One state, and a cohort that started work before most teachers now in classrooms were born. It should not be quoted as today’s rate. The nearest national figure in the same literature review is also older than it sounds: 17.1 percent of special educators left their schools in 2012–13. Leaving is also not the same thing as burning out; people move for pay, family, geography and promotion.

    How big should a special education caseload be?

    No study answers that, and no national standard sets it. Caseload limits, where they exist at all, are set by state rule and vary widely, and the actual number a teacher carries also depends on district practice and how many positions are currently filled. What the research establishes is that caseload is what special educators name first when they leave, not what a defensible ceiling would be. The practical move is not to argue for a number but to ask what rule your building used to arrive at yours — if nobody can name one, that is itself worth putting in writing.

    What can a principal or district actually change about this?

    Three things, all of them scheduling or staffing decisions rather than encouragement. Co-planning time is the clearest: in the co-teaching research teachers reported about 45 minutes a week and said they needed roughly three times that, and the authors note it was discussed almost entirely as a question of administrative support. Caseload distribution is the second, and it is negotiated in a scheduling meeting. The third is how the work of unfilled or provisionally covered positions gets allocated, which currently tends to land on whoever is most experienced. Whatever is changed, write the criterion for who qualifies before applying it to anybody — a load lightened by private arrangement creates a fairness problem down the hall.

    I am a parent and my child’s special education teacher seems overwhelmed. What should I do?

    Ask the school about staffing rather than about the teacher. The useful questions are whether the position is fully staffed, what the caseload is, and whether the services on your child’s plan are being delivered as written — those are answerable and they are the school’s responsibility. Your child’s entitlement to the services on the plan does not depend on how the building is staffed, so raising a gap in delivery is entirely reasonable. What is worth avoiding is treating an individual teacher’s apparent state as the subject, both because a teacher’s wellbeing is not a matter for the class group chat and because the loads described on this page are almost entirely produced by decisions made above the classroom.

    I am a student with an IEP. Is my teacher stressed because of me?

    No. A caseload is a staffing decision, a compliance calendar is a federal statute, an unfilled position is a labour market and a co-teaching structure is a master schedule. Every load described on this page came from an adult decision, and none of it is yours to carry or to fix. The services on your plan are yours by law regardless of how your school is staffed, asking for them is not making trouble, and a staffing shortage is never a reason to ask for less than you are owed. If you are worried about a teacher, talk to a counselor about the class rather than about the person.

    Is there a test that tells you whether you have special education teacher burnout?

    No, and this site does not publish one. Burnout is an occupational condition rather than a clinical diagnosis, and the research instruments used to measure it lack a clinically validated cutoff, which means there is no threshold that turns a set of answers into a finding about an individual person. A checklist can tell you useful things about your job — how big the caseload is, how the compliance load is distributed, how much co-planning time you actually get — and that is what the audit on this page does. If what you are carrying has stopped being about the job, that is a conversation with your doctor or a counsellor, not with a worksheet.

    Sources

    • Billingsley, B., & Bettini, E. (2019). Special education teacher attrition and retention: A review of the literature. Review of Educational Research, 89(5), 697–744. A systematic review of 30 studies published between 2002 and 2017. Source of the 33 percent caseload and 24 percent paperwork figures (from Billingsley, 2007 — 99 special educators who left or moved from one large urban district over three years), the 17.1 percent national attrition figure for 2012–13 (Goldring, Taie & Riddles, 2014), and the “75 percent within five years” figure (DeAngelis & Pressley, 2011 — Illinois administrative data, 1987–2001). Limitations stated by the authors: only two of the 30 studies used methods permitting causal inference, only 13 examined teachers actually leaving rather than intent to leave, and few studies examined school poverty or student demographics. journals.sagepub.com
    • Brunsting, N. C., Morin, L. E., Gómez, L. R., Jones, B., Bettini, E., Cumming, M. M., Garwood, J. D., & Ruble, L. A. (2026). Burnout and occupational wellbeing of special education teachers: Recent research synthesized. Review of Educational Research. A synthesis of 29 studies published between 2013 and 2023, extending the 2014 Brunsting, Sreckovic & Lane synthesis. The authors describe the evidence base as predominantly cross-sectional analyses of convenience samples and call for longitudinal and intervention designs. journals.sagepub.com
    • Scruggs, T. E., Mastropieri, M. A., & McDuffie, K. A. (2007). Co-teaching in inclusive classrooms: A metasynthesis of qualitative research. Exceptional Children, 73(4), 392–416. 32 qualitative reports covering 454 co-teachers, 42 administrators, 142 students, 26 parents and 5 support personnel. Source of the subordinate-role finding, the secondary-level intensification, and the 45.5 minutes of weekly joint planning against a stated need of roughly three times that. Limitation stated by the authors: in nearly a third of the investigations participants were selected as outstanding examples of co-teaching, which they say likely presents a more favourable picture of co-teaching than exists in general. ncipp.education.ufl.edu (PDF)
    • Bettini, E., Jones, N., Brownell, M., Conroy, M., Park, Y., Leite, W., Crockett, J., & Benedict, A. (2017). Workload manageability among novice special and general educators: Relationships with emotional exhaustion and career intentions. Remedial and Special Education, 38(4), 246–256. Novice teachers in their first three years, drawn from the Michigan–Indiana Early Career Teacher Study. Special educators rated workload manageability significantly lower than general educators; workload manageability predicted emotional exhaustion, which mediated the relationship with intentions to keep teaching. Effects were stronger for novice general educators, and the sample was elementary and middle school teachers in two states — not a high school result. journals.sagepub.com
    • National Center for Education Statistics (2024). School Pulse Panel, hiring and vacancies collection. 1,392 participating public K–12 schools, surveyed 13–27 August 2024. Special education was the hardest teaching area to staff: 74 percent of elementary and of middle and combined schools and 66 percent of high schools reported difficulty filling those vacancies, and only 77 percent of filled special education vacancies went to a fully certified teacher — eleventh of thirteen subject areas, against 89 percent for social studies. ies.ed.gov
    • CADRE (Center for Appropriate Dispute Resolution in Special Education). IDEA dispute resolution data summary for U.S. and outlying areas. Data for the 2021–22 school year, reported by states under IDEA Section 618: 29,490 due process complaints filed, 2,645 fully adjudicated, 6,160 written state complaints filed and 10,806 mediation requests; due process filings rose from 17,118 in 2011–12, and the share still pending at year end rose from 12 percent to 43 percent over the same decade. A more recent summary covering 2023–24 exists but could not be opened from this session, so only the 2021–22 figures are used here. cadreworks.org (PDF)

    Every source above was opened and read for this article. Where a figure could not be confirmed in the original, it is not on this page.


    About Clay Shumate

    Clay Shumate is a certified secondary Social Studies teacher in the public schools of West Alabama, with seven years of classroom experience, a B.A. in History, and an M.Ed. in Secondary Education. He writes about project-based learning, student responsibility, respect, and practical ways to hold young people to a higher standard while giving them room to learn from mistakes.
  • How Teacher Burnout Affects Students: What Shows Up, and What Doesn’t

    How Teacher Burnout Affects Students: What Shows Up, and What Doesn’t

    By Clay Shumate

    Teacher burnout shows up in students’ experience of the classroom long before it shows up in their test scores. The largest review to date links it clearly to weaker emotional support, weaker classroom management and lower student motivation — and almost not at all to achievement. The larger measured cost to students is what happens after a teacher leaves.

    This page is about outcomes measured on students, and it is the one article in this series written mostly for administrators and families rather than for the teacher carrying the load. For the word itself, start with the definition and the three dimensions behind every number on this page; for what a principal or district can change, the conditions an administrator can actually change and the measured size of each one covers it and this page does not restate it. What follows is narrower: when a teacher is burned out, what actually happens to the kids in the room, and how strong that evidence really is.

    Key takeaways

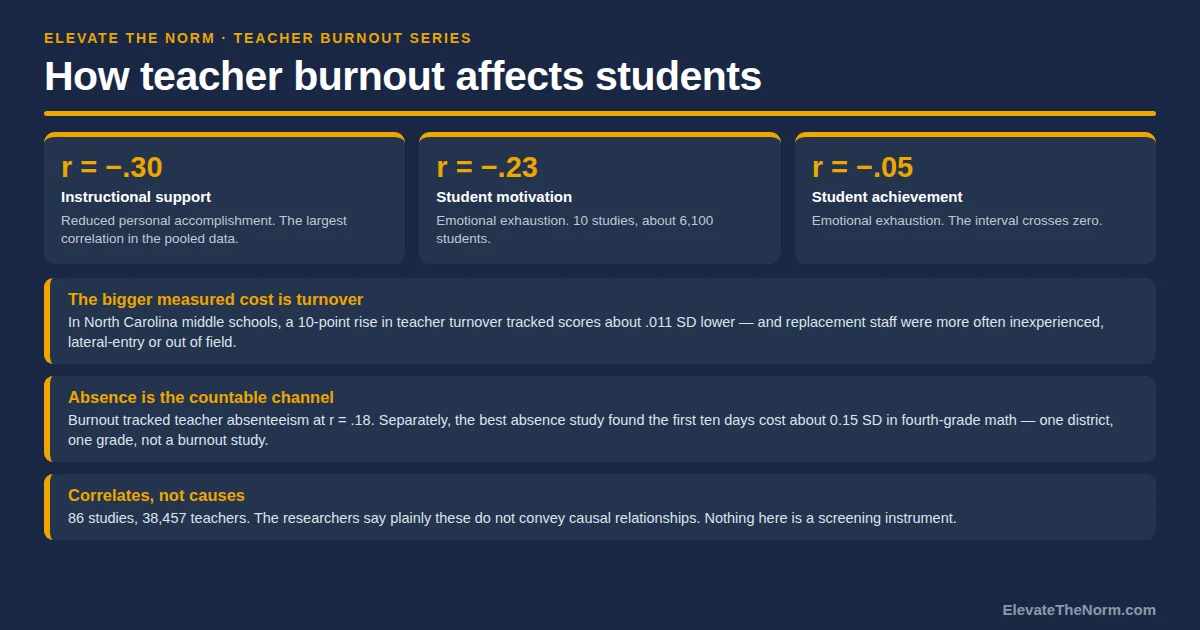
    • The effect lands on the classroom experience, not the score. In a 2026 meta-analysis of 86 studies and 38,457 teachers, burnout correlated with weaker emotional support, classroom management and instructional support at r = −.13 to −.30.
    • Student motivation is the clearest student-side link, at r = −.23 across ten samples and about 6,100 students. Achievement is the weakest link in the field: r = −.05, with a confidence interval that crosses zero.
    • There is little evidence linking teacher burnout to students’ depressive symptoms or emotional distress. The alarming version of this claim is not supported.
    • None of those pooled numbers says anything about an individual teacher. A correlation is a statement about tens of thousands of people at once.
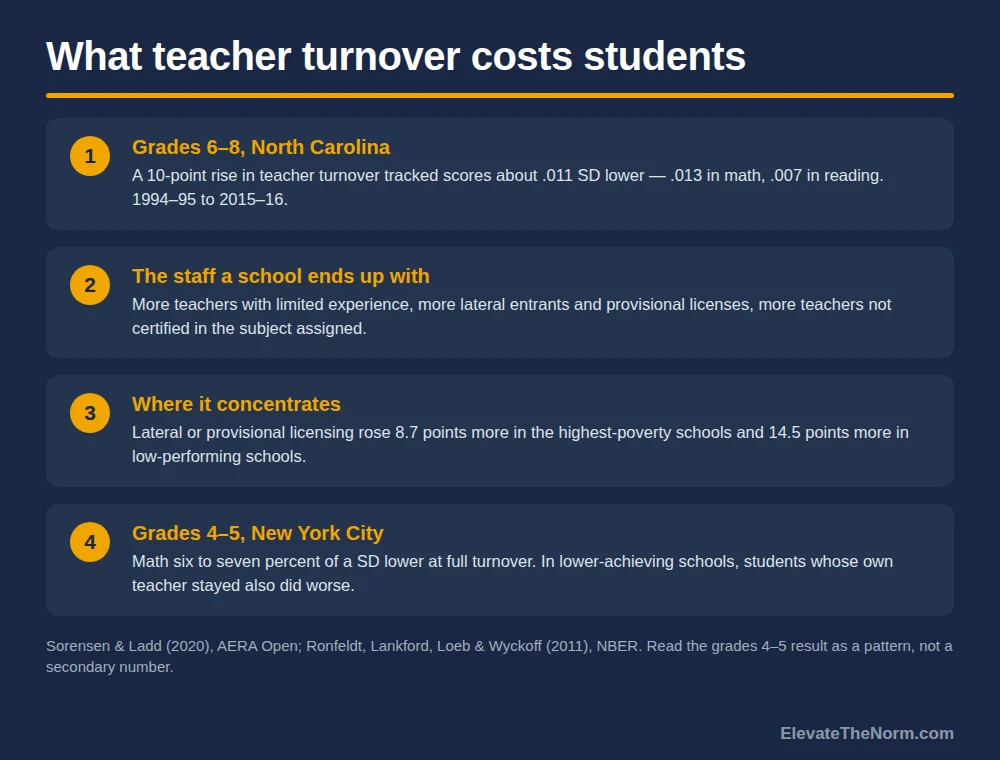
    • The bigger measured student cost is turnover. In North Carolina middle schools a 10-point rise in turnover tracked about .013 standard deviations lower math scores, and replacement staff were more often inexperienced, lateral-entry or teaching out of field.
    • Those effects are largest in the highest-poverty and lowest-performing schools, which makes this an equity question and not only a staffing one.
    • Almost none of this is causal. These are correlates — signals about conditions, not proof that one thing produced the other.
    • Burnout is an occupational condition, not a diagnosis anyone gives from a web page. Nothing here is a screening instrument or a way to assess an individual teacher.
    Free download

    The Student-Side Continuity Check

    Two printable pages. A write-in grid for the four building-level conditions behind every finding on this page, plus how to read the four answers together and what to do before acting on them. It measures a building, not a person. It is not a screening instrument and it returns no score. Free. No email address required. Designed for grades 6–12.

    Download the free PDF

    How does teacher burnout affect students?

    Mostly through the quality of the interaction, not the quantity of the learning. When researchers pool the studies, the strongest and most consistent associations are with how the room runs and how supported students feel in it. The weakest association in the whole pile is the one people quote most: test scores.

    The best current summary is a 2026 meta-analysis in Review of Educational Research by Gyde Wartenberg, Karen Aldrup, Simon Grund and Uta Klusmann, pooling 86 studies and 90 independent samples covering 38,457 teachers. It reports burnout’s three dimensions separately, which matters, because they do not behave alike.

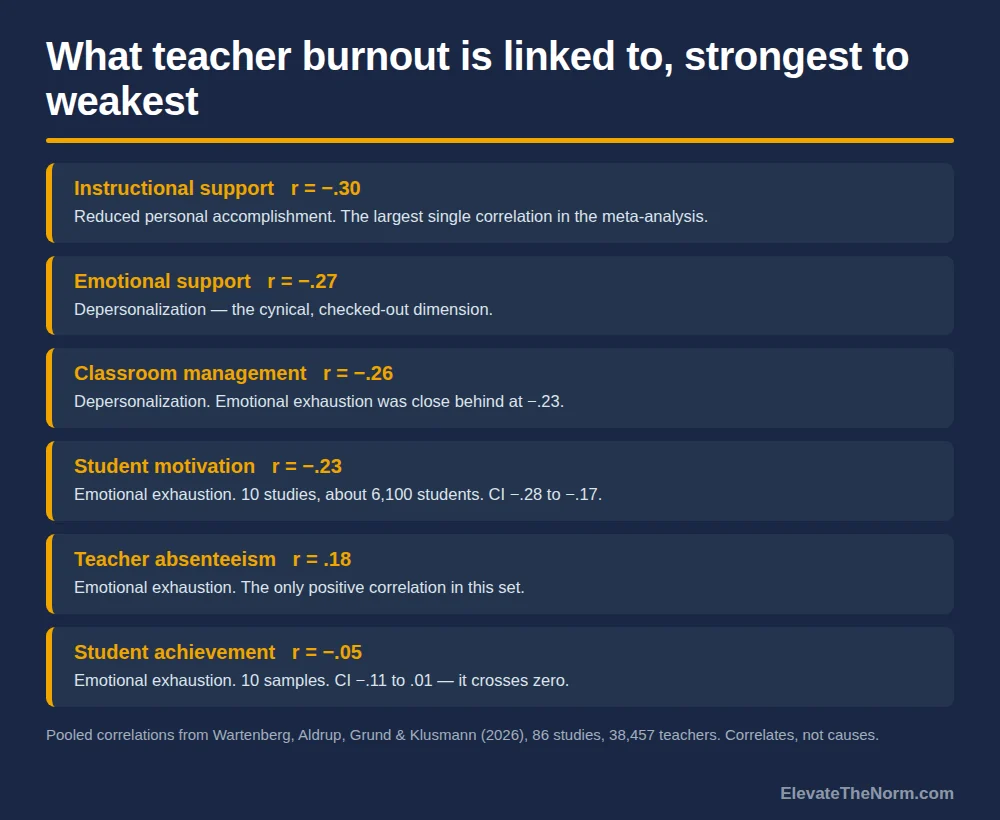
    Depersonalization — the cynical, checked-out dimension — is the one most tied to how students are treated. It correlated with lower emotional support at r = −.27 and with weaker instructional support at r = −.27. Emotional exhaustion tracked with classroom management at r = −.23. Reduced personal accomplishment tracked with instructional support at r = −.30, the largest single correlation in the set.

    Those are small to moderate correlations — a real signal, not a large one. A correlation of −.27 does not mean a burned-out teacher stops supporting students; it means the two move together across tens of thousands of people.

    One thing has to be said before anybody reads further, particularly any teacher who found this page while having a hard year. None of these numbers is about you. A pooled correlation across 38,457 people describes a tendency in a population. It cannot tell you anything about one classroom, and it is not a verdict on whether you are failing your students. Reading it as one is statistically wrong and it is also the exact self-blame that makes a hard year harder. What follows is an argument about how schools are staffed and scheduled, not evidence against any individual.

    Ranked list graphic of six pooled correlations between teacher burnout and outcomes: instructional support minus .30, emotional support minus .27, classroom management minus .26, student motivation minus .23, teacher absenteeism .18, and student achievement minus .05.
    The six pooled correlations in order of size. Student achievement is the weakest link in the set, not the strongest.

    Does teacher burnout lower students’ test scores?

    The evidence does not support it, and it is the single most repeated claim about teacher burnout and students. Emotional exhaustion and student achievement pooled to r = −.05 across ten independent samples, 95 percent confidence interval −.11 to .01. An interval that crosses zero means the data cannot rule out no relationship at all.

    The authors do not treat that as a surprise. They write that “individual student characteristics such as intelligence, prior knowledge, and conscientiousness…determine achievement to a large extent, thereby reducing the potential of teacher characteristics to influence student achievement.” Test scores are a noisy, slow-moving outcome with a lot of other things pushing on them.

    The earlier systematic review is a little more generous. Daniel Madigan and Lisa Kim, in the International Journal of Educational Research, went through 14 studies covering 5,311 teachers and 50,616 students — eight primary, six secondary. They found burnout associated with worse achievement “more often than not,” in four of seven studies, at small-to-medium effect sizes. Their verdict on the field is blunt: “It is almost cliché to bemoan the lack of longitudinal and rigorously designed studies.”

    So: four of seven studies found something, and the pooled estimate across ten samples is roughly nothing. Anyone telling you burned-out teachers demonstrably lower test scores is reporting half of that.

    What changes in the room that a student would actually notice?

    Autonomy, patience, and the sense that the teacher is present. This is where the secondary-specific evidence lives.

    Bo Shen and colleagues, in the British Journal of Educational Psychology, surveyed 1,302 high school students and their 33 physical education teachers across 20 schools in two demographically similar Midwestern districts, at the start and end of a semester. Teachers’ emotional exhaustion was negatively related to how much autonomy support students perceived. Depersonalization was inversely related to students’ autonomous motivation even after controlling for that perceived autonomy support — so the cynical dimension had a link to motivation running past the obvious channel.

    Two labels belong on that: physical education rather than a typical grades 6–12 academic classroom, and correlational over one semester. But it is a high school sample, which most of this literature is not, and the pattern matches the pooled numbers.

    What that looks like in practice is not dramatic. Fewer choices offered, because choices take setup. A shorter fuse on the fourth redirect. Feedback that gets thinner in March than it was in September. Students read all of that accurately, and they usually read it as being about them.

    One finding here a coach can genuinely use: the largest single correlation in the meta-analysis was between reduced personal accomplishment — the “none of this is working” dimension — and weaker instructional support. That dimension responds to evidence, because the belief underneath it is a factual claim about whether the work is landing, and claims like that can be checked. Making growth visible is a real intervention. It is also not a substitute for fixing a load that is genuinely too heavy, and a coaching cycle offered in place of staffing relief will be read as exactly what it is.

    Does it affect how students feel about school?

    Motivation, yes. Mental health, there is no good evidence for it.

    Motivation is the clearest student-reported finding in the meta-analysis: emotional exhaustion correlated with student motivation at r = −.23, 95 percent CI −.28 to −.17, across ten studies and about 6,108 students. That interval does not cross zero.

    The wellbeing claim is a different story, and it is worth saying out loud to any parent who has read a frightening headline. Madigan and Kim looked and reported “little evidence to suggest an association between teacher burnout and students’ depressive symptoms, emotional distress, or attempted suicide.” One study found exhaustion linked to slightly lower school satisfaction, a small effect. That is the whole finding. A teacher having a hard year is not measurably damaging children’s mental health, and claiming otherwise borrows a weight the research does not carry.

    Which is also why a teacher’s apparent state is not a subject for the class group chat. Speculating in public about whether a particular adult is struggling is a guess about somebody’s health, it travels faster than any correction, and it does nothing about the conditions that produced the problem.

    What happens to students when a teacher leaves?

    This is the largest measured student-side cost in the literature, and it has the strongest designs behind it. Burnout is not the only reason teachers leave, so treat it as a downstream consequence rather than a direct burnout effect.

    The most relevant study for grades 6–12 is Lucy Sorensen and Helen Ladd’s analysis in AERA Open, covering North Carolina middle schools — grades 6 through 8 — from 1994–95 through 2015–16. A 10 percentage point rise in teacher turnover was associated with scores about .011 standard deviations lower overall: .013 in math, .007 in reading. Small per unit, and they accumulate in buildings where turnover is chronic.

    Be honest about how small that is. A hundredth of a standard deviation is close to nothing for any individual child, and citing this study as proof that turnover is devastating students oversells it. The reason to act is not the effect size. It is the second finding, about what the school is left holding.

    Turnover has “marked, and lasting, negative consequences for the quality of the instructional staff.” Schools with more churn ended up with higher proportions of teachers with limited experience, more lateral entrants and provisional licenses, and more teachers not certified in the subject they were assigned. And the effect concentrated: the increase in lateral or provisionally licensed staff was 8.7 percentage points larger in the highest-poverty schools and 14.5 points larger in low-performing schools.

    An earlier New York City study points the same way. Across roughly 625,000 observations of fourth and fifth graders, Matthew Ronfeldt and colleagues found math scores six to seven percent of a standard deviation lower in a grade-year with complete turnover than in one with none. The finding that matters most: the damage was not limited to students who got a new teacher. In lower-achieving schools, students whose own teacher stayed also did significantly worse when turnover around them was high; in higher-achieving schools there was no such effect. That is grades 4 and 5, so read the pattern, not the number.

    Four-card graphic on teacher turnover and student achievement: the North Carolina grades 6 to 8 finding, the change in staff composition, where the effects concentrate by school poverty, and the New York City grades 4 to 5 result.
    The turnover evidence, with each study labelled by its grade range. The grades 4–5 result is a pattern, not a secondary number.

    Do teacher absences cost students learning?

    The best study on this found a real effect — and it is a fourth-grade result in one district. Raegen Miller, Richard Murnane and John Willett examined 6,166 students and 231 teachers across 73 schools in a large urban district over two school years. The first ten days of teacher absence were associated with about 0.15 of a standard deviation lower fourth-grade math achievement.

    That is the biggest number on this page, which is exactly why the caveats travel with it. One district, one grade, mathematics only — English Language Arts effects were smaller and inconsistent — leaning on instrumental variables with 16 to 24 percent of prior achievement values imputed. It is also not a burnout study. People are absent for many reasons unrelated to the job.

    It matters here for one reason: the meta-analysis found emotional exhaustion associated with absenteeism at r = .18. If exhaustion raises absence a little and absence costs learning a lot, coverage is one of the few places where the student cost of a depleted staff becomes visible and countable. It sits alongside the student-attendance side of the same problem, tracked closely for the same reason.

    One wrong turn is worth naming before somebody takes it. A school that answers a coverage number by leaning on staff not to take sick days has reduced nothing except its own visibility into the problem. Absence is a symptom of a staffing plan with no slack. Suppressing it leaves the plan as it was and adds sick adults to a building full of teenagers.

    How much of this is actually cause and effect?

    Very little of it, and the researchers say so first. This section exists because the honest version of this topic is weaker than the version that circulates.

    The meta-analysis authors are explicit that they “refer to teacher absenteeism, teacher–student interactions, and student motivation and achievement as correlates” and that these “do not convey causal relationships.” Of 31 longitudinal studies they identified, only 11 reported longitudinal correlations between earlier burnout and later outcomes, and that evidence was mixed — it supported the motivation finding better than the achievement finding.

    There is also a measurement problem that cuts against the strongest numbers. Correlations were stronger when the classroom-quality rating came from the teacher’s own self-report than from an outside observer. A tired teacher rating both their exhaustion and their own classroom management harshly produces a correlation without anything happening in the room. The external-observer estimates were weaker.

    And the arrow may run backwards. A class that is genuinely hard to teach can exhaust a teacher, rather than an exhausted teacher making the class hard. Nothing in a cross-sectional correlation can separate those, and both are probably true at once. The practical reading is the uncomfortable one: you should take these findings seriously enough to fix conditions, and not seriously enough to blame a person.

    What can a school check, without turning it into a file on a teacher?

    Check the conditions, not the people. Everything above points at building-level facts that are already recorded somewhere. None of it requires assessing an individual teacher’s state of mind, and none of it should ever be written down next to a teacher’s name.

    Four things are countable, and all four sit with whoever builds the schedule and the budget rather than with the person in the classroom.

    • Continuity. How many sections changed teachers mid-year, and how many positions turned over between June and August? Sorensen and Ladd’s finding is about the staff a school ends up with, so watch who arrived, not only who left. Mostly central office — hiring and retention.
    • Assignment fit. How many teachers are teaching outside the field they are certified in? That was one of the specific quality losses the North Carolina data documented, and it is already in the staffing file. Shared — and often a supply problem rather than a choice, which makes it a diagnostic rather than an accusation.
    • Coverage load. How often is a class covered by someone other than its teacher, and how is that spread across the building? Absence is not a behavior problem to manage down. High coverage says the staffing plan has no slack in it. Building level — a principal can usually see and change this one.
    • What students say about the room. Not about the teacher — about the room. Do they get choices in how they show what they know? Do they know what happens next? Climate surveys already ask this, and answers aggregate by course or grade without naming anybody. Building level.

    Three lines stay attached to that list. It measures a building, not a person, so never write a teacher’s name on it and never let it feed an evaluation — a name in a box turns a diagnostic into an informal personnel record with none of the protections a real evaluation carries. It is not a burnout screen: no validated cutoff turns any of these numbers into a finding about an individual, and treating a bad number as evidence that a particular teacher is burned out is unsupported and unfair. And if you act on what you find, write the rule for who qualifies before you apply it to anyone, because a private fix for one teacher creates a fairness problem for everyone else in the hallway.

    Numbered list graphic of four building-level conditions a school can check: continuity, assignment fit, coverage load, and what students say about the room, with a highlighted note that it measures a building rather than a person and is not a burnout screen.
    Four conditions that are already somewhere in a school’s data. None of them assesses an individual teacher.

    Is student behavior why teachers burn out?

    No. This series has answered that four times now and the answer does not change. Managing behavior is real work and the most commonly named stressor in the national survey data, but a class of teenagers behaving like teenagers is the job, not a malfunction. What turns ordinary classroom demand into burnout is how much of it one person absorbs without help, and that is a scheduling and staffing decision. the demand side, and how good the evidence behind each piece of it is goes through that in detail.

    The students who need the most redirecting usually have reasons nobody in the room has been told about, and handling the behavior itself without spending the relationship is a separate skill from carrying an unreasonable load. The two problems get confused constantly, and only one of them is fixable inside the classroom.

    If you are a student reading this because you are worried about a teacher: you did not cause it, and it is not your job to fix it. Being decent to them is a good thing to do and it is not the solution to a workload problem.

    What to do next

    If you are an administrator, pull those four numbers for one grade level and look at them together. They are already in your data. If any of them is bad, the fix is a schedule or budget decision, not a conversation about resilience — which decisions those actually are is the companion page.

    If you are a parent, the useful question at a conference is not whether a teacher seems tired. It is whether the course has had the same teacher all year, whether it is taught by someone certified in the subject, and how often it is covered by someone else. Those are answerable, and they are about the school’s plan rather than a person.

    If you are a teacher and this page is why you are here: the research says the cost of an under-resourced job lands on your relationships with students before it lands on their scores. what getting back on your feet actually involves is the recovery side. Nobody gets credit for absorbing a staffing problem quietly, and students do not benefit from it either.

    Want the four conditions as a printable? Download The Student-Side Continuity Check (2 pages, free, no email required) and fill it in for one grade level before your next leadership meeting.

    Frequently asked questions

    How does teacher burnout affect students?

    Mostly through the quality of the classroom interaction rather than through achievement. In a 2026 meta-analysis of 86 studies covering 38,457 teachers, burnout correlated with weaker instructional support (r = -.30 for the reduced-personal-accomplishment dimension), weaker emotional support and classroom management (around r = -.27), and lower student motivation (r = -.23). Its correlation with student achievement was r = -.05, with a confidence interval that crosses zero. All of these are correlates. The researchers state plainly that they do not convey causal relationships.

    Does teacher burnout lower test scores?

    The pooled evidence does not support that claim, even though it is the version most often repeated. Across ten independent samples, emotional exhaustion and student achievement came out at r = -.05, 95 percent CI -.11 to .01. An earlier systematic review of 14 studies found burnout linked to worse achievement in four of seven studies at small-to-medium effect sizes, so the literature is split. The honest summary is that the achievement link is the weakest one in the field, not the strongest.

    Should I move my child out of a burned-out teacher’s class?

    The research gives you very little support for that decision. The measured achievement effect is close to zero, and a mid-year schedule change has real costs of its own: a new teacher who does not know your child, a break in the relationships that make a class work, and a knock-on effect for whoever gets moved to make room. The more useful questions are about the course rather than the person: has this section had the same teacher all year, is it taught by someone certified in the subject, and how often is it covered by somebody else. If your child is telling you something specific about how the class runs, that is worth raising directly with the school. A guess about an adult’s mental state is not.

    I think my teacher has checked out. Is there anything I can do?

    Describe the class, not the person. “I don’t know what we’re supposed to be doing most days” is something a counselor, a department chair or another trusted adult can act on. “My teacher is burned out” is a diagnosis you are not in a position to make, and it will usually land as a complaint about someone rather than a description of a problem. Be clear that you are trying to learn, not trying to get anyone in trouble. And be straight with yourself about the limit here: an adult’s workload is not a student’s responsibility to manage, and nothing about a teacher having a hard year is your fault or your job to fix.

    Is student behavior the reason teachers burn out?

    No. Managing behavior is real work and teachers name it more often than anything else when national surveys ask what stresses them, but a room of teenagers behaving like teenagers is the job rather than a malfunction. What turns ordinary classroom demand into burnout is how much of it one person is expected to absorb without support, and that is a scheduling, staffing and budget decision made by adults with titles. Students are not the cause.

    Does a teacher leaving mid-year hurt students?

    The evidence on turnover is the strongest student-side evidence in this whole area, and the effects are real but small per unit. In North Carolina middle schools, a 10 percentage point rise in teacher turnover was associated with test scores about .011 standard deviations lower. The more consequential finding is about staff composition: schools with more churn ended up with more inexperienced teachers, more lateral entrants and provisional licenses, and more teachers assigned outside their certification, and those shifts concentrated in the highest-poverty and lowest-performing schools.

    How can a school tell whether burnout is affecting its students?

    By checking conditions rather than people. Four things are already in most schools’ data: how many sections changed teachers mid-year and how many positions turned over in the summer; how many teachers are assigned outside their certified field; how often classes are covered by someone other than their teacher and how that is distributed; and what students already say on climate surveys about choice and clarity in their courses. Read those four together for one grade level. None of them requires assessing an individual teacher, and none of them should ever be recorded next to a teacher’s name.

    Is there a way to screen teachers for burnout?

    Not one that belongs in a school’s hands, and this site does not publish one. The research instruments used in these studies have no clinically validated cutoff, which means there is no defensible threshold at which a number becomes a finding about a person. A school using an informal checklist to decide that a particular teacher is burned out is making an unsupported judgment and creating a quasi-personnel record at the same time. Burnout is an occupational condition, not a diagnosis anyone should be handing out. If a teacher is struggling, the next step is a conversation with a person, and for their own health, with their doctor or a counselor.

    Sources

    • Wartenberg, G., Aldrup, K., Grund, S., & Klusmann, U. (2026). How strongly is teachers’ burnout related to teacher absenteeism, teacher–student interactions, and student motivation and achievement: A meta-analysis and systematic review. Review of Educational Research. 86 studies, 90 independent samples, 38,457 teachers. Pooled correlations used on this page: instructional support −.30 (reduced personal accomplishment), emotional support and instructional support −.27 (depersonalization), classroom management −.26 (depersonalization) and −.23 (emotional exhaustion), student motivation −.23 (95% CI −.28 to −.17, 10 studies, ~6,108 students), absenteeism .18, student achievement −.05 (95% CI −.11 to .01, 10 samples). Limitations stated by the authors: these are correlates and “do not convey causal relationships”; only 11 of 31 longitudinal studies reported longitudinal correlations; self-reported classroom quality produced stronger correlations than external ratings. Egger’s tests indicated no evidence of publication bias. journals.sagepub.com
    • Madigan, D. J., & Kim, L. E. (2021). Does teacher burnout affect students? A systematic review of its association with academic achievement and student-reported outcomes. International Journal of Educational Research, 105. 14 studies, 5,311 teachers and 50,616 students; 8 primary settings and 6 secondary; 8 cross-sectional, 4 longitudinal, 2 experimental. Burnout associated with worse achievement in four of seven studies at small-to-medium effect sizes; “little evidence to suggest an association between teacher burnout and students’ depressive symptoms, emotional distress, or attempted suicide.” Read as the accepted manuscript in the White Rose repository. eprints.whiterose.ac.uk (PDF)
    • Shen, B., McCaughtry, N., Martin, J., Garn, A., Kulik, N., & Fahlman, M. (2015). The relationship between teacher burnout and student motivation. British Journal of Educational Psychology, 85(4), 519–532. 1,302 high school students and 33 physical education teachers across 20 schools in two demographically similar Midwestern U.S. districts, surveyed at the start and end of a semester and analysed with hierarchical linear modelling. Emotional exhaustion negatively related to perceived teacher autonomy support; depersonalization inversely related to student autonomous motivation controlling for autonomy support. Read via the abstract in the ERIC record; the full text sits behind Wiley and was not accessible, so nothing beyond the abstract is claimed here. eric.ed.gov
    • Sorensen, L. C., & Ladd, H. F. (2020). The hidden costs of teacher turnover. AERA Open, 6(1). North Carolina middle schools, grades 6–8, 1994–95 through 2015–16, math and English Language Arts. A 10 percentage point increase in turnover associated with about .011 standard deviations lower scores overall (.013 math, .007 reading); “marked, and lasting, negative consequences for the quality of the instructional staff”; the rise in lateral or provisionally licensed staff was 8.7 percentage points larger in the highest-poverty schools and 14.5 points larger in low-performing schools. Limitations stated by the authors: no value-added measures of teacher quality, and some student characteristics available only in select years. journals.sagepub.com
    • Ronfeldt, M., Lankford, H., Loeb, S., & Wyckoff, J. (2011). How teacher turnover harms student achievement (NBER Working Paper No. 17176). Roughly 625,000 observations of 4th and 5th grade students in New York City, 2000–2002 and 2004–2007. Math scores six to seven percent of a standard deviation lower in grade-years with 100 percent turnover than with none; in lower-achieving schools, students whose own teacher stayed also performed significantly worse when turnover was high, while in higher-achieving schools there was no such effect. Grades 4–5, not a secondary result. Later published as Ronfeldt, Loeb & Wyckoff (2013), American Educational Research Journal, 50(1); the working paper is the version read here. nber.org (PDF)
    • Miller, R. T., Murnane, R. J., & Willett, J. B. (2006). The impact of teacher absences on student achievement. Harvard Graduate School of Education / NBER Summer Institute. 6,166 fourth-grade students, 231 teachers, 73 schools in one large urban district, school years 2003 and 2004. The first ten days of teacher absence associated with about 0.15 of a standard deviation lower fourth-grade mathematics achievement. Limitations stated by the authors: one district, one grade, mathematics only (English Language Arts effects smaller and inconsistent), reliance on instrumental variables, and 16–24 percent of prior achievement values imputed. Grade 4, and an absence study rather than a burnout study. Later published in Educational Evaluation and Policy Analysis, 30(2). conference.nber.org (PDF)

    Every source above was opened and read for this article. Where a figure could not be confirmed in the original, it is not on this page.


    About Clay Shumate

    Clay Shumate is a certified secondary Social Studies teacher in the public schools of West Alabama, with seven years of classroom experience, a B.A. in History, and an M.Ed. in Secondary Education. He writes about project-based learning, student responsibility, respect, and practical ways to hold young people to a higher standard while giving them room to learn from mistakes.
  • How to Avoid Teacher Burnout: Teach 120 Students, Not Five Classes

    How to Avoid Teacher Burnout: Teach 120 Students, Not Five Classes

    Every teacher hits a wall. It does not matter if you are in your first year or your twenty-fifth — though the year-one version of it is a different shape, and a different fix. It usually shows up a few weeks into a grading period, when the calendar has no days off in sight and you have to grind it out, the same way the long stretch after spring break feels every year. If you are searching for how to avoid teacher burnout right now, you are probably in that stretch. And if you are not yet sure whether it is the stretch or something that is no longer lifting, the three symptoms and what separates them from an ordinary hard patch are worth reading first.

    I want to start with something you may not believe yet: if your students are showing up, smiling, talking to you and to each other, and picking up the soft skills and life skills that do not show up on a test, you are doing an incredible job. Burnout lies to you about that, and the research on what it actually costs students is far less damning than the version you have probably read. The rest of this article is what I actually do to keep the wall from winning.

    Key Takeaways

    • Burnout is a work problem, not a character flaw. The World Health Organization defines it as the result of chronic workplace stress that has not been successfully managed.
    • Teachers report it far more than other workers. In RAND’s 2025 survey, 53 percent of teachers reported burnout, compared with 29 percent of similar working adults.
    • Ask “what can I do today,” not “what do I need to do today.” One question is a to-do list you can never finish. The other is a day you can win.
    • Teach 120 students, not five classes. Every room is its own ecosystem, and every student in it needs something different.
    • Make the first call home a compliment. Then stop talking and listen. It changes every call that comes after it.
    • Treat your observer as a second set of eyes, and take the day off before you need a week off.

    Free Download · 2-page PDF

    Compliment-First Parent Call Planner

    The four-step first call and the five-move follow-up call on one page, a log to track who you have reached, and a tracker for three-minute one-on-one conversations with every student.

    Download the free PDF

    Free. No email address required. Designed for grades 6–12. Browse every printable in Your Free Library.

    What Teacher Burnout Actually Is

    Teacher burnout is exhaustion that comes from the job itself and does not go away with a normal weekend. The World Health Organization classifies burn-out as an occupational phenomenon, not a medical condition, and defines it as a syndrome resulting from chronic workplace stress that has not been successfully managed. It has three parts: feeling drained of energy, feeling mentally distant or cynical about your job, and feeling like you are no longer effective at it. If you want the fuller picture — the three dimensions the research actually measures, what the 2026 survey numbers say, and which parts of the problem belong to the building rather than to you — start with the complete guide to what burnout is and who can fix it.

    That third part is the one I see teachers underestimate. Burnout does not just make you tired. It convinces you that you are bad at teaching, and that belief makes the tiredness worse. So avoiding teacher burnout is partly about rest, and partly about measuring your work correctly. And if a percentage you have seen quoted is part of why you are here, it is worth knowing which survey it came from and what it actually asked — the four best-known figures measured four different things.

    Why It Hits a Few Weeks Into the Grading Period

    The numbers explain why so many of us feel it at the same time. In RAND’s 2025 State of the American Teacher survey, 61 percent of teachers reported frequent job-related stress and 53 percent reported burnout, compared with 41 percent and 29 percent of similar working adults. Teachers averaged about 49 hours a week, roughly ten more than they were contracted for. The burnout number was down from 60 percent the year before, which is good news, but it is still more than half of us.

    Then there is the calendar. The first weeks of a grading period run on adrenaline. By the middle, the adrenaline is gone, grades are due, the next break is far away, and every small problem feels heavier than it is. Nothing about you changed. The load did.

    Measure Your Day the Right Way

    When I feel the wall coming, I go back to what actually matters. Are the kids coming to class? Are they smiling? Are they talking? Am I helping them get better at the things they will need for the rest of their lives: showing up, communicating, working with people they did not choose? If the answer is yes, then I am doing my job, and so are you.

    That is not a pep talk. It is a correction. A 2026 systematic review of 55 studies of middle and secondary school teachers found that positive teacher-student relationships were associated with every aspect of teacher wellbeing the researchers measured, from positive emotion to a sense of accomplishment. The authors are careful to say most of those studies used tools designed for elementary classrooms, and the studies show association, not cause. But the direction lines up with what most of us feel: the relationships are not a distraction from the work. They are the part of the work that refills you.

    Measuring the day well also means being able to see it later. Ten minutes a week in a running record of what you tried and what happened will tell you in February whether the bad weeks are a pattern or a run of bad luck — and which of the two you are dealing with changes what you should do about it.

    Side-by-side comparison of two questions to start a school day. What do I need to do today is described as an endless list measured against a plan; what can I do today admits the day has a limit and points at who is in the room
    One question is a list you can never finish. The other is a day you can win.

    Ask “What Can I Do Today?” Instead of “What Do I Need to Do Today?”

    This is the biggest mindset shift I know of for avoiding teacher burnout. “What do I need to do today” is a list that never ends. There is always another stack to grade, another email, another form. You go home every single day having failed the list.

    “What can I do today” is a different question. It admits that the day has a limit, and it points you at what is actually in front of you. It is also the question that makes the next idea possible, because what you can do today depends on who is actually in your room today.

    Stop Teaching a Class. Teach 120 Students.

    Every classroom is its own ecosystem. Inside an ecosystem, every living thing needs something different to survive. Students are not animals, obviously, but the principle holds: every student in your room needs something different to succeed.

    If you view a class as one class, in my opinion, you will fail as a teacher. If you view it as 20 to 30 individual students who all need different things, you have a chance. So if you have 120 students across your day, think of it as 120 different lesson plans. That sounds like a faster road to burnout, not a way out of it. It is not, and here is why: you stop fighting the day for being different from the plan.

    This is also why I do not put much faith in extremely detailed lesson plans. Say you teach the same subject five periods a day. I can write the plan, and so can you. But the only thing on it I can guarantee is that my students will work on the driving question and keep moving toward it. I do not know if first period will get interrupted, if a fight will break out in fourth, or if sixth will need more one-on-one time and slow down. Plan the goal firmly. Plan the path loosely. The day you stop expecting every period to follow the script is the day the script stops making you feel like a failure.

    Spend the First Days Getting to Know People, Not Reading Rules

    Most of us spend the first three or four days of school reciting rules. If you teach high school, you do not need to. Hand out the syllabus and let students read most of it themselves. A fill-in-the-blank version moves even faster, and you can spot-check it for a first grade in the gradebook. If you want a plan for the routines themselves, start with this guide to classroom routines and procedures.

    Use the time you save to genuinely get to know every student. At the start of every new year or semester, I sit down one-on-one with each student for about three minutes, and I get through all of them within the first three school days. Three minutes is short enough to fit and long enough for a student to realize you actually want to know who they are. It is also where you learn, without making a big production of it, who lives at home and who to call.

    Do the math and it is less than it sounds: 30 students at three minutes each is about 30 minutes a class period across three days, which is roughly the time the rules speech was going to take anyway. One caution from the parent and student side of this: keep anything touching home life optional. The point is to learn which adult to call, not to collect a family’s business.

    Make the First Call Home a Compliment

    When you call from a school number, you will scare a parent. Back when I worked as a retail manager, every time a customer asked for the manager, I took a deep breath, because I knew what was coming. Nine times out of ten, I was right. Parents answering a call from the school feel exactly the same way.

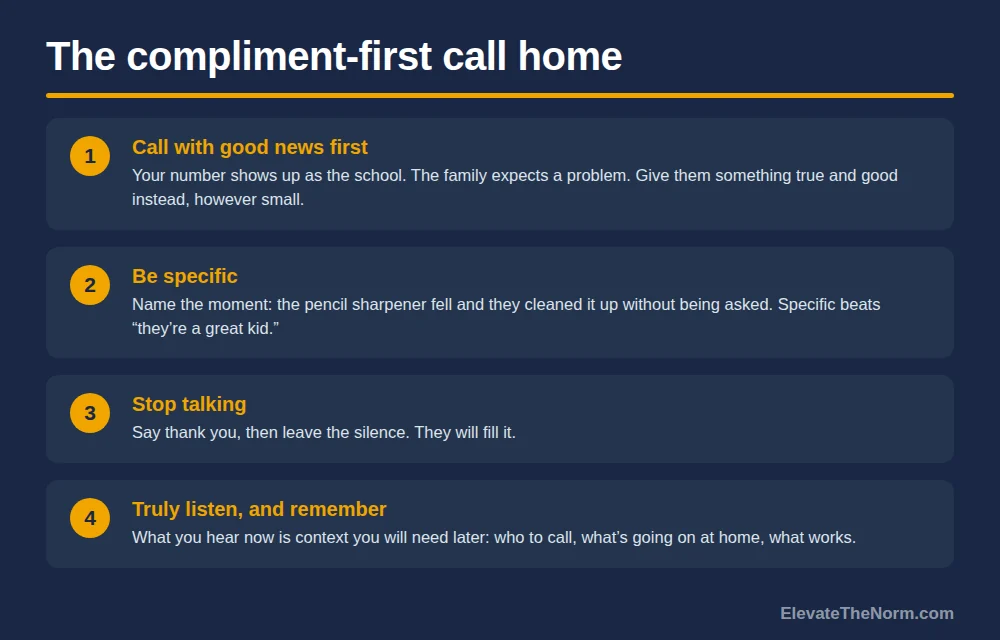
    So the first call is always a compliment, and it does not matter how small. Something like: I am really glad your son was in my class today, because the pencil sharpener fell and he cleaned the whole mess up without being asked, and I wanted you to know you have a thoughtful kid. Then stop talking.

    Four numbered steps for a compliment-first call home: call with good news first, be specific, stop talking, and truly listen and remember
    The first call home should be good news. Then stop talking and listen.

    They will talk. And when they do, you have two jobs. The first is to truly listen. That is a skill I think teachers are losing, with students and with the adults who raise them, and without it we have no idea what is actually going on in a kid’s head. The second job is to remember what you heard, because you will need it.

    I also send a general letter home to every family early in the year saying how excited I am to have their student in class. Between the letter and the first call, the second conversation starts from trust instead of fear. If you want a simple way to keep track of who you have reached, a parent-teacher communication log does the job, and there are apps built for this if your families prefer text.

    When the Next Call Is About a Problem

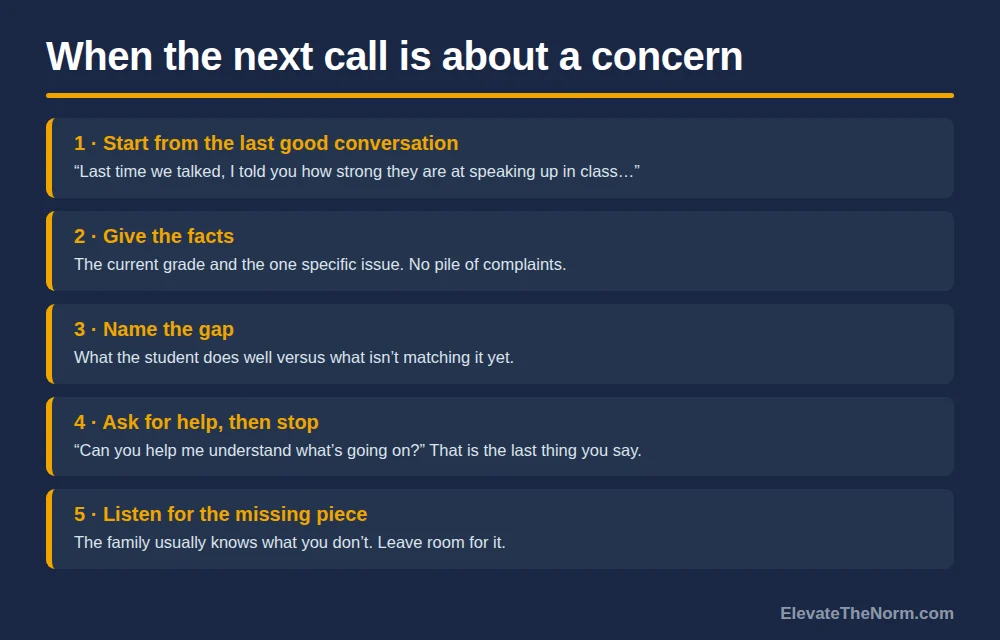
    Here is what the compliment call buys you. This year, I had to call about a student who was not progressing the way I had hoped. The guardian picked up, I explained the situation, and because we had already talked once about something good, and because she had already gotten my letter, she worked with me instead of against me. Now that student is turning in work, keeping their head up in class, and at least thinking about participating. They are involved in a way they were not before.

    Years ago, teaching middle school, I made the same kind of call to the grandmother of a student who would not stop talking and was interrupting class. Because we had spoken before, I could say: last time I told you how strong he is at verbal communication, so I am confused about why his written work does not match. Can you help me understand? Then I stopped. I had told her the grade, the problem, and the specific gap between what he does well and what he does not. She filled in the rest, and you would be surprised how much information you get when you leave room for it.

    Five steps for a parent call about a concern: start from the last good conversation, give the facts, name the gap, ask for help and then stop, and listen for the missing piece
    When the next call is about a problem, the first call has already built the trust you need.

    The research backs the pattern. In a randomized experiment with sixth and ninth graders in a summer program, daily teacher contact with families increased the odds of homework completion by 40 percent, cut the times teachers had to redirect students by 25 percent, and raised participation by 15 percent. The researchers credited stronger teacher-student relationships, more parent involvement, and more student motivation.

    There is an honest wrinkle worth knowing. In a follow-up high school study, weekly messages about what students could improve produced the largest gains in earning course credit, somewhat larger than messages about what they were doing well, though the difference between the two was not statistically clear. I read that as support for doing both in order: the compliment call earns the trust, and the next call spends it on something specific and actionable.

    Treat Your Observer as a Second Set of Eyes

    Newer teachers panic about observations. Remember that, like in any other job, your observer is there first to give you another set of eyes, and they can give you extremely useful information if you listen when they come back. If you stop listening the moment you see a low score and decide you know better than they do, you lose.

    There is evidence on this, too. A study of mid-career teachers in a classroom-observation-based evaluation system found that teachers were more effective in the years after being evaluated, with the largest improvements among teachers who had been performing relatively poorly beforehand. The feedback only worked because the teachers used it. Ask for one specific change, make it, and invite the observer back to see it. If you want a structure for that thinking, these teacher reflection examples are a good place to start.

    Take the Mental Health Day Before You Need a Week

    If you remember three words from this article, make them mental health days. A day off taken when you first notice the signs costs far less than a week taken after you have run empty. Leave a sub plan that works without you, and do not spend the day grading. If you teach on an IEP caseload, the special education version of this is a different set of demands and the coverage question is harder.

    RAND’s 2025 work-life balance findings say the same thing from a different direction: 46 percent of teachers said their job left them too tired for their private lives, compared with 13 percent of similar working adults, and teachers said that leadership support for flexibly using paid leave improved their balance. Fewer than half said their school or district was making efforts to help — and what those efforts would have to consist of to count is its own question. So until yours does, take the leave you have earned. I will write more about mental health days on their own soon. And if rest does not lift the exhaustion, that is a reason to talk with a doctor or your district’s employee assistance program, not a reason to push harder.

    The Short Version

    How to avoid teacher burnout comes down to a few habits you can start tomorrow: measure your day by whether students showed up, smiled, and grew; ask what you can do today; teach individuals instead of a class; make the first call home good news and then listen; hear your observer out; and take the day before you need the week. If you are newer to all of this, the guide to classroom management for new teachers and this piece on building relationships with students pick up where this one leaves off.

    You are doing a better job than the wall is telling you.

    Before you go: grab the free Compliment-First Parent Call Planner (PDF) — ElevateTheNorm.com branded, printable, no email required.

    And if you are reading this past the point where prevention is the right word — if the summer came and went and nothing changed — that is a different problem with a different answer. Here is what the research actually supports once the tank is already empty. And if what you want is the list of places to go once prevention has stopped applying, that is a separate page.

    Frequently Asked Questions

    What is the fastest way to avoid teacher burnout in the middle of a grading period?

    Change the question you start the day with. Instead of listing everything you need to do, ask what you can do today, and let the rest wait until tomorrow. Then make one positive phone call. It is the most reliably good conversation a teacher can have in a school day, and it pays you back the next time you have to call that same family about a problem.

    Do I really have to call every family? I have more than a hundred students.

    No one can make 120 calls in a week, and trying to is its own route to burnout. Spread them out: three to five a day across the first several weeks reaches everyone by the end of the grading period. A short welcome letter home covers every family on day one while the calls catch up. If a family prefers text or email, or does not have reliable phone access, use that instead. The point is that the first contact is good news, not that it happens by phone.

    What if I cannot find anything positive to say about a student yet?

    Look smaller. The compliment does not need to be about grades. A student who held the door, helped someone find the page, or came in and sat down without being asked has given you something true to say. If you truly have nothing after a week, that tells you something too: you have not gotten to know that student yet, and that is the first thing to fix.

    How do you fit a three-minute conversation with every student into the first three days?

    Do the math first: 30 students at three minutes each is 90 minutes per class, or about 30 minutes a class period across three days. That is time most of us already spend reading the syllabus aloud. Hand out the syllabus, let students work through it, and pull students one at a time for a short conversation. Keep any question about home life optional. The goal is to learn who a student is and which adult to call, not to collect details about a family.

    My school requires detailed daily lesson plans. Does this approach conflict with that?

    It does not have to. Turn in what your school requires. The point is where you put your confidence: the one part of the plan you can guarantee is the learning goal or driving question, and everything else will bend around the interruptions, pull-outs, and bad days that no plan predicts. Plan the goal firmly and plan the path loosely.

    How should I handle a low observation score?

    Listen before you defend. An observer is one more set of eyes in a room you usually see alone, and research on classroom-observation evaluation found that mid-career teachers got measurably better after being evaluated, with the biggest gains among those who started lowest. Ask for one specific thing to change, change it, and invite the observer back to see it.

    When is it time to take a mental health day?

    Before you need a week. A day off taken when you notice the early signs, such as dreading the building every morning or feeling that nothing you do is working, costs far less than one taken after you have run completely empty. Know your district’s leave policy, leave a sub plan that works without you, and do not spend the day grading. If the exhaustion does not lift with rest, talk with a doctor or your district’s employee assistance program.

    Prevention is the cheapest version of this, and it is not the only version. If you are already past it and weighing whether to stay at all, the numbers on what actually happens to teachers who leave are worth reading before you decide either way — they are less one-sided than the career-change advice suggests.

    Sources

    • RAND Corporation. Steiner, E. D., Levine, P. R., Doan, S., & Woo, A. (2025). Teacher Well-Being, Pay, and Intentions to Leave in 2025: Findings from the State of the American Teacher Survey. Report — surveyed January–March 2025; 61% frequent job-related stress and 53% burnout among teachers vs. 41% and 29% of similar working adults; 49-hour average work week.
    • RAND Corporation. (2025). To Make Teaching Sustainable, Help Teachers Balance Work and Personal Demands: Findings from the 2025 State of the American Teacher Survey. Report — 46% of teachers vs. 13% of similar adults too tired for private life; leadership support for flexible leave use.
    • World Health Organization. (2019). Burn-out an “occupational phenomenon”: International Classification of Diseases. News release — ICD-11 definition and its three dimensions.
    • Allen, K.-A., Lai, R., Southam, J., Mageean, L., & Roffey, S. (2026). Associations between teacher-student relationship quality and middle and secondary school teachers’ wellbeing: A systematic review. Educational Psychology Review. Article — 55 studies; associations, with measurement mostly borrowed from primary-school research.
    • Kraft, M. A., & Dougherty, S. M. (2013). The effect of teacher-family communication on student engagement: Evidence from a randomized field experiment. Journal of Research on Educational Effectiveness, 6(3). ERIC record — sixth and ninth graders, mandatory summer program.
    • Kraft, M. A., & Rogers, T. (2015). The underutilized potential of teacher-to-parent communication: Evidence from a field experiment. Economics of Education Review, 47. Abstract — high school credit recovery; improvement-focused messages produced the largest effects.
    • Taylor, E. S., & Tyler, J. H. (2012). The effect of evaluation on teacher performance. American Economic Review, 102(7), 3628–3651. Abstract — mid-career teachers more productive after evaluation, largest gains among lower performers.

    Every link above was checked on September 18, 2026. The classroom stories on this page are the author’s own, with identifying details removed; nothing in them is invented or composited.

    If prevention habits are not landing, the next question is which demand is defeating them. Which of those loads is actually yours, and what the evidence behind each one is worth walks through the ranked national figures, what they do and do not establish, and a five-day log you can run to find out.


    About Clay Shumate

    By Clay Shumate — Clay Shumate is a certified secondary Social Studies teacher in the public schools of West Alabama, with seven years of classroom experience, a B.A. in History, and an M.Ed. in Secondary Education. He writes about project-based learning, student responsibility, respect, and practical ways to hold young people to a higher standard while giving them room to learn from mistakes. He is a member of the Society of Professional Journalists and writes to its Code of Ethics; this site’s editorial standards and corrections policy are published in full.
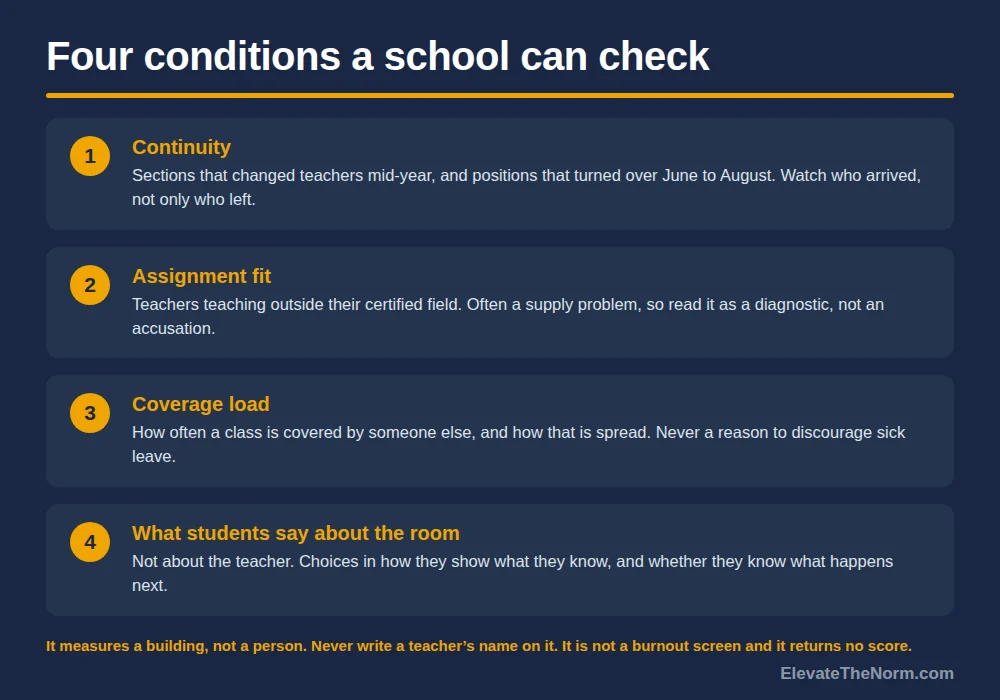
  • Chronic Absenteeism: What Actually Brings Students Back to Class

    Chronic Absenteeism: What Actually Brings Students Back to Class

    By Clay Shumate

    Chronic absenteeism means missing 10 percent or more of the school year — about eighteen days, excused and unexcused combined — and it’s sitting near a quarter of all U.S. students. Most of that isn’t about your lesson plans: illness and lost sleep outrank boredom by a wide margin. But re-entry, what happens the day a student walks back in, is squarely a teacher’s job, and most classrooms have no plan for it at all.

    Key Takeaways

    • Chronic absenteeism counts a student missing 10 percent or more of enrolled school days, excused and unexcused together — it is not the same thing as truancy, which is specifically about unexcused absences and can trigger legal consequences for a family.
    • The national rate peaked near 28.5 percent in 2022, fell to roughly 23.5–25 percent by 2024, and has stalled — the decline slowed enough in 2024 that a full return to the 15 percent pre-pandemic baseline is no longer guaranteed.
    • When students are asked directly why they missed school, illness and lack of sleep dominate the answers. Boredom and disengagement are real but smaller, and high schoolers actually report fewer disengagement reasons after the pandemic than before.
    • Attendance Works sorts causes into four categories — barriers, aversion, disengagement, and misconceptions — and a classroom teacher has real leverage over only two of them.
    • The best-evidenced classroom-adjacent lever isn’t a lesson plan; it’s what happens on re-entry day, and separately, honest and consistent family communication is one of the few things correlated with meaningfully lower rates.

    What Chronic Absenteeism Actually Means

    Chronic absenteeism is a student missing 10 percent or more of enrolled school days in a year — roughly eighteen days in a standard 180-day calendar, or about two days a month. Every state and most districts now track it because it correlates with weaker outcomes at every level, from third-grade reading to ninth-grade credit accumulation to graduation. The count includes excused and unexcused absences together. A student out with the flu for two weeks, a student with a broken attendance streak from oversleeping, and a student who simply stopped coming all land in the same statistic, and the number alone tells you nothing about which one you’re looking at.

    That combined counting is also what separates chronic absenteeism from truancy, and the two get confused constantly in casual conversation. Truancy is specifically about unexcused absences, and in most states it is a legal category with a defined escalation path — a set number of unexcused absences triggers truant status, repeated truancy can trigger a referral, and in the most severe cases a district attorney can pursue charges against a parent or guardian. Chronic absenteeism carries no such court process on its own. A student who is chronically absent because of documented illness has never been truant a single day. Confusing the two terms is how a school ends up applying a punitive, legal-track response to a problem that is, for most students, not a compliance problem at all.

    How Bad Is It, and Is It Getting Better?

    Nationally, chronic absenteeism held steady around 15 percent through the 2018 and 2019 school years. It jumped to roughly 28.5 percent at its 2022 peak, then eased to about 25.4 percent in 2023 and 23.5 percent in 2024. RAND’s 2024–25 district survey put the most recent figure at approximately 22 percent — nearly 11 million students. The trend line is real improvement, and it is also slowing down. Nat Malkus, who tracks the numbers for the American Enterprise Institute, has written plainly that the deceleration raises “the very real possibility that absenteeism rates might never return to pre-pandemic levels.”

    The average also hides where the actual crisis sits. Low-achieving districts went from about 19 percent chronically absent in 2018 to 35 percent in 2022; high-achieving districts moved from 10 percent to 19 percent over the same stretch — both got worse, but the gap between them widened. RAND found urban districts were five to six times more likely than rural or suburban ones to report extreme chronic absence, meaning 30 percent of students or more. If your school sits in that first group, the national “one in four” statistic is understating your actual room by a wide margin.

    The Four Root Causes — and Which Ones Are Actually Yours

    Attendance Works, the research and policy organization most state departments of education cite on this topic, sorts every reason a student misses school into four categories: barriers, aversion, disengagement, and misconceptions about how much a few absences really matter. It’s a useful framework precisely because it forces an honest answer to the question every overwhelmed teacher eventually asks: which part of this is mine to fix?

    CategoryWhat it looks likeWho actually controls it
    BarriersIllness, unreliable transportation, unstable housing, caregiving duties for a sibling or family memberFamily, school system, community resources — not the classroom teacher
    AversionAnxiety about a specific class or hallway, bullying, a bad experience with a particular adultShared — a teacher can remove one specific aversion, but not the underlying anxiety
    DisengagementThe student sees no point in showing up because the work feels irrelevant or the return is unclearLargely the classroom — relevance, relationship, and clarity are teacher-level moves
    MisconceptionsBelief that a handful of absences “doesn’t really matter” as long as grades hold upShared — a teacher’s re-entry practice and a family’s messaging both shape this
    Four-category chart showing the root causes of chronic absenteeism: barriers, aversion, disengagement, and misconceptions, with who controls each one
    The Attendance Works framework for chronic absenteeism, showing which causes a classroom teacher can actually influence.

    Look at that middle column honestly and the division of labor gets clear fast. Barriers are not solvable from a classroom. No lesson plan fixes a broken car, an undiagnosed illness, or a kid watching a younger sibling because there’s nobody else. Pretending otherwise is how teachers end up carrying blame for outcomes they were never equipped to move, and it’s a big part of why attendance initiatives that live entirely inside individual classrooms tend to disappoint — they’re aimed at maybe half the problem.

    Why Most of It Isn’t About Your Classroom

    When you ask students directly why they missed school, the answer that comes back most is not the one teacher-facing advice usually assumes. A 2025 analysis of Rhode Island survey data covering grades 3–12 found illness reported by roughly three-quarters of students both before and after the pandemic — 77 percent post-pandemic specifically. Lack of sleep came in second at 24 percent overall and a striking 33 percent among high schoolers. Boredom and safety concerns did rise after the pandemic, but from a much smaller base, and — this is the finding that should reshape how engagement gets talked about — high school students actually reported fewer disengagement reasons after the pandemic than before it. RAND’s national youth survey landed in the same place: 67 percent sickness, 10 percent anxiety, 9 percent oversleeping.

    Bar chart showing self-reported reasons students miss school: illness 77 percent, lack of sleep 33 percent among high schoolers and 24 percent overall, anxiety 10 percent, oversleeping 9 percent
    Illness and lost sleep outrank boredom by a wide margin in student-reported reasons for absence.

    That doesn’t mean engagement is irrelevant. It means engagement is not the lever most teacher-facing advice on this topic claims it is. If a school’s entire absenteeism strategy is “make class more interesting,” it is aimed at a real but minority slice of the problem, and it will underdeliver — not because the advice is wrong, but because it was never sized to the actual distribution of causes. For the students where disengagement genuinely is the driver, the deeper diagnosis and fix belong in a companion piece on what actually motivates students once rewards and speeches stop working — this page is about the much larger group whose absence has nothing to do with motivation at all.

    What’s Actually Yours: The Four Minutes That Change the Semester

    Here’s the honest, narrower claim. A classroom teacher cannot fix a transportation gap or an untreated illness. What a classroom teacher controls almost completely is what an absence costs a student once they’re back — and that cost is what determines whether eighteen missed days becomes thirty.

    I check the roster before the bell, not after. When I see a student has been out, I already know before they walk through the door — deciding what they need in the doorway, with the rest of the class watching, guarantees a bad decision made badly. If it’s a longer absence, that student gets pulled to the whiteboard table early — the same table I use for regular small-group work, not a separate “catch-up corner.” Low lamp, rug, better chairs. Students already know that table is where you go to be worked with, not managed. That matters more than it sounds like it should: a student coming back from eighteen missed days is highly sensitive to whether re-entry feels like punishment or like being picked back up.

    Reserve the full version of this for absences that actually need it — three or more days, or a pattern, not a single day for a dentist appointment. And none of what follows replaces your school’s required attendance reporting or truancy referral process. If a student’s pattern of absence raises a safety concern — signs of neglect, abuse, homelessness, or anything that meets your district’s mandated-reporting threshold — that goes to your counselor or administrator through the normal protocol immediately, separate from and before any classroom routine. Re-entry is about what a teacher does with the students in front of them; it is not a substitute for the systems built to catch the more serious cases.

    Four things make re-entry actually work.

    Know before they walk in. Check attendance history before class starts, not during it. A decision made in the doorway, in front of an audience, by a teacher who is also trying to start the lesson, is reliably the worst version of that decision.

    Give the shortest honest path back. Not every missed assignment carries the same weight. Ask yourself which pieces were practice and which ones were the actual evidence that the student learned the standard — the practice can often be waived or condensed; the evidence usually can’t. Sorting the pile down to what genuinely matters is a judgment call only the teacher can make, and it’s the difference between a student who can start today and a student who takes one look at forty backlogged items and shuts down. Better still, ask the student what they think is realistic before you hand them the final list — a plan a student helped build survives contact with a hard week better than one that was simply issued to them. This is student responsibility in its most practical form — the student still owns finishing the list, but the list has to be one a person could actually finish, and building it together is what makes it theirs. For an absence stretching past a week or two, or anything with a doctor’s note attached, loop in a counselor or your 504/IEP team before you finalize the plan alone — some of that catch-up may need to be a formal accommodation, not an informal favor.

    Do not make the return a performance. No public accounting of the absence, no comment in front of the class, no sarcasm at the door, and no requirement that the student explain themselves out loud. Some reasons are private — a medical diagnosis, a family situation, a mental health day — and a teacher doesn’t need the full story to run a fair re-entry process. A teenager who’s been gone is already running the social math on what walking back in will cost. Raise that cost and the cheapest option left is to stay gone. This is the same standard covered in respect in the classroom applied to a specific moment: a student’s absence is not public material, and treating it that way trades a little teacher satisfaction for a much worse attendance problem next month. Apply it the same way to every student, every time — the fastest way to make a re-entry routine feel arbitrary is to run it warmly for some students and coldly for others.

    Say when it’s clean. Give a specific date and a specific list, and when the list is finished, say so out loud and mean it. Open-ended debt is what convinces a student the hole is unclimbable. A defined end is what makes climbing rational.

    In practice this is a thirty-second exchange, not a meeting: “Good to see you back. Here’s what actually matters from the last few days — these three things. Everything else, let it go. Can you have these done by Friday?” That’s the whole script. It names what matters, drops what doesn’t, and ends with a date the student agreed to rather than one you handed down.

    Four-step checklist for helping a student return after an absence: know before they walk in, give the shortest honest path back, do not make it a performance, and say when it is clean
    The four re-entry moves that are genuinely within a classroom teacher’s control after chronic absenteeism.

    None of this is softness. The standard doesn’t move — the work still has to be real and the deadline still has to be a deadline. What moves is how much guesswork a student has to do to find their way back to it, and guesswork is where students who are already behind quietly give up. This is the same logic behind natural consequences instead of punishment: the goal is a consequence that teaches something, not one that simply makes the return more painful.

    Expect it to look worse before it looks better, especially with a student who’s been checked out for a while. A kid who suddenly gets real attention after being invisible will often test whether that attention is real — that’s a normal, predictable phase, not proof the approach isn’t working, and it connects directly to what happens the first few weeks after building a relationship with a student who’s been guarded. Most adults quit right at the point where the testing is actually a good sign.

    What the Research Says Works Beyond Your Classroom

    Honesty about the ceiling matters here too. The best-evidenced attendance interventions in the research aren’t classroom practices — they’re family communication, and the effect sizes are real but modest. Which tool carries that communication matters less than whether families can actually receive it — the questions to ask before adopting a communication app start with reach, not features.

    Rogers and Feller, publishing in Nature Human Behaviour in 2018, tested personalized mailings sent to the parents of 28,080 high-risk K–12 students. The most effective versions reduced chronic absenteeism by 10 percent or more, largely by correcting parents’ underestimates of how many days their child had actually missed — many parents simply didn’t know the number was as high as it was. A smaller trial run by the Regional Educational Laboratory Mid-Atlantic in the School District of Philadelphia found a single October postcard cut absences by a more modest 2.4 percent, with no measurable difference between message variations.

    A 2023 analysis by Harvard researchers Karen Mapp and Todd Rogers, working with Learning Heroes and TNTP across more than 3,000 Illinois schools, found something adjacent and worth taking seriously: schools with strong pre-pandemic family engagement — measured through trust, involvement, and parent influence on school decisions — had chronic absenteeism rates roughly six percentage points lower than similar schools with weak engagement, even after controlling for poverty. Between 2019 and 2022, the strong-engagement schools saw a 39 percent smaller increase in chronic absenteeism than everyone else. This is a correlational finding from one state, not a randomized trial, and the researchers themselves describe it as the first phase of a larger project — it should be read as suggestive, not proof that family engagement alone moves the number. But it lines up with the honest re-entry advice above: families who already trust the school and understand what the classroom is doing are the same families likely to reinforce a re-entry plan rather than fight it. In practice that trust gets built with plain, non-alarmist language rather than a form letter — something closer to “I noticed six absences this month, is there anything the school can help with?” than an automated warning that reads like a legal notice. The first invites a conversation. The second reads like the truancy-court track discussed above, even for a family whose child has never come close to it.

    None of this reaches a transportation gap, an untreated health condition, or a family in crisis, and no classroom teacher should feel responsible for the part of the number that genuinely isn’t theirs. What is genuinely theirs — re-entry, and a habit of honest, non-alarmist communication home — is smaller than the whole problem and still worth doing well, because it’s the piece within reach on a Tuesday afternoon, not a district initiative that takes a year to fund.

    What to Do With This on Monday

    Start with one thing: check the roster before the bell and know, before a returning student walks in, what the shortest honest path back looks like for them. Add the no-performance rule next — it costs nothing and it’s the fastest way to stop making re-entry harder than it needs to be. Everything else on this page — the barriers your school actually controls, the family-communication research, the honest accounting of what disengagement is and isn’t driving — belongs to a bigger conversation about chronic absenteeism than one classroom can solve alone. Your four minutes with a returning student is the part that starts today. For a ready-to-use tool on this, see a printable parent-teacher communication log pack. Absence is also the clearest single thing that got worse since 2019, which is why it sits near the top of our review of whether student behavior is actually getting worse.


    Is chronic absenteeism the same thing as truancy?

    No. Chronic absenteeism counts a student missing 10 percent or more of enrolled school days, whether the absences are excused or unexcused. Truancy is a narrower legal category built specifically from unexcused absences, and in most states it comes with a defined escalation process that can eventually involve a district attorney and consequences for a parent or guardian. A student who is chronically absent because of documented illness has never been truant. Treating the two as interchangeable is how schools end up applying a legal, punitive response to a problem that, for most students, was never about defiance.

    Whose fault is chronic absenteeism — the school, the family, or the student?

    Usually none of the above, at least not in the way the question assumes. National survey data shows the leading reasons students miss school are illness and lost sleep, not defiance or indifference. Framing absence as a fault to assign tends to produce blame instead of a fix. The more useful question is which piece of the problem a given adult actually has leverage over — a classroom teacher, a family, and a school system each control a different slice.

    What can one classroom teacher realistically do about chronic absenteeism?

    Less than district-level interventions, and that’s fine — a teacher’s real leverage is re-entry, not prevention. Checking the roster before class, sorting missed work down to what actually matters, keeping a returning student’s absence private, and giving a clear date when the catch-up is finished are all inside a single teacher’s control and take a few minutes per student. Preventing the absence in the first place usually depends on factors — transportation, health, housing — that sit outside any one classroom.

    Does missing school always mean a student doesn’t care about class?

    No, and the data says the opposite more often than not. When students are asked directly why they were out, illness and lack of sleep dominate the answers, and one national analysis found high schoolers reporting fewer disengagement-related reasons for absence after the pandemic than before it. Assuming apathy is usually wrong, and assuming it out loud to a student who was actually sick or exhausted damages the relationship for no reason.

    How should a teacher handle makeup work without overwhelming a student who’s behind?

    Sort before you hand anything over. Separate what was practice from what was the actual evidence that a student learned the standard, and let most of the practice go. Ask the student what they think is realistic before finalizing the list — a plan they helped build holds up better than one that was simply issued. For anything longer than a week or two, or work tied to a documented medical absence, loop in a counselor or the student’s 504/IEP team rather than solving it alone.

    What if a student’s pattern of absences seems like a sign of something more serious?

    That goes to your school’s counselor or administrator through your normal mandated-reporting and attendance-review process immediately — before, and separate from, any classroom re-entry routine. Signs like a sudden pattern change, indications of neglect or abuse, or signs of homelessness are outside what a classroom-level practice is built to address, and they need the systems your school already has for exactly that purpose.

    Do attendance letters or family outreach actually reduce absences?

    Some forms do, modestly. A large study of personalized parent mailings correcting misperceptions about how many days a child had actually missed reduced chronic absenteeism by roughly 10 percent in its most effective version; a simpler single postcard trial produced a smaller 2.4 percent reduction. The tone matters — plain, non-alarmist language that reads like a conversation (‘is there anything the school can help with?’) is associated with better outcomes than a form letter that reads like a legal warning, even though neither approach comes close to solving the problem on its own.

    What’s a realistic first step for a teacher who wants to get better at this?

    Start with one habit: check attendance before the bell so you already know, before a student walks in, what their shortest honest path back looks like. Add the no-performance rule next — keeping the return private costs nothing and prevents the single most common way teachers accidentally make attendance worse. Everything else on this page is worth knowing, but those two moves are where an ordinary Tuesday actually changes.


    Sources


    About Clay Shumate

    Clay Shumate is a certified secondary Social Studies teacher in the public schools of West Alabama, with seven years of classroom experience, a B.A. in History, and an M.Ed. in Secondary Education. He writes about project-based learning, student responsibility, respect, and practical ways to hold young people to a higher standard while giving them room to learn from mistakes. He is a member of the Society of Professional Journalists and writes to its Code of Ethics; this site’s editorial standards and corrections policy are published in full. More about Clay.
  • Why Are Classroom Expectations Important? Because Students Deserve Clarity

    Why Are Classroom Expectations Important? Because Students Deserve Clarity

    By Clay Shumate · Updated October 24, 2026

    Why are classroom expectations important? Because a room without them runs on guesswork, and guesswork is unfair to the student who can’t read your mood on a given day. Clear, taught expectations tell a class exactly what the room requires and what it promises back — protected instructional time, predictable fairness, and a real path toward independence.

    Key Takeaways

    • Clear expectations reduce discipline problems and protect instructional time — Marzano’s research found teachers with strong management practices and high-quality relationships had 31 percent fewer discipline issues over a full year.
    • Expectations are not rules posted on a wall. They are behaviors you teach, model, practice, and revisit — the same way you teach content.
    • Adolescents respond better to expectations they understand the reasoning behind. Stating a standard without explaining why it exists invites testing.
    • Consistency matters more than severity. A predictable room where small things are addressed early is calmer than a room where nothing happens until someone explodes.
    • Expectations must go both ways. If students are expected to be prepared, on time, and respectful, the adult in the room owes them the same.

    What Are Classroom Expectations?

    Classroom expectations are the specific, observable behaviors that define how a learning environment operates. They cover how students enter the room, how they participate, how they treat each other, how they handle materials, what happens when they finish early, and what happens when they need help.

    That is different from rules. Rules tell students what not to do. Expectations tell them what to do instead — and the research consistently favors the second approach. Positively stated expectations (“Be prepared with your materials before the bell”) give students a target to hit rather than a minefield to avoid. If you are building a complete set of classroom expectations for the first time, starting with positively stated behaviors is the most important decision you will make.

    Side-by-side comparison showing the difference between classroom rules and classroom expectations, with rules focused on what not to do and expectations focused on what to do
    Rules tell students what not to do. Expectations tell them what to do instead.

    The distinction matters more than it sounds. “No talking” is a rule. “Use a voice level appropriate to the activity” is an expectation. The first one creates a room where students are trying not to get caught. The second creates a room where students are making judgments about what the moment requires — and that judgment is a skill worth developing.

    Classroom rulesClassroom expectations
    What they stateWhat not to doWhat to do instead
    Example“No talking”“Use a voice level appropriate to the activity”
    Who they apply toStudentsEveryone in the room, teacher included
    How they are learnedPosted and announcedTaught, modeled, practiced, and revisited
    What they buildAvoiding getting caughtJudgment about what the moment requires
    Classroom rules vs. classroom expectations at a glance.

    Why Are Classroom Expectations Important in Middle and High School?

    They Protect Instructional Time

    Research from the IRIS Center at Vanderbilt University is direct about this: teachers who establish and maintain clear norms for behavior spend more time teaching because less time goes to discipline (Brophy, 2000). Every minute spent restating a procedure that was never taught properly is a minute taken from the content students came to learn.

    In a secondary classroom with 50-minute periods — or in some cases, 90-minute blocks — lost minutes compound fast. If a teacher loses five minutes every period to transitions that were never practiced, that is 25 minutes a day across five classes. Over a semester, that is roughly 2,250 minutes — more than 37 hours of instruction gone.

    They Reduce Anxiety and Guesswork

    This is the part most teachers underestimate. Adolescents are performing a complicated identity negotiation every period of every day. They are testing who they are, what their peers think of them, how much authority to accept, and how much risk to take. A room with clear expectations removes one variable from that equation: they do not have to guess what the teacher wants.

    The Australian Education Research Organisation reviewed the evidence and found that when behavioral standards are transparent, “students feel more secure because they know where they stand” (DeNobile, 2021). Security does not mean softness. It means the room is predictable — and predictable rooms are calmer rooms.

    They Make Fairness Visible

    One of the fastest ways to lose a teenager’s trust is to enforce something they did not know existed. When expectations are public, taught, and consistent, a correction becomes a reference to a shared agreement rather than a personal attack. “We said prepared means materials out before the bell — grab your notebook” is a different conversation than “Why aren’t you ready?”

    The first version holds the standard. The second version questions the student. Adolescents can feel the difference, and they respond accordingly. This same principle applies to how teachers handle respect in the classroom — fairness is not about treating every moment identically, but about making every standard visible and every correction consistent.

    They Build Independence Over Time

    Here is what gets overlooked: clear expectations are not about control. They are a scaffold. When students know the procedures, they stop relying on the teacher to direct every transition, every material distribution, and every shift between activities. They run the routines themselves — and that frees the teacher to do the work that actually requires a human being: circulating, checking understanding, pulling small groups, and responding to what students need in real time.

    I spend most of my class period moving between groups, sitting down with students at the whiteboard table I built in the corner of my room. That table is the best seat in the house — low lamp, a rug, better chairs. Students ask to come there. But the only reason I can spend my time that way is because the rest of the room is running on expectations we practiced until they became automatic. If I had to stand at the front managing every transition, that table would just be furniture.

    How Do You Teach Classroom Expectations?

    Posting expectations on a wall is step one of a five-step process. Stopping there is the most common mistake secondary teachers make — and it is the reason so many give up on expectations by October. If you have already created a classroom expectations poster, that visual is useful — but it is the beginning of the work, not the end of it. A free Classroom Norms Poster Set on TPT gives you something to point to once the class agrees on what the standard is.

    Infographic showing the five steps to teaching classroom expectations: identify key behaviors, state them in observable language, model and practice, reinforce consistently, and revisit and adjust
    Teaching expectations requires five deliberate steps — not just posting them on a wall.

    Step 1: Identify the Behaviors That Matter Most

    You cannot have 30 expectations. You can have five or six — the ones that cover the situations your students encounter every day. Start with the moments that consistently cause problems: entering the room, transitions between activities, asking for help, working with a partner, and what to do when you finish early.

    Step 2: State Them in Observable Language

    An expectation is only useful if you can see whether someone is meeting it. “Be respectful” is not observable. “Listen without interrupting when someone is speaking to the class” is. “Be responsible” is not observable. “Turn in your work by the deadline or communicate with me before it passes” is.

    The IRIS Center recommends keeping rules few, universal, and positively stated — then linking specific procedures to each one (IRIS Center, 2003). A general expectation like “Be prepared” needs concrete procedures attached: what “prepared” looks like in this room, by this bell, for this type of activity.

    Step 3: Model and Practice

    This is where secondary teachers get uncomfortable. Modeling expectations feels elementary — and most of us skipped it. But the research is clear: students perform better when expectations are explicitly taught through demonstration, not merely announced (Archer & Hughes, 2011).

    Model what a good transition looks like. Model what asking for help looks like. Model the wrong way, too, if you can do it with humor and not sarcasm — so students see the contrast. Then let them practice. The first three days of the year are not lost instruction. They are the most important instruction you will give all year. This is especially critical if you are in your first years and still working out classroom management as a new teacher.

    Step 4: Reinforce Consistently, Not Loudly

    Marzano’s meta-analysis found that the quality of teacher-student relationships was the most important variable in effective classroom management — teachers with strong relationships and clear expectations had 31 percent fewer discipline problems across the year (Marzano et al., 2003). That finding matters because it means enforcement does not require volume. It requires consistency and connection.

    When a student does not meet an expectation, address it immediately, briefly, and at close range. A quiet redirect while you are already circulating — “Materials out, please” — costs less social capital than a public correction from across the room. And it preserves the relationship that makes the expectation stick. Strong relationships with students are not a separate initiative from classroom management — they are the mechanism that makes management work.

    Step 5: Revisit and Adjust

    Expectations are not a September activity. They need to be revisited after breaks, after schedule changes, after a stretch of bad days, and after you realize one of your expectations was unreasonable in the first place. Acknowledging that an expectation needs adjusting is not weakness. It is modeling exactly the kind of honest self-assessment you want from students.

    What Happens When Classroom Expectations Are Missing?

    The consequences of vague or absent expectations are not dramatic. They are gradual — and that is what makes them dangerous.

    Visual showing the costs of missing classroom expectations: lost instructional time, reactive discipline cycles, eroded trust, and disproportionate impact on marginalized students
    Without clear expectations, teachers spend more time managing confusion than teaching content.

    Without clear expectations, teachers tend to rely on reactive discipline: waiting for something to go wrong and then responding. That pattern creates an exhausting cycle. The teacher feels like they are constantly putting out fires. The students feel like the rules change depending on the teacher’s mood. Both sides get frustrated, and the relationship erodes. That fire-fighting cycle is one of the most reliable routes into exhaustion, and most of what prevents it is structural rather than a matter of willpower.

    Research on teacher expectations confirms this pattern. A 2024 narrative review published in the Journal of the Royal Society of New Zealand found that teachers’ expectations significantly influence student outcomes, and that inconsistent or unclear expectations disproportionately affect students from marginalized backgrounds (Rubie-Davies et al., 2024). Students who already face barriers outside of school should not have to decode a second set of hidden expectations inside it.

    For a practical look at what those belief-driven expectations actually require—the specific moves, language, and mindset that separate genuine high expectations from surface-level optimism—see holding students to high expectations in secondary classrooms.

    Expectations Go Both Ways

    This is the part that separates a set of classroom expectations from a set of classroom rules. Rules flow in one direction — from the teacher to the student. Expectations, done well, apply to everyone in the room.

    If students are expected to arrive on time, the teacher starts on time. If students are expected to be prepared, the teacher has the plan posted and the materials ready. If students are expected to listen without interrupting, the teacher does the same when a student is speaking.

    That does not mean teachers and students hold identical authority. They do not. But mutual respect for each other’s time, effort, and presence is what turns expectations from a behavior-management tool into a culture.

    Three Things Your Expectations Cannot Decide for You

    No classroom expectations list exists in isolation. Before you finalize yours, account for these:

    Your school’s behavior framework comes first. If your building uses PBIS, a schoolwide behavior matrix, or a restorative practices model, your classroom expectations must align with it — not contradict it. A classroom expectation that conflicts with the schoolwide framework confuses students who are trying to follow both, and it puts you in an awkward position with administrators when a situation escalates beyond your room.

    IEPs and 504 plans take legal precedence. A student’s documented behavior intervention plan overrides your classroom expectations for that student. This is not optional, and it is not a weakening of your standards. It is the law. Consult with the special education team before the year starts and whenever a new student with a plan enters your class.

    Families should know what you expect in week one. Send your expectations home — in writing, not just verbally through students. A parent who understands what the room requires can support it. A parent who discovers your expectations only when their child gets a consequence feels blindsided, and that damages a relationship you may need later.

    A Practical Starting Point

    If you are starting from scratch — or starting over — here is what works:

    Pick three to five expectations that cover the broadest range of daily situations. State each one in observable, positive language. On the first day, explain each one, model it, let students practice it, and explain why it exists. Then hold it — every day, every period, for every student — without exceptions that are not also explained publicly.

    It is not complicated. But it is relentless, and the relentlessness is the point. Students do not learn expectations from a poster. They learn them from a teacher who means what they say and says it every single day until the room runs on its own. The same principle applies to teaching student responsibility — it is a daily practice, not a one-time conversation.


    What are the benefits of classroom expectations?

    Clear, taught expectations protect instructional time, reduce student anxiety and guesswork, make fairness visible because corrections refer to a shared agreement, and build independence as students learn to run routines on their own. Marzano’s research links strong management and relationships to 31 percent fewer discipline problems over a school year.

    What are examples of good classroom expectations?

    Good expectations are positive and observable. Examples: “Be prepared with your materials before the bell,” “Use a voice level appropriate to the activity,” and “Listen without interrupting when someone is speaking to the class.” Most secondary classrooms need three to six that cover entering the room, transitions, asking for help, partner work, and finishing early.

    How many expectations should a secondary classroom have?

    Three to six. More than that and students cannot remember them, teachers cannot enforce them consistently, and the list starts contradicting itself. Each expectation should be broad enough to cover multiple situations but specific enough to be observable. If you need more than six, you probably need better procedures underneath fewer expectations.

    Are classroom expectations the same as classroom rules?

    Not exactly. Rules typically tell students what they cannot do and carry stated consequences. Expectations tell students what the room requires and are stated positively — what to do, not what to avoid. In practice, many teachers use a small set of expectations supported by procedures, with consequences understood but not the headline. The research favors positively stated expectations because they give students a behavior to perform, not just a behavior to suppress.

    When should expectations be introduced — the first day or after content starts?

    The first day. Marzano’s research and the IRIS Center’s synthesis both agree: explicitly teaching expectations during the first days of school produces better outcomes than announcing rules and moving to content. Time spent modeling, practicing, and discussing expectations in week one saves far more time than it costs over the remaining weeks of the semester.

    Do expectations work with students who have behavioral challenges?

    Clear expectations help every student, but they are especially important for students with behavioral challenges, including those with IEPs or 504 plans. Predictability reduces anxiety, and publicly stated expectations prevent the perception that consequences are personal or arbitrary. That said, individual behavior plans required by an IEP or 504 take legal precedence over classroom expectations — always follow the documented plan and consult with the special education team.

    How do you handle a student who refuses to follow expectations?

    Start with a private, calm conversation — not a public confrontation. Ask what happened. Restate the expectation. Give the student a clear path to meet it. If the behavior continues, follow your escalation process and document. Never abandon the expectation itself because one student resists it. The other 25 students are watching to see whether the standard is real.

    Should students help create classroom expectations?

    Research supports involving students in the process when it is genuine — not performative. A class discussion about why an expectation exists and what it should look like increases buy-in, especially with adolescents who need to understand the reasoning behind a standard. What does not work is asking students to create the expectations entirely and then overriding them when you do not like the result. If you ask for input, use it.

    Do expectations need to be revisited after the first week?

    Yes — after every long break, after a schedule change, after a substitute teacher, and after any stretch where the room has drifted. Expectations are not a contract signed and filed. They are a practice maintained through repetition and honest conversation about what is working and what is not.


    Sources


    About Clay Shumate

    Clay Shumate is a certified secondary Social Studies teacher in the public schools of West Alabama, with seven years of classroom experience, a B.A. in History, and an M.Ed. in Secondary Education. He writes about project-based learning, student responsibility, respect, and practical ways to hold young people to a higher standard while giving them room to learn from mistakes. He is a member of the Society of Professional Journalists and writes to its Code of Ethics; this site’s editorial standards and corrections policy are published in full. More about Clay.
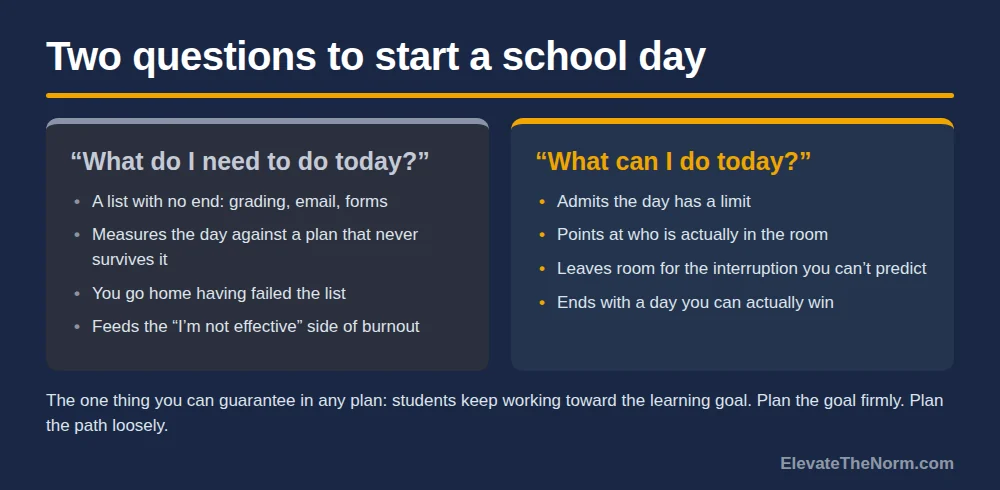
Teacher Emergency Toolkit — practical resources, real classroom support. Shop on TPT.Teacher Emergency Toolkit — practical resources, real classroom support. Shop on TPT.